You are not logged in.
This means you
CAN ONLY VIEW reports that were published prior to Thursday, March 20, 2025.
You
MUST UPGRADE YOUR MEMBERSHIP if you want to see any current reports.
AFTER MARKET UPDATE - FRIDAY, OCTOBER 13TH, 2017
Previous After Market Report Next After Market Report >>>
|
|
|
|
DOW |
+30.71 |
22,871.72 |
+0.13% |
|
Volume |
768,068,570 |
-3% |
|
Volume |
1,758,390,799 |
-13% |
|
NASDAQ |
+14.29 |
6,605.80 |
+0.22% |
|
Advancers |
1,742 |
60% |
|
Advancers |
1,395 |
50% |
|
S&P 500 |
+2.24 |
2,553.17 |
+0.09% |
|
Decliners |
1,165 |
40% |
|
Decliners |
1,418 |
50% |
|
Russell 2000 |
-2.51 |
1,502.66 |
-0.17% |
|
52 Wk Highs |
259 |
|
|
52 Wk Highs |
235 |
|
|
S&P 600 |
-1.06 |
908.37 |
-0.12% |
|
52 Wk Lows |
29 |
|
|
52 Wk Lows |
43 |
|
|
 |
Major Indices Finish Perched at Record Levels
Kenneth J. Gruneisen - Passed the CAN SLIM® Master's Exam
The Dow was up 30 points to 22871. The S&P 500 gained 2 points to 2553 and the Nasdaq Composite climbed 14 points to 6605. For the week, the Dow gained 0.4% while the S&P 500 and Nasdaq added 0.2%. Volume totals reported were lighter than the prior session totals on the NYSE and on the Nasdaq exchange. Advancers led decliners by a 3-2 margin on the NYSE, but decliners narrowly led advancers on the Nasdaq exchange. There were 102 high-ranked companies from the Leaders List that made new 52-week highs and were listed on the BreakOuts Page, versus the total of 90 on the prior session. New 52-week highs totals solidly outnumbered new 52-week lows totals on the Nasdaq exchange and on the NYSE. The Featured Stocks Page provides the latest analysis on noteworthy high-ranked leaders. Charts used courtesy of www.stockcharts.com
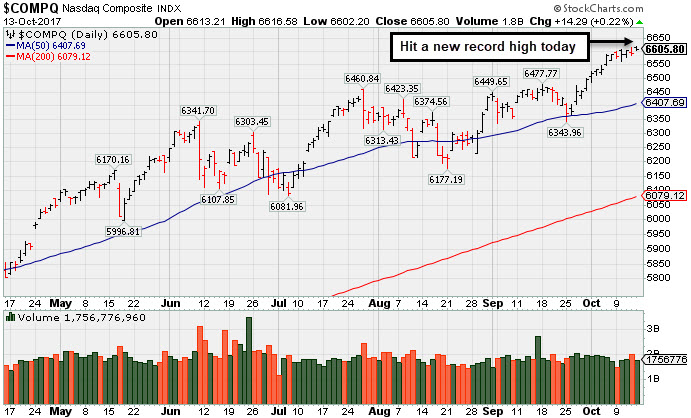 PICTURED: The Nasdaq Composite Index hit another new record high.
The major averages' (M criteria) are in a confirmed uptrend. Leadership has remained healthy. Investors should buy stocks meeting all key criteria of the fact-based investment system on a case-by-case basis as they trigger technical buy signals.
Stocks finished higher on Friday as investors digested economic and corporate earnings updates. A key update on the data front showed that consumer price inflation rose 0.5% in September, below expectations of a 0.6% increase. Subtracting the effects of food and gas, the gauge climbed 0.1% versus projections of a 0.2% rise. Separately, retail sales rose the most in two years in September amid Hurricane Harvey-inspired auto sales while the University of Michigan reported that consumer sentiment climbed to the highest level since 2004 at the start of October.
Six of 11 sectors in the S&P 500 declined on the session. Tech shares paced the gains while Telecom and Utilities lagged. In earnings, Bank of America (BAC +1.49%) rose after topping Wall Street profit and sales projections. Trucker J.B Hunt (JBHT -4.01%) fell after results missed analyst forecasts. HP Inc. (HPQ +6.42%) rallied after providing optimistic guidance for 2018. AT&T (T -0.45%) slumped further, bringing its weekly descent to -7.5%.
Treasuries moved higher and yields fell following the inflation update and geopolitical concerns involving Iran. The 10-year note yield slipped 4 basis points to 2.28%. In commodities, NYMEX WTI crude jumped 1.5% to $51.35/barrel while gold added 0.6% to $1298.60/ounce. In FOREX, the dollar was little-changed Friday but finished with its worst weekly performance in more than a month. |
 Kenneth J. Gruneisen started out as a licensed stockbroker in August 1987, a couple of months prior to the historic stock market crash that took the Dow Jones Industrial Average down -22.6% in a single day. He has published daily fact-based fundamental and technical analysis on high-ranked stocks online for two decades. Through FACTBASEDINVESTING.COM, Kenneth provides educational articles, news, market commentary, and other information regarding proven investment systems that work in good times and bad.
Comments contained in the body of this report are technical opinions only and are not necessarily those of Gruneisen Growth Corp. The material herein has been obtained from sources believed to be reliable and accurate, however, its accuracy and completeness cannot be guaranteed. Our firm, employees, and customers may effect transactions, including transactions contrary to any recommendation herein, or have positions in the securities mentioned herein or options with respect thereto. Any recommendation contained in this report may not be suitable for all investors and it is not to be deemed an offer or solicitation on our part with respect to the purchase or sale of any securities. |
|
 |
Oil Services, Retail, Semiconductor, and Networking Indexes Rose
Kenneth J. Gruneisen - Passed the CAN SLIM® Master's Exam
On Friday the Bank Index ($BKX -0.48%) and the Broker/Dealer Index ($XBD -0.37%) both edged lower, meanwhile the Retail Index ($RLX +0.46%) gained some ground. The tech sector saw modest gains from the Semiconductor Index ($SOX +0.67%) and the Networking Index ($NWX +0.31%), but the Biotechnology Index ($BTK -0.19%) ended the session slightly in the red. The Gold & Silver Index ($XAU +0.19%) and Integrated Oil Index ($XOI +0.17%) inched higher while the Oil Services Index ($OSX +0.83%) was a standout gainer. Charts courtesy www.stockcharts.com
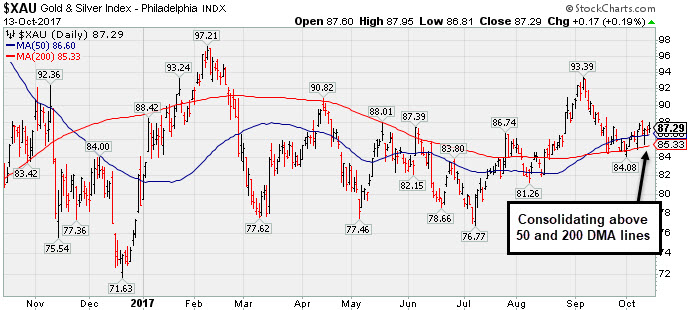 PICTURED: The Gold & Silver Index ($XAU +0.19%) is consolidating above its 50-day and 200-day moving average (DMA) lines.
| Oil Services |
$OSX |
138.09 |
+1.14 |
+0.83% |
-24.87% |
| Integrated Oil |
$XOI |
1,219.90 |
+2.03 |
+0.17% |
-3.79% |
| Semiconductor |
$SOX |
1,219.21 |
+8.11 |
+0.67% |
+34.50% |
| Networking |
$NWX |
466.84 |
+1.46 |
+0.31% |
+4.65% |
| Broker/Dealer |
$XBD |
246.44 |
-0.91 |
-0.37% |
+20.05% |
| Retail |
$RLX |
1,559.55 |
+7.19 |
+0.46% |
+16.13% |
| Gold & Silver |
$XAU |
87.29 |
+0.17 |
+0.20% |
+10.69% |
| Bank |
$BKX |
98.88 |
-0.48 |
-0.48% |
+7.72% |
| Biotech |
$BTK |
4,261.55 |
-8.19 |
-0.19% |
+38.59% |
|
|
|
 |
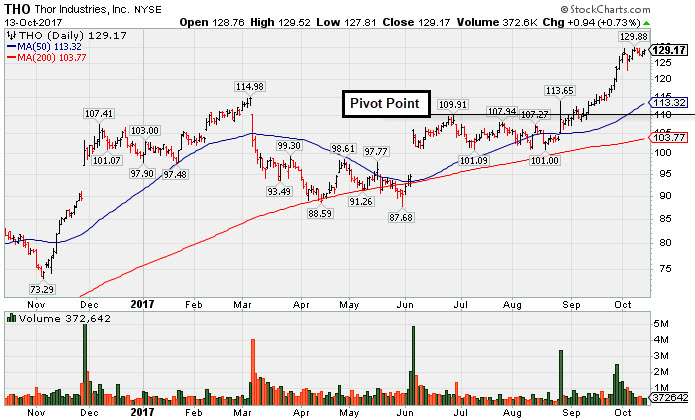
Extended From Prior Base With Volume Totals Cooling
Kenneth J. Gruneisen - Passed the CAN SLIM® Master's Exam
Thor Industries Inc (THO +$0.94 or +0.73% to $129.17) is perched near its 52-week high, stubbornly holding its ground with volume totals cooling after an impressive spurt of volume-driven gains. Prior highs in the $115 area define initial support to watch on pullbacks. Its current Relative Strength Rating of 91, up from 79 when last shown in this FSU section on 9/18/17 with an annotated graph under the headline, "Wedged to New High Then Ended the Session Weak", as it was noted - "No resistance remains due to overhead supply. It is not more than +5% above the pivot point previously cited. Any volume-driven gains into new all-time high territory might signal the beginning of a significant new leg up in price."
The Building - Mobile/Mfg & RV firm was highlighted in yellow with pivot point cited based on its 4/27/17 high in the 6/07/17 mid-day report (read here). It had gapped up on 6/06/17, clearing a "double bottom" base while rebounding toward prior highs.
Fundamentals remain strong. Recently it reported earnings +44% on +50% sales revenues for the Jul '17 quarter, continuing its strong earnings history. The past 4 quarters were above the +25% minimum earnings guideline (C criteria) of the fact-based investment system. Its annual earnings history (A criteria) has been good. Return on Equity is reported at 26%, well above the 17% minimum guideline.
It has earned a current Timeliness rating of A and a Sponsorship rating of B. The number of top-rated funds owning its shares rose from 489 in Mar '16 to 607 in Jun '17. Its current Up/Down Volume Ratio of 3.9 is an unbiased indication its shares have been under accumulation over the past 50 days (I criteria). Its small supply of only 48.9 million shares (S criteria) in the public float can contribute to greater volatility in the event of institutional buying or selling. |
|
|
Color Codes Explained :
Y - Better candidates highlighted by our
staff of experts.
G - Previously featured
in past reports as yellow but may no longer be buyable under the
guidelines.
***Last / Change / Volume data in this table is the closing quote data***
Symbol/Exchange
Company Name
Industry Group |
PRICE |
CHANGE
(%Change) |
Day High |
Volume
(% DAV)
(% 50 day avg vol) |
52 Wk Hi
% From Hi |
Featured
Date |
Price
Featured |
Pivot Featured |
|
Max Buy |
MPX
-
NYSE
Marine Products Corp
AUTOMOTIVE - Recreational Vehicles
|
$15.46
|
-0.14
-0.90% |
$15.60
|
18,403
57.51% of 50 DAV
50 DAV is 32,000
|
$17.12
-9.70%
|
9/26/2017
|
$16.30
|
PP = $16.35
|
|
MB = $17.17
|
Most Recent Note - 10/11/2017 5:07:28 PM
Y - Volume totals have been cooling. Recent losses negated the breakout attempt and it slumped back into the prior base raising concerns. Confirming volume-driven gains above the pivot point and for new highs would be a very reassuring sign of fresh institutional buying demand,
>>> FEATURED STOCK ARTICLE : Powerboat Maker Hit Another New 52-Week High - 9/26/2017 |
View all notes |
Set NEW NOTE alert |
Company Profile |
SEC
News |
Chart |
Request a new note
C
A
S
I |
THO
-
NYSE
Thor Industries Inc
AUTOMOTIVE - Recreational Vehicles
|
$129.17
|
+0.94
0.73% |
$129.52
|
372,623
54.48% of 50 DAV
50 DAV is 684,000
|
$129.88
-0.55%
|
8/14/2017
|
$106.67
|
PP = $110.01
|
|
MB = $115.51
|
 Most Recent Note - 10/13/2017 5:52:39 PM
G - Perched at its all-time high after 8 consecutive weekly gains, very extended from the previously noted base. Prior highs in the $115 area define initial support to watch on pullbacks. Fundamentals remain strong. See the latest FSU analysis for more details and a new annotated graph.
>>> FEATURED STOCK ARTICLE : Extended From Prior Base With Volume Totals Cooling - 10/13/2017 |
View all notes |
Set NEW NOTE alert |
Company Profile |
SEC
News |
Chart |
Request a new note
C
A
S
I |
PFBC
-
NASDAQ
Preferred Bank Los Angls
BANKING - Regional - Pacific Banks
|
$58.62
|
-0.84
-1.41% |
$59.50
|
41,053
63.16% of 50 DAV
50 DAV is 65,000
|
$60.99
-3.89%
|
10/10/2017
|
$59.38
|
PP = $59.08
|
|
MB = $62.03
|
Most Recent Note - 10/11/2017 6:04:51 PM
Y - Ended slightly lower with a 3rd consecutive small loss today with above average volume. It was highlighted in yellow with pivot point cited based on its 7/20/17 high plus 10 cents in the 10/10/17 mid-day report. Hit new 52-week highs, triggering a technical buy signal with considerable volume-driven gains on 9/27 and 9/28. Faces no resistance due to overhead supply. Reported earnings +31% on +26% sales revenues for the Jun '17 quarter, its 3rd consecutive quarterly comparison above the +25% minimum guideline (C criteria). See the latest FSU analysis for more details and a new annotated graph.
>>> FEATURED STOCK ARTICLE : Perched Near High Following Volume-Driven Breakout Gains - 10/11/2017 |
View all notes |
Set NEW NOTE alert |
Company Profile |
SEC
News |
Chart |
Request a new note
C
A
S
I |
AVGO
-
NASDAQ
Broadcom Limited
ELECTRONICS - Semiconductor - Broad Line
|
$247.96
|
-0.78
-0.31% |
$250.84
|
1,521,909
59.38% of 50 DAV
50 DAV is 2,563,000
|
$259.36
-4.40%
|
8/24/2017
|
$252.44
|
PP = $256.89
|
|
MB = $269.73
|
Most Recent Note - 10/10/2017 5:52:09 PM
G - Met resistance today, meanwhile, a rebound above the 50 DMA line ($246.88) is needed for its outlook to improve. Damaging losses below the recent low ($231.53 on 9/25/17) would raise serious concerns and trigger a more worrisome technical sell signal.
>>> FEATURED STOCK ARTICLE : Technical Deterioration Raises Concerns - 9/21/2017 |
View all notes |
Set NEW NOTE alert |
Company Profile |
SEC
News |
Chart |
Request a new note
C
A
S
I |
YY
-
NASDAQ
YY Inc Ads
INTERNET - Internet Service Providers
|
$93.22
|
+2.14
2.35% |
$93.68
|
1,177,164
65.07% of 50 DAV
50 DAV is 1,809,000
|
$94.00
-0.83%
|
9/25/2017
|
$80.26
|
PP = $83.10
|
|
MB = $87.26
|
Most Recent Note - 10/13/2017 6:09:48 PM
G - Ended the session at a best-ever close with its 3rd consecutive gain backed by below average volume, getting more extended from its prior base. Prior highs in the $83 area define initial support to watch above its 50 DMA line ($79.37).
>>> FEATURED STOCK ARTICLE : Encountered Distributional Pressure When Challenging Prior HIgh - 9/25/2017 |
View all notes |
Set NEW NOTE alert |
Company Profile |
SEC
News |
Chart |
Request a new note
C
A
S
I |
Symbol/Exchange
Company Name
Industry Group |
PRICE |
CHANGE
(%Change) |
Day High |
Volume
(% DAV)
(% 50 day avg vol) |
52 Wk Hi
% From Hi |
Featured
Date |
Price
Featured |
Pivot Featured |
|
Max Buy |
STMP
-
NASDAQ
Stamps.com Inc
INTERNET - Internet Software and Services
|
$218.35
|
-4.00
-1.80% |
$224.64
|
382,855
87.21% of 50 DAV
50 DAV is 439,000
|
$224.30
-2.65%
|
9/11/2017
|
$193.65
|
PP = $220.35
|
|
MB = $231.37
|
Most Recent Note - 10/13/2017 6:07:32 PM
Y - Faces no resistance, however it has stalled near its pivot point based on its 8/07/17 high plus 10 cents. Subsequent volume-driven gains above the pivot point are needed to trigger a proper new (or add-on) technical buy signal. Its 50 DMA line ($205) defines important near-term support above the recent low ($195.05 on 9/28/17) where violations would trigger technical sell signals.
>>> FEATURED STOCK ARTICLE : Perched Near Pivot Point With No Resistance Remaining - 10/4/2017 |
View all notes |
Set NEW NOTE alert |
Company Profile |
SEC
News |
Chart |
Request a new note
C
A
S
I |
HTHT
-
NASDAQ
China Lodging Group Ads
LEISURE - Lodging
|
$127.38
|
+1.72
1.37% |
$130.30
|
422,778
114.57% of 50 DAV
50 DAV is 369,000
|
$138.44
-7.99%
|
9/29/2016
|
$46.12
|
PP = $47.82
|
|
MB = $50.21
|
Most Recent Note - 10/10/2017 12:11:46 PM
G - Retreating today from a record high hit on the prior session. Very extended from any sound base. Earnings +19% on +18% sales revenues for the Jun '17 quarter were below the +25% minimum earnings guideline (C criteria). Its 50 DMA line ($113) defines near-term support.
>>> FEATURED STOCK ARTICLE : Holding Ground Stubbornly After Considerable Rally - 10/5/2017 |
View all notes |
Set NEW NOTE alert |
Company Profile |
SEC
News |
Chart |
Request a new note
C
A
S
I |
LMAT
-
NASDAQ
Lemaitre Vascular Inc
Medical-Products
|
$37.11
|
-0.17
-0.46% |
$37.18
|
109,190
59.99% of 50 DAV
50 DAV is 182,000
|
$39.29
-5.56%
|
7/28/2017
|
$33.50
|
PP = $33.32
|
|
MB = $34.99
|
Most Recent Note - 10/11/2017 3:59:48 PM
G - Extended from any sound base, and volume totals have been cooling while consolidating. Near-term support at its 50 DMA line coincides with prior highs in the $36 area.
>>> FEATURED STOCK ARTICLE : Quietly Pulling Back From High After More Volume-Driven Gains - 9/22/2017 |
View all notes |
Set NEW NOTE alert |
Company Profile |
SEC
News |
Chart |
Request a new note
C
A
S
I |
ESNT
-
NYSE
Essent Group Ltd
Finance-MrtgandRel Svc
|
$41.60
|
+1.08
2.67% |
$41.72
|
947,325
121.65% of 50 DAV
50 DAV is 778,700
|
$41.44
0.39%
|
10/9/2017
|
$39.75
|
PP = $41.54
|
|
MB = $43.62
|
Most Recent Note - 10/13/2017 5:56:51 PM
Y - Hit a new all-time high and finished strong with today's 4th consecutive gain on ever-increasing volume, however, the session's volume total was only +22% above average. No resistance remains due to overhead supply. Gains above the pivot point must have at least +40% above average volume to trigger a proper technical buy signal under the fact-based investment system's rules.
>>> FEATURED STOCK ARTICLE : Perched Within Close Striking Distance of Prior High - 9/29/2017 |
View all notes |
Set NEW NOTE alert |
Company Profile |
SEC
News |
Chart |
Request a new note
C
A
S
I |
FIVE
-
NASDAQ
Five Below Inc
Retail-DiscountandVariety
|
$55.28
|
+0.29
0.53% |
$56.12
|
822,041
93.41% of 50 DAV
50 DAV is 880,000
|
$57.65
-4.11%
|
10/6/2017
|
$57.13
|
PP = $54.23
|
|
MB = $56.94
|
Most Recent Note - 10/11/2017 4:52:17 PM
Y - Pulled back today for a 3rd small loss on ever-decreasing volume. Prior highs in the $54 area define near-term support. Technically, volume was +130% above average behind a big breakout gain on 10/06/17, when it was highlighted in yellow in the mid-day report.
>>> FEATURED STOCK ARTICLE : Finished Strong With Above Average Volume Behind Big Gain - 10/6/2017 |
View all notes |
Set NEW NOTE alert |
Company Profile |
SEC
News |
Chart |
Request a new note
C
A
S
I |
Symbol/Exchange
Company Name
Industry Group |
PRICE |
CHANGE
(%Change) |
Day High |
Volume
(% DAV)
(% 50 day avg vol) |
52 Wk Hi
% From Hi |
Featured
Date |
Price
Featured |
Pivot Featured |
|
Max Buy |
OLED
-
NASDAQ
Universal Display Corp
Elec-Misc Products
|
$134.20
|
-0.40
-0.30% |
$135.65
|
722,402
82.84% of 50 DAV
50 DAV is 872,000
|
$145.30
-7.64%
|
8/31/2017
|
$128.22
|
PP = $127.78
|
|
MB = $134.17
|
Most Recent Note - 10/11/2017 5:01:33 PM
Y - Volume totals have been cooling in recent weeks after abruptly pulling back near prior highs. Its 50 DMA line and recent lows define important near-term support to watch in the $123-124 area.
>>> FEATURED STOCK ARTICLE : Consolidating Near Prior Highs Following Recent Breakout - 9/28/2017 |
View all notes |
Set NEW NOTE alert |
Company Profile |
SEC
News |
Chart |
Request a new note
C
A
S
I |
ANET
-
NYSE
Arista Networks Inc
TELECOMMUNICATIONS - Communication Equipment
|
$191.14
|
-0.07
-0.04% |
$192.88
|
619,396
77.42% of 50 DAV
50 DAV is 800,000
|
$196.27
-2.61%
|
8/4/2017
|
$173.31
|
PP = $163.07
|
|
MB = $171.22
|
Most Recent Note - 10/10/2017 5:50:32 PM
G - Quietly hovering near its all-time high, extended from any sound base. Its 50 DMA line and prior highs coincide in the $176 area, defining important near-term support to watch on pullbacks. Fundamentals remain very strong.
>>> FEATURED STOCK ARTICLE : Extended From Any Sound Base After Additional Volume-Driven Gains - 9/19/2017 |
View all notes |
Set NEW NOTE alert |
Company Profile |
SEC
News |
Chart |
Request a new note
C
A
S
I |
GRUB
-
NYSE
Grubhub Inc
COMPUTER SOFTWARE and SERVICES - Technical and System Software
|
$51.61
|
-0.55
-1.05% |
$52.32
|
2,037,817
109.38% of 50 DAV
50 DAV is 1,863,000
|
$57.61
-10.41%
|
6/21/2017
|
$47.33
|
PP = $46.94
|
|
MB = $49.29
|
Most Recent Note - 10/13/2017 12:26:26 PM
G - Early weakness today nearly tested the recent low ($49.60 on 9/22/17) noted as near-term support above prior highs in the $47 area. A rebound above its 50 DMA line ($54.08) is needed for its outlook to improve. Recently reported earnings +13% on +32% sales revenues for the Jun '17 quarter, below the +25% minimum earnings guideline (C criteria) raising fundamental concerns.
>>> FEATURED STOCK ARTICLE : Gain Above 50-Day Moving Average Line Helped Technical Stance - 10/2/2017 |
View all notes |
Set NEW NOTE alert |
Company Profile |
SEC
News |
Chart |
Request a new note
C
A
S
I |
IBP
-
NYSE
Installed Building Prod
DIVERSIFIED SERVICES - Business/Management Services
|
$64.75
|
-0.20
-0.31% |
$65.20
|
95,426
59.64% of 50 DAV
50 DAV is 160,000
|
$67.15
-3.57%
|
9/19/2017
|
$59.15
|
PP = $60.10
|
|
MB = $63.11
|
Most Recent Note - 10/11/2017 4:58:37 PM
G - Volume totals have been cooling while consolidating. It is extended from prior highs in the $60 area that define initial support above its 50 DMA line ($59.13).
>>> FEATURED STOCK ARTICLE : Building - Maintenance & Service Firm Extended From Latest Base - 10/9/2017 |
View all notes |
Set NEW NOTE alert |
Company Profile |
SEC
News |
Chart |
Request a new note
C
A
S
I |
NCOM
-
NASDAQ
National Commerce Corp
BANKING - Regional - Southeast Banks
|
$42.75
|
-0.15
-0.35% |
$42.95
|
16,919
42.30% of 50 DAV
50 DAV is 40,000
|
$43.80
-2.40%
|
4/25/2017
|
$38.95
|
PP = $40.09
|
|
MB = $42.09
|
Most Recent Note - 10/12/2017 5:06:45 PM
G - Still stubbornly holding its ground near its 52-week high following an impressive spurt of volume-driven gains. Recently reported Jun '17 earnings +23% on +45% sales revenues, below the +25% minimum earnings guideline (C criteria), raising fundamental concerns. See the latest FSU analysis for more details and a new annotated graph.
>>> FEATURED STOCK ARTICLE : Holding Ground Following Impressive Volume-Driven Gains - 10/12/2017 |
View all notes |
Set NEW NOTE alert |
Company Profile |
SEC
News |
Chart |
Request a new note
C
A
S
I |
Symbol/Exchange
Company Name
Industry Group |
PRICE |
CHANGE
(%Change) |
Day High |
Volume
(% DAV)
(% 50 day avg vol) |
52 Wk Hi
% From Hi |
Featured
Date |
Price
Featured |
Pivot Featured |
|
Max Buy |
OLLI
-
NASDAQ
Ollie's Bargain Outlet
Retail-DiscountandVariety
|
$45.30
|
+0.10
0.22% |
$45.73
|
221,957
40.28% of 50 DAV
50 DAV is 551,000
|
$46.90
-3.41%
|
9/8/2017
|
$45.20
|
PP = $46.18
|
|
MB = $48.49
|
Most Recent Note - 10/11/2017 4:03:14 PM
Y - Hovering near its all-time high with volume totals cooling. Recent gains above the latest pivot point did not meet the minimum +40% above average volume threshold necessary to trigger a proper new (or add-on) technical buy signal. Confirming volume-driven gains would be a reassuring sign of fresh institutional buying demand. Fundamentals remain strong.
>>> FEATURED STOCK ARTICLE : Quietly Hit New Highs Without Great Volume Conviction - 10/3/2017 |
View all notes |
Set NEW NOTE alert |
Company Profile |
SEC
News |
Chart |
Request a new note
C
A
S
I |
HLI
-
NYSE
Houlihan Lokey Inc Cl A
Finance-Invest Bnk/Bkrs
|
$39.96
|
+0.07
0.18% |
$40.03
|
150,188
69.53% of 50 DAV
50 DAV is 216,000
|
$40.63
-1.65%
|
9/18/2017
|
$37.04
|
PP = $39.78
|
|
MB = $41.77
|
Most Recent Note - 10/11/2017 3:55:42 PM
Y - Quietly consolidating after wedging to new highs with recent gains lacking volume conviction. Gains above the pivot point must be backed by at least +40% above average volume to trigger a proper new (or add-on) technical buy signal. Subsequent losses below the recent low ($34.41 on 8/18/17) would raise more serious concerns and trigger a technical sell signal.
>>> FEATURED STOCK ARTICLE : Rebounding Toward Prior High and New Pivot Point - 9/27/2017 |
View all notes |
Set NEW NOTE alert |
Company Profile |
SEC
News |
Chart |
Request a new note
C
A
S
I |
ICHR
-
NASDAQ
Ichor Holdings Ltd
ELECTRONICS - Semiconductor Equipment
|
$32.67
|
+1.33
4.24% |
$33.06
|
1,145,621
157.58% of 50 DAV
50 DAV is 727,000
|
$31.68
3.13%
|
10/10/2017
|
$29.39
|
PP = $28.36
|
|
MB = $29.78
|
Most Recent Note - 10/13/2017 12:35:23 PM
G - Color code is changed to green while on track for a 7th consecutive gain today, getting very extended from its prior base. Disciplined investors avoid chasing stocks more than +5% above prior highs and always limit losses by selling any stock that falls more than -7% from their purchase price. See the latest FSU analysis for more details and an annotated graph.
>>> FEATURED STOCK ARTICLE : Semiconductor Equipment Firm Finished Strong After Highlighted - 10/10/2017 |
View all notes |
Set NEW NOTE alert |
Company Profile |
SEC
News |
Chart |
Request a new note
C
A
S
I |
|
|
|
THESE ARE NOT BUY RECOMMENDATIONS!
Comments contained in the body of this report are technical
opinions only. The material herein has been obtained
from sources believed to be reliable and accurate, however,
its accuracy and completeness cannot be guaranteed.
This site is not an investment advisor, hence it does
not endorse or recommend any securities or other investments.
Any recommendation contained in this report may not
be suitable for all investors and it is not to be deemed
an offer or solicitation on our part with respect to
the purchase or sale of any securities. All trademarks,
service marks and trade names appearing in this report
are the property of their respective owners, and are
likewise used for identification purposes only.
This report is a service available
only to active Paid Premium Members.
You may opt-out of receiving report notifications
at any time. Questions or comments may be submitted
by writing to Premium Membership Services 665 S.E. 10 Street, Suite 201 Deerfield Beach, FL 33441-5634 or by calling 1-800-965-8307
or 954-785-1121.
|
|
|