***Last / Change / Volume data in this table is the closing quote data***
Symbol/Exchange
Company Name
Industry Group |
PRICE |
CHANGE
(%Change) |
Day High |
Volume
(% DAV)
(% 50 day avg vol) |
52 Wk Hi
% From Hi |
Featured
Date |
Price
Featured |
Pivot Featured |
|
Max Buy |
MPX
-
NYSE
Marine Products Corp
AUTOMOTIVE - Recreational Vehicles
|
$16.13
|
-0.29
-1.77% |
$16.52
|
13,567
38.76% of 50 DAV
50 DAV is 35,000
|
$17.12
-5.78%
|
9/26/2017
|
$16.30
|
PP = $16.35
|
|
MB = $17.17
|
Most Recent Note - 10/5/2017 7:58:03 PM
Y - Found prompt support above its 50 DMA line as it encountered damaging distributional pressure on 9/29/17. Members were cautioned in the note 5:19PM 9/27/17 - "Hit yet another new high with today's 6th consecutive gain, however, volume was only +13% above average, not indicative of heavy institutional buying demand. It was highlighted in yellow with pivot point cited based on its 7/12/17 high plus 10 cents in the 9/26/17 mid-day report. Gains above the pivot point must be backed by at least +40% above average volume to clinch a convincing technical buy signal.
>>> FEATURED STOCK ARTICLE : Powerboat Maker Hit Another New 52-Week High - 9/26/2017 |
View all notes |
Set NEW NOTE alert |
Company Profile |
SEC
News |
Chart |
Request a new note
C
A
S
I |
THO
-
NYSE
Thor Industries Inc
AUTOMOTIVE - Recreational Vehicles
|
$129.20
|
+0.13
0.10% |
$129.88
|
448,128
65.90% of 50 DAV
50 DAV is 680,000
|
$129.71
-0.39%
|
8/14/2017
|
$106.67
|
PP = $110.01
|
|
MB = $115.51
|
 Most Recent Note - 10/9/2017 5:31:21 PM
G - Touched a new 52-week high with light volume behind today's gain, getting more extended from the previously noted base. Prior highs in the $115 area define initial support to watch on pullbacks. Fundamentals remain strong.
>>> FEATURED STOCK ARTICLE : Wedged to New High Then Ended the Session Weak - 9/18/2017 |
View all notes |
Set NEW NOTE alert |
Company Profile |
SEC
News |
Chart |
Request a new note
C
A
S
I |
AVGO
-
NASDAQ
Broadcom Limited
ELECTRONICS - Semiconductor - Broad Line
|
$246.42
|
+0.68
0.28% |
$247.25
|
1,648,188
62.98% of 50 DAV
50 DAV is 2,617,000
|
$259.36
-4.99%
|
8/24/2017
|
$252.44
|
PP = $256.89
|
|
MB = $269.73
|
Most Recent Note - 10/3/2017 8:52:01 PM
G - A rebound above the 50 DMA line ($247.59) is needed for its outlook to improve. More damaging losses below the recent low ($231.53 on 9/25/17) would raise serious concerns and trigger a more worrisome technical sell signal.
>>> FEATURED STOCK ARTICLE : Technical Deterioration Raises Concerns - 9/21/2017 |
View all notes |
Set NEW NOTE alert |
Company Profile |
SEC
News |
Chart |
Request a new note
C
A
S
I |
YY
-
NASDAQ
YY Inc Ads
INTERNET - Internet Service Providers
|
$89.49
|
+0.75
0.85% |
$91.00
|
1,125,361
63.33% of 50 DAV
50 DAV is 1,777,000
|
$94.00
-4.80%
|
9/25/2017
|
$80.26
|
PP = $83.10
|
|
MB = $87.26
|
Most Recent Note - 10/3/2017 11:45:17 AM
G - Hit another new 52-week high today, getting more extended from its prior base. Recent gains above the pivot point triggered a technical buy signal. Prior highs in the $83 area define initial support to watch on pullbacks.
>>> FEATURED STOCK ARTICLE : Encountered Distributional Pressure When Challenging Prior HIgh - 9/25/2017 |
View all notes |
Set NEW NOTE alert |
Company Profile |
SEC
News |
Chart |
Request a new note
C
A
S
I |
STMP
-
NASDAQ
Stamps.com Inc
INTERNET - Internet Software and Services
|
$215.55
|
-0.70
-0.32% |
$217.56
|
222,164
49.70% of 50 DAV
50 DAV is 447,000
|
$220.25
-2.13%
|
9/11/2017
|
$193.65
|
PP = $220.35
|
|
MB = $231.37
|
Most Recent Note - 10/4/2017 6:34:57 PM
Y - Posted a 4th consecutive gain today with light volume, rising near the new pivot point cited based on its 8/07/17 high plus 10 cents. Faces little near-term resistance. Subsequent volume-driven gains above the pivot point are needed to trigger a new (or add-on) technical buy signal. Recent low ($185.80 on 9/05/17) and its 50 DMA line ($197) define important near-term support where violations would trigger technical sell signals. See the latest FSU analysis for more details and a new annotated graph.
>>> FEATURED STOCK ARTICLE : Perched Near Pivot Point With No Resistance Remaining - 10/4/2017 |
View all notes |
Set NEW NOTE alert |
Company Profile |
SEC
News |
Chart |
Request a new note
C
A
S
I |
Symbol/Exchange
Company Name
Industry Group |
PRICE |
CHANGE
(%Change) |
Day High |
Volume
(% DAV)
(% 50 day avg vol) |
52 Wk Hi
% From Hi |
Featured
Date |
Price
Featured |
Pivot Featured |
|
Max Buy |
HTHT
-
NASDAQ
China Lodging Group Ads
LEISURE - Lodging
|
$135.91
|
+7.95
6.21% |
$138.44
|
567,738
158.14% of 50 DAV
50 DAV is 359,000
|
$129.49
4.96%
|
9/29/2016
|
$46.12
|
PP = $47.82
|
|
MB = $50.21
|
Most Recent Note - 10/9/2017 12:00:00 PM
G - Hitting another new all-time high today, very extended from any sound base. Earnings +19% on +18% sales revenues for the Jun '17 quarter were below the +25% minimum earnings guideline (C criteria). Its 50 DMA line ($112) defines near-term support. See the latest FSU analysis for more details and an annotated graph.
>>> FEATURED STOCK ARTICLE : Holding Ground Stubbornly After Considerable Rally - 10/5/2017 |
View all notes |
Set NEW NOTE alert |
Company Profile |
SEC
News |
Chart |
Request a new note
C
A
S
I |
LMAT
-
NASDAQ
Lemaitre Vascular Inc
Medical-Products
|
$37.43
|
-1.03
-2.68% |
$38.41
|
57,908
27.06% of 50 DAV
50 DAV is 214,000
|
$39.29
-4.74%
|
7/28/2017
|
$33.50
|
PP = $33.32
|
|
MB = $34.99
|
Most Recent Note - 10/4/2017 6:30:02 PM
G - Posted a gain today on lighter than average volume. The 50 DMA line ($35.70) defines near-term support to watch above prior highs in the $33 area.
>>> FEATURED STOCK ARTICLE : Quietly Pulling Back From High After More Volume-Driven Gains - 9/22/2017 |
View all notes |
Set NEW NOTE alert |
Company Profile |
SEC
News |
Chart |
Request a new note
C
A
S
I |
ESNT
-
NYSE
Essent Group Ltd
Finance-MrtgandRel Svc
|
$39.46
|
-0.65
-1.62% |
$40.35
|
414,121
524.20% of 50 DAV
50 DAV is 79,000
|
$41.44
-4.78%
|
10/9/2017
|
$39.75
|
PP = $41.54
|
|
MB = $43.62
|
Most Recent Note - 10/9/2017 11:57:01 AM
Y - Perched within striking distance of its all-time high, but pulling back toward its 50 DMA line ($38.93) which recently acted as support. Little resistance remains due to overhead supply. New pivot point is cited based on its 8/07/17 high plus 10 cents. Subsequent volume-driven gains above the pivot point may trigger a new (or add-on) technical buy signal.
>>> FEATURED STOCK ARTICLE : Perched Within Close Striking Distance of Prior High - 9/29/2017 |
View all notes |
Set NEW NOTE alert |
Company Profile |
SEC
News |
Chart |
Request a new note
C
A
S
I |
FIVE
-
NASDAQ
Five Below Inc
Retail-DiscountandVariety
|
$56.39
|
-0.89
-1.55% |
$57.40
|
954,022
108.78% of 50 DAV
50 DAV is 877,000
|
$57.65
-2.19%
|
10/6/2017
|
$57.13
|
PP = $54.23
|
|
MB = $56.94
|
Most Recent Note - 10/6/2017 9:19:40 PM
Y - Finished strong today after highlighter in yellow with new pivot point cited based on its 5/19/17 high plus 10 cents. Found support above its 200 DMA line during its consolidation and rebounded since dropped from the Featured Stocks list on 6/27/17. Quarterly and annual earnings history (C and A criteria) has been strong. Also showing acceleration in sales revenues and earnings in sequential quarterly comparisons through Jul '17. See the latest FSU analysis for more details and a new annotated graph.
>>> FEATURED STOCK ARTICLE : Finished Strong With Above Average Volume Behind Big Gain - 10/6/2017 |
View all notes |
Set NEW NOTE alert |
Company Profile |
SEC
News |
Chart |
Request a new note
C
A
S
I |
OLED
-
NASDAQ
Universal Display Corp
Elec-Misc Products
|
$130.30
|
+2.20
1.72% |
$131.85
|
598,073
68.90% of 50 DAV
50 DAV is 868,000
|
$145.30
-10.32%
|
8/31/2017
|
$128.22
|
PP = $127.78
|
|
MB = $134.17
|
Most Recent Note - 10/5/2017 7:50:53 PM
Y - Quietly holding its ground after pulling back near prior highs in the $127-130 area. Its 50 DMA line ($122.77) and recent lows define important support to watch.
>>> FEATURED STOCK ARTICLE : Consolidating Near Prior Highs Following Recent Breakout - 9/28/2017 |
View all notes |
Set NEW NOTE alert |
Company Profile |
SEC
News |
Chart |
Request a new note
C
A
S
I |
Symbol/Exchange
Company Name
Industry Group |
PRICE |
CHANGE
(%Change) |
Day High |
Volume
(% DAV)
(% 50 day avg vol) |
52 Wk Hi
% From Hi |
Featured
Date |
Price
Featured |
Pivot Featured |
|
Max Buy |
ANET
-
NYSE
Arista Networks Inc
TELECOMMUNICATIONS - Communication Equipment
|
$193.37
|
+0.44
0.23% |
$196.27
|
489,697
58.09% of 50 DAV
50 DAV is 843,000
|
$193.40
-0.02%
|
8/4/2017
|
$173.31
|
PP = $163.07
|
|
MB = $171.22
|
Most Recent Note - 10/3/2017 8:44:52 PM
G - Hovering near its all-time high. extended from any sound base. Its 50 DMA line ($172.60) defines important near-term support to watch. Fundamentals remain very strong.
>>> FEATURED STOCK ARTICLE : Extended From Any Sound Base After Additional Volume-Driven Gains - 9/19/2017 |
View all notes |
Set NEW NOTE alert |
Company Profile |
SEC
News |
Chart |
Request a new note
C
A
S
I |
GRUB
-
NYSE
Grubhub Inc
COMPUTER SOFTWARE and SERVICES - Technical and System Software
|
$51.28
|
-0.01
-0.02% |
$51.76
|
1,101,527
56.52% of 50 DAV
50 DAV is 1,949,000
|
$57.61
-10.99%
|
6/21/2017
|
$47.33
|
PP = $46.94
|
|
MB = $49.29
|
Most Recent Note - 10/5/2017 7:52:56 PM
G - Slumped below its 50 DMA line ($53.51) with today's big loss on higher (near average) volume. More damaging losses below the recent low ($49.60 on 9/22/17) would raise greater concerns and trigger a worrisome technical sell signal. The next near-term support is prior highs in the $47 area. Recently reported earnings +13% on +32% sales revenues for the Jun '17 quarter, below the +25% minimum earnings guideline (C criteria) raising fundamental concerns.
>>> FEATURED STOCK ARTICLE : Gain Above 50-Day Moving Average Line Helped Technical Stance - 10/2/2017 |
View all notes |
Set NEW NOTE alert |
Company Profile |
SEC
News |
Chart |
Request a new note
C
A
S
I |
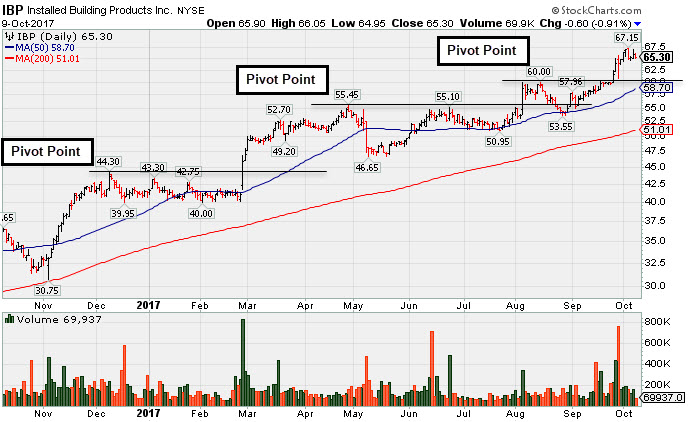
IBP
-
NYSE
Installed Building Prod
DIVERSIFIED SERVICES - Business/Management Services
|
$65.30
|
-0.60
-0.91% |
$66.05
|
69,389
43.10% of 50 DAV
50 DAV is 161,000
|
$67.15
-2.76%
|
9/19/2017
|
$59.15
|
PP = $60.10
|
|
MB = $63.11
|
Most Recent Note - 10/5/2017 7:49:35 PM
G - Color code is changed to green after getting extended from its prior base. Prior highs in the $60 area define initial support above its 50 DMA line ($58.19) after the 9/26/17 gain and technical breakout backed by 71% above average volume.
>>> FEATURED STOCK ARTICLE : Building - Maintenance & Service Firm Extended From Latest Base - 10/9/2017 |
View all notes |
Set NEW NOTE alert |
Company Profile |
SEC
News |
Chart |
Request a new note
C
A
S
I |
NCOM
-
NASDAQ
National Commerce Corp
BANKING - Regional - Southeast Banks
|
$43.00
|
+0.05
0.12% |
$43.10
|
29,823
78.48% of 50 DAV
50 DAV is 38,000
|
$43.80
-1.83%
|
4/25/2017
|
$38.95
|
PP = $40.09
|
|
MB = $42.09
|
Most Recent Note - 10/3/2017 11:41:02 AM
G - Perched at its 52-week high following to an impressive spurt of volume-driven gains. Recently reported Jun '17 earnings +23% on +45% sales revenues, below the +25% minimum earnings guideline (C criteria), raising fundamental concerns.
>>> FEATURED STOCK ARTICLE : Relative Strength Rating Fell Below 80+ Minimum Guideline - 9/14/2017 |
View all notes |
Set NEW NOTE alert |
Company Profile |
SEC
News |
Chart |
Request a new note
C
A
S
I |
OLLI
-
NASDAQ
Ollie's Bargain Outlet
Retail-DiscountandVariety
|
$45.30
|
-0.35
-0.77% |
$45.60
|
312,162
55.54% of 50 DAV
50 DAV is 562,000
|
$46.90
-3.41%
|
9/8/2017
|
$45.20
|
PP = $46.18
|
|
MB = $48.49
|
Most Recent Note - 10/4/2017 6:33:36 PM
Y - Closed at a best-ever high with today's 2nd consecutive gain backed by light volume. Subsequent gains above the latest pivot point with at least the minimum +40% above average volume may trigger a proper new (or add-on) technical buy signal. Fundamentals remain strong.
>>> FEATURED STOCK ARTICLE : Quietly Hit New Highs Without Great Volume Conviction - 10/3/2017 |
View all notes |
Set NEW NOTE alert |
Company Profile |
SEC
News |
Chart |
Request a new note
C
A
S
I |
Symbol/Exchange
Company Name
Industry Group |
PRICE |
CHANGE
(%Change) |
Day High |
Volume
(% DAV)
(% 50 day avg vol) |
52 Wk Hi
% From Hi |
Featured
Date |
Price
Featured |
Pivot Featured |
|
Max Buy |
HLI
-
NYSE
Houlihan Lokey Inc Cl A
Finance-Invest Bnk/Bkrs
|
$39.29
|
-0.12
-0.30% |
$39.69
|
213,967
99.98% of 50 DAV
50 DAV is 214,000
|
$40.63
-3.30%
|
9/18/2017
|
$37.04
|
PP = $39.78
|
|
MB = $41.77
|
Most Recent Note - 10/4/2017 6:28:47 PM
Y - Hit a new high as it posted a 3rd consecutive gain today with below average volume. Gains above the pivot point must be backed by at least +40% above average volume to trigger a proper new (or add-on) technical buy signal. Subsequent losses below the recent low ($34.41 on 8/18/17) would raise more serious concerns and trigger a technical sell signal.
>>> FEATURED STOCK ARTICLE : Rebounding Toward Prior High and New Pivot Point - 9/27/2017 |
View all notes |
Set NEW NOTE alert |
Company Profile |
SEC
News |
Chart |
Request a new note
C
A
S
I |