***Last / Change / Volume data in this table is the closing quote data***
Symbol/Exchange
Company Name
Industry Group |
PRICE |
CHANGE
(%Change) |
Day High |
Volume
(% DAV)
(% 50 day avg vol) |
52 Wk Hi
% From Hi |
Featured
Date |
Price
Featured |
Pivot Featured |
|
Max Buy |
MPX
-
NYSE
Marine Products Corp
AUTOMOTIVE - Recreational Vehicles
|
$15.99
|
-0.11
-0.68% |
$16.14
|
15,707
46.20% of 50 DAV
50 DAV is 34,000
|
$17.12
-6.60%
|
9/26/2017
|
$16.30
|
PP = $16.35
|
|
MB = $17.17
|
 Most Recent Note - 10/11/2017 5:07:28 PM
Y - Volume totals have been cooling. Recent losses negated the breakout attempt and it slumped back into the prior base raising concerns. Confirming volume-driven gains above the pivot point and for new highs would be a very reassuring sign of fresh institutional buying demand,
>>> FEATURED STOCK ARTICLE : Powerboat Maker Hit Another New 52-Week High - 9/26/2017 |
View all notes |
Set NEW NOTE alert |
Company Profile |
SEC
News |
Chart |
Request a new note
C
A
S
I |
THO
-
NYSE
Thor Industries Inc
AUTOMOTIVE - Recreational Vehicles
|
$127.77
|
-0.59
-0.46% |
$129.73
|
545,071
79.92% of 50 DAV
50 DAV is 682,000
|
$129.88
-1.62%
|
8/14/2017
|
$106.67
|
PP = $110.01
|
|
MB = $115.51
|
Most Recent Note - 10/9/2017 5:31:21 PM
G - Touched a new 52-week high with light volume behind today's gain, getting more extended from the previously noted base. Prior highs in the $115 area define initial support to watch on pullbacks. Fundamentals remain strong.
>>> FEATURED STOCK ARTICLE : Wedged to New High Then Ended the Session Weak - 9/18/2017 |
View all notes |
Set NEW NOTE alert |
Company Profile |
SEC
News |
Chart |
Request a new note
C
A
S
I |
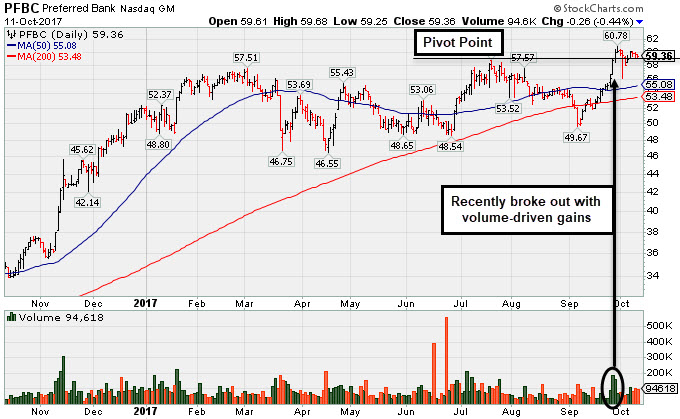
PFBC
-
NASDAQ
Preferred Bank Los Angls
BANKING - Regional - Pacific Banks
|
$59.36
|
-0.26
-0.44% |
$59.68
|
94,618
150.19% of 50 DAV
50 DAV is 63,000
|
$60.99
-2.67%
|
10/10/2017
|
$59.38
|
PP = $59.08
|
|
MB = $62.03
|
Most Recent Note - 10/11/2017 6:04:51 PM
Y - Ended slightly lower with a 3rd consecutive small loss today with above average volume. It was highlighted in yellow with pivot point cited based on its 7/20/17 high plus 10 cents in the 10/10/17 mid-day report. Hit new 52-week highs, triggering a technical buy signal with considerable volume-driven gains on 9/27 and 9/28. Faces no resistance due to overhead supply. Reported earnings +31% on +26% sales revenues for the Jun '17 quarter, its 3rd consecutive quarterly comparison above the +25% minimum guideline (C criteria). See the latest FSU analysis for more details and a new annotated graph.
>>> FEATURED STOCK ARTICLE : Perched Near High Following Volume-Driven Breakout Gains - 10/11/2017 |
View all notes |
Set NEW NOTE alert |
Company Profile |
SEC
News |
Chart |
Request a new note
C
A
S
I |
AVGO
-
NASDAQ
Avago Technologies Ltd
ELECTRONICS - Semiconductor - Broad Line
|
$250.40
|
+4.41
1.79% |
$251.17
|
2,647,308
102.65% of 50 DAV
50 DAV is 2,579,000
|
$259.36
-3.45%
|
8/24/2017
|
$252.44
|
PP = $256.89
|
|
MB = $269.73
|
Most Recent Note - 10/10/2017 5:52:09 PM
G - Met resistance today, meanwhile, a rebound above the 50 DMA line ($246.88) is needed for its outlook to improve. Damaging losses below the recent low ($231.53 on 9/25/17) would raise serious concerns and trigger a more worrisome technical sell signal.
>>> FEATURED STOCK ARTICLE : Technical Deterioration Raises Concerns - 9/21/2017 |
View all notes |
Set NEW NOTE alert |
Company Profile |
SEC
News |
Chart |
Request a new note
C
A
S
I |
YY
-
NASDAQ
YY Inc Ads
INTERNET - Internet Service Providers
|
$90.18
|
+0.91
1.02% |
$90.74
|
943,800
52.46% of 50 DAV
50 DAV is 1,799,000
|
$94.00
-4.06%
|
9/25/2017
|
$80.26
|
PP = $83.10
|
|
MB = $87.26
|
Most Recent Note - 10/10/2017 5:55:07 PM
G - Encountered distributional pressure after getting extended from its prior base. Prior highs in the $83 area define initial support to watch above its 50 DMA line ($78.22).
>>> FEATURED STOCK ARTICLE : Encountered Distributional Pressure When Challenging Prior HIgh - 9/25/2017 |
View all notes |
Set NEW NOTE alert |
Company Profile |
SEC
News |
Chart |
Request a new note
C
A
S
I |
Symbol/Exchange
Company Name
Industry Group |
PRICE |
CHANGE
(%Change) |
Day High |
Volume
(% DAV)
(% 50 day avg vol) |
52 Wk Hi
% From Hi |
Featured
Date |
Price
Featured |
Pivot Featured |
|
Max Buy |
STMP
-
NASDAQ
Stamps.com Inc
INTERNET - Internet Software and Services
|
$217.70
|
+1.65
0.76% |
$222.90
|
442,468
99.43% of 50 DAV
50 DAV is 445,000
|
$220.25
-1.16%
|
9/11/2017
|
$193.65
|
PP = $220.35
|
|
MB = $231.37
|
Most Recent Note - 10/11/2017 4:41:41 PM
Y - Faces no resistance and hit a new 52-week high today but quietly ended the session in the lower half of its intra-day range. The new pivot point cited was based on its 8/07/17 high plus 10 cents. Subsequent volume-driven gains above the pivot point are needed to trigger a new (or add-on) technical buy signal. Recent low ($185.80 on 9/05/17) and its 50 DMA line ($203) define important near-term support where violations would trigger technical sell signals.
>>> FEATURED STOCK ARTICLE : Perched Near Pivot Point With No Resistance Remaining - 10/4/2017 |
View all notes |
Set NEW NOTE alert |
Company Profile |
SEC
News |
Chart |
Request a new note
C
A
S
I |
HTHT
-
NASDAQ
China Lodging Group Ads
LEISURE - Lodging
|
$129.61
|
-1.27
-0.97% |
$133.35
|
304,182
83.11% of 50 DAV
50 DAV is 366,000
|
$138.44
-6.38%
|
9/29/2016
|
$46.12
|
PP = $47.82
|
|
MB = $50.21
|
Most Recent Note - 10/10/2017 12:11:46 PM
G - Retreating today from a record high hit on the prior session. Very extended from any sound base. Earnings +19% on +18% sales revenues for the Jun '17 quarter were below the +25% minimum earnings guideline (C criteria). Its 50 DMA line ($113) defines near-term support.
>>> FEATURED STOCK ARTICLE : Holding Ground Stubbornly After Considerable Rally - 10/5/2017 |
View all notes |
Set NEW NOTE alert |
Company Profile |
SEC
News |
Chart |
Request a new note
C
A
S
I |
LMAT
-
NASDAQ
Lemaitre Vascular Inc
Medical-Products
|
$37.43
|
+0.02
0.05% |
$37.58
|
70,603
36.96% of 50 DAV
50 DAV is 191,000
|
$39.29
-4.74%
|
7/28/2017
|
$33.50
|
PP = $33.32
|
|
MB = $34.99
|
Most Recent Note - 10/11/2017 3:59:48 PM
G - Extended from any sound base, and volume totals have been cooling while consolidating. Near-term support at its 50 DMA line coincides with prior highs in the $36 area.
>>> FEATURED STOCK ARTICLE : Quietly Pulling Back From High After More Volume-Driven Gains - 9/22/2017 |
View all notes |
Set NEW NOTE alert |
Company Profile |
SEC
News |
Chart |
Request a new note
C
A
S
I |
ESNT
-
NYSE
Essent Group Ltd
Finance-MrtgandRel Svc
|
$40.27
|
+0.57
1.44% |
$40.67
|
639,451
82.83% of 50 DAV
50 DAV is 772,000
|
$41.44
-2.82%
|
10/9/2017
|
$39.75
|
PP = $41.54
|
|
MB = $43.62
|
Most Recent Note - 10/9/2017 11:57:01 AM
Y - Perched within striking distance of its all-time high, but pulling back toward its 50 DMA line ($38.93) which recently acted as support. Little resistance remains due to overhead supply. New pivot point is cited based on its 8/07/17 high plus 10 cents. Subsequent volume-driven gains above the pivot point may trigger a new (or add-on) technical buy signal.
>>> FEATURED STOCK ARTICLE : Perched Within Close Striking Distance of Prior High - 9/29/2017 |
View all notes |
Set NEW NOTE alert |
Company Profile |
SEC
News |
Chart |
Request a new note
C
A
S
I |
FIVE
-
NASDAQ
Five Below Inc
Retail-DiscountandVariety
|
$55.98
|
-0.21
-0.37% |
$56.66
|
577,334
65.24% of 50 DAV
50 DAV is 885,000
|
$57.65
-2.90%
|
10/6/2017
|
$57.13
|
PP = $54.23
|
|
MB = $56.94
|
Most Recent Note - 10/11/2017 4:52:17 PM
Y - Pulled back today for a 3rd small loss on ever-decreasing volume. Prior highs in the $54 area define near-term support. Technically, volume was +130% above average behind a big breakout gain on 10/06/17, when it was highlighted in yellow in the mid-day report.
>>> FEATURED STOCK ARTICLE : Finished Strong With Above Average Volume Behind Big Gain - 10/6/2017 |
View all notes |
Set NEW NOTE alert |
Company Profile |
SEC
News |
Chart |
Request a new note
C
A
S
I |
Symbol/Exchange
Company Name
Industry Group |
PRICE |
CHANGE
(%Change) |
Day High |
Volume
(% DAV)
(% 50 day avg vol) |
52 Wk Hi
% From Hi |
Featured
Date |
Price
Featured |
Pivot Featured |
|
Max Buy |
OLED
-
NASDAQ
Universal Display Corp
Elec-Misc Products
|
$130.20
|
+1.75
1.36% |
$130.65
|
472,844
54.29% of 50 DAV
50 DAV is 871,000
|
$145.30
-10.39%
|
8/31/2017
|
$128.22
|
PP = $127.78
|
|
MB = $134.17
|
Most Recent Note - 10/11/2017 5:01:33 PM
Y - Volume totals have been cooling in recent weeks after abruptly pulling back near prior highs. Its 50 DMA line and recent lows define important near-term support to watch in the $123-124 area.
>>> FEATURED STOCK ARTICLE : Consolidating Near Prior Highs Following Recent Breakout - 9/28/2017 |
View all notes |
Set NEW NOTE alert |
Company Profile |
SEC
News |
Chart |
Request a new note
C
A
S
I |
ANET
-
NYSE
Arista Networks Inc
TELECOMMUNICATIONS - Communication Equipment
|
$192.95
|
+0.13
0.07% |
$193.52
|
333,987
40.68% of 50 DAV
50 DAV is 821,000
|
$196.27
-1.69%
|
8/4/2017
|
$173.31
|
PP = $163.07
|
|
MB = $171.22
|
Most Recent Note - 10/10/2017 5:50:32 PM
G - Quietly hovering near its all-time high, extended from any sound base. Its 50 DMA line and prior highs coincide in the $176 area, defining important near-term support to watch on pullbacks. Fundamentals remain very strong.
>>> FEATURED STOCK ARTICLE : Extended From Any Sound Base After Additional Volume-Driven Gains - 9/19/2017 |
View all notes |
Set NEW NOTE alert |
Company Profile |
SEC
News |
Chart |
Request a new note
C
A
S
I |
GRUB
-
NYSE
Grubhub Inc
COMPUTER SOFTWARE and SERVICES - Technical and System Software
|
$51.98
|
-0.21
-0.40% |
$52.51
|
547,077
28.38% of 50 DAV
50 DAV is 1,928,000
|
$57.61
-9.77%
|
6/21/2017
|
$47.33
|
PP = $46.94
|
|
MB = $49.29
|
Most Recent Note - 10/11/2017 4:55:13 PM
G - Still sputtering below its 50 DMA line ($53.90), and the longer it lingers below that short-term average the worse its outlook gets. The recent low ($49.60 on 9/22/17) defines near-term support above prior highs in the $47 area. Recently reported earnings +13% on +32% sales revenues for the Jun '17 quarter, below the +25% minimum earnings guideline (C criteria) raising fundamental concerns.
>>> FEATURED STOCK ARTICLE : Gain Above 50-Day Moving Average Line Helped Technical Stance - 10/2/2017 |
View all notes |
Set NEW NOTE alert |
Company Profile |
SEC
News |
Chart |
Request a new note
C
A
S
I |
IBP
-
NYSE
Installed Building Prod
DIVERSIFIED SERVICES - Business/Management Services
|
$65.20
|
+0.20
0.31% |
$65.95
|
126,993
79.37% of 50 DAV
50 DAV is 160,000
|
$67.15
-2.90%
|
9/19/2017
|
$59.15
|
PP = $60.10
|
|
MB = $63.11
|
Most Recent Note - 10/11/2017 4:58:37 PM
G - Volume totals have been cooling while consolidating. It is extended from prior highs in the $60 area that define initial support above its 50 DMA line ($59.13).
>>> FEATURED STOCK ARTICLE : Building - Maintenance & Service Firm Extended From Latest Base - 10/9/2017 |
View all notes |
Set NEW NOTE alert |
Company Profile |
SEC
News |
Chart |
Request a new note
C
A
S
I |
NCOM
-
NASDAQ
National Commerce Corp
BANKING - Regional - Southeast Banks
|
$43.15
|
-0.20
-0.46% |
$43.30
|
41,949
107.56% of 50 DAV
50 DAV is 39,000
|
$43.80
-1.48%
|
4/25/2017
|
$38.95
|
PP = $40.09
|
|
MB = $42.09
|
Most Recent Note - 10/10/2017 5:53:12 PM
G - Stubbornly holding its ground at its 52-week high following to an impressive spurt of volume-driven gains. Recently reported Jun '17 earnings +23% on +45% sales revenues, below the +25% minimum earnings guideline (C criteria), raising fundamental concerns.
>>> FEATURED STOCK ARTICLE : Relative Strength Rating Fell Below 80+ Minimum Guideline - 9/14/2017 |
View all notes |
Set NEW NOTE alert |
Company Profile |
SEC
News |
Chart |
Request a new note
C
A
S
I |
Symbol/Exchange
Company Name
Industry Group |
PRICE |
CHANGE
(%Change) |
Day High |
Volume
(% DAV)
(% 50 day avg vol) |
52 Wk Hi
% From Hi |
Featured
Date |
Price
Featured |
Pivot Featured |
|
Max Buy |
OLLI
-
NASDAQ
Ollie's Bargain Outlet
Retail-DiscountandVariety
|
$45.45
|
+0.20
0.44% |
$45.80
|
267,325
47.99% of 50 DAV
50 DAV is 557,000
|
$46.90
-3.09%
|
9/8/2017
|
$45.20
|
PP = $46.18
|
|
MB = $48.49
|
Most Recent Note - 10/11/2017 4:03:14 PM
Y - Hovering near its all-time high with volume totals cooling. Recent gains above the latest pivot point did not meet the minimum +40% above average volume threshold necessary to trigger a proper new (or add-on) technical buy signal. Confirming volume-driven gains would be a reassuring sign of fresh institutional buying demand. Fundamentals remain strong.
>>> FEATURED STOCK ARTICLE : Quietly Hit New Highs Without Great Volume Conviction - 10/3/2017 |
View all notes |
Set NEW NOTE alert |
Company Profile |
SEC
News |
Chart |
Request a new note
C
A
S
I |
HLI
-
NYSE
Houlihan Lokey Inc Cl A
Finance-Invest Bnk/Bkrs
|
$39.42
|
+0.17
0.43% |
$39.90
|
174,636
81.61% of 50 DAV
50 DAV is 214,000
|
$40.63
-2.98%
|
9/18/2017
|
$37.04
|
PP = $39.78
|
|
MB = $41.77
|
Most Recent Note - 10/11/2017 3:55:42 PM
Y - Quietly consolidating after wedging to new highs with recent gains lacking volume conviction. Gains above the pivot point must be backed by at least +40% above average volume to trigger a proper new (or add-on) technical buy signal. Subsequent losses below the recent low ($34.41 on 8/18/17) would raise more serious concerns and trigger a technical sell signal.
>>> FEATURED STOCK ARTICLE : Rebounding Toward Prior High and New Pivot Point - 9/27/2017 |
View all notes |
Set NEW NOTE alert |
Company Profile |
SEC
News |
Chart |
Request a new note
C
A
S
I |
ICHR
-
NASDAQ
Ichor Holdings Ltd
ELECTRONICS - Semiconductor Equipment
|
$30.20
|
+0.15
0.50% |
$31.68
|
1,505,657
203.19% of 50 DAV
50 DAV is 741,000
|
$30.34
-0.46%
|
10/10/2017
|
$29.39
|
PP = $28.36
|
|
MB = $29.78
|
Most Recent Note - 10/11/2017 12:18:35 PM
Y - Hit a new high today but reversed into the red. Finished strong on the prior session after highlighted in yellow with pivot point cited based on its 10/02/17 high. It rallied from a cup-with-handle base. Reported great increases for the past 4 quarterly comparisons through Jun '17, helping it better match the fact-based investment system's fundamental guidelines. Limited history is a concern and it is up considerably from its $9 IPO on 12/09/16. See the latest FSU analysis for more details and an annotated graph.
>>> FEATURED STOCK ARTICLE : Semiconductor Equipment Firm Finished Strong After Highlighted - 10/10/2017 |
View all notes |
Set NEW NOTE alert |
Company Profile |
SEC
News |
Chart |
Request a new note
C
A
S
I |