You are not logged in.
This means you
CAN ONLY VIEW reports that were published prior to Wednesday, April 16, 2025.
You
MUST UPGRADE YOUR MEMBERSHIP if you want to see any current reports.
AFTER MARKET UPDATE - MONDAY, OCTOBER 16TH, 2017
Previous After Market Report Next After Market Report >>>
|
|
|
|
DOW |
+85.24 |
22,956.96 |
+0.37% |
|
Volume |
695,042,870 |
-10% |
|
Volume |
1,624,507,382 |
-8% |
|
NASDAQ |
+18.20 |
6,624.00 |
+0.28% |
|
Advancers |
1,451 |
50% |
|
Advancers |
1,324 |
47% |
|
S&P 500 |
+4.47 |
2,557.64 |
+0.18% |
|
Decliners |
1,462 |
50% |
|
Decliners |
1,484 |
53% |
|
Russell 2000 |
+0.02 |
1,502.68 |
+0.00% |
|
52 Wk Highs |
198 |
|
|
52 Wk Highs |
202 |
|
|
S&P 600 |
-0.23 |
908.14 |
-0.03% |
|
52 Wk Lows |
26 |
|
|
52 Wk Lows |
42 |
|
|
 |
Major Indices Posted Gains With Less Volume and Less Leadership
Kenneth J. Gruneisen - Passed the CAN SLIM® Master's Exam
Stocks finished higher Monday. The Dow was up 85 points to 22957. The S&P 500 added 4 points to 2557. The Nasdaq Composite gained 18 points to 6624. Volume totals reported were lighter than the prior session totals on the NYSE and on the Nasdaq exchange. Decliners narrowly outnumbered advancers on the NYSE and on the Nasdaq exchange. There were 86 high-ranked companies from the Leaders List that made new 52-week highs and were listed on the BreakOuts Page, versus the total of 102 on the prior session. New 52-week highs totals contracted yet solidly outnumbered new 52-week lows totals on the Nasdaq exchange and on the NYSE. The Featured Stocks Page provides the latest analysis on noteworthy high-ranked leaders. Charts used courtesy of www.stockcharts.com
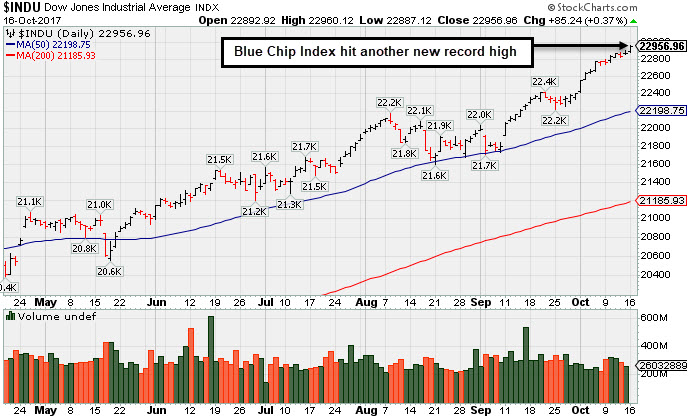 PICTURED: The Dow Jones Industrial Average hit another new record high.
The major averages' (M criteria) are in a confirmed uptrend. Leadership has remained healthy. Investors should buy stocks meeting all key criteria of the fact-based investment system on a case-by-case basis as they trigger technical buy signals.
The major averages continued their rise as investors digested several corporate earnings releases and tax reform updates. In a speech on Monday, President Trump and Senate leader Mitch McConnell reiterated their expectations that a tax reform bill would be passed before the end of 2017. On the data front, a report showed the pace of manufacturing activity in the Fed’s New York district unexpectedly rose in October.
Seven of 11 S&P 500 sectors were higher with Financials a notable outperformer. Shares of JP Morgan (JPM +2.07%) and Bank of America (BAC +1.59%) rose on positive analyst commentary surrounding both banks. Healthcare underperformed on Monday, with Allergan (AGN -3.46%) falling on reports the company lost a patent lawsuit. In earnings news, Charles Schwab (SCHW -0.58%) fell after a mixed earnings report. Netflix (NFLX +1.60%) rose ahead of its earnings announcement following today’s close.
Treasuries finished the session lower with the yield on the benchmark 10-year note up two basis points to 2.30%. In commodities, NYMEX WTI crude advanced 0.7% to $51.87/barrel, near a six month high. COMEX gold was down 0.7% to $1295.10/ounce amid a stronger dollar. |
 Kenneth J. Gruneisen started out as a licensed stockbroker in August 1987, a couple of months prior to the historic stock market crash that took the Dow Jones Industrial Average down -22.6% in a single day. He has published daily fact-based fundamental and technical analysis on high-ranked stocks online for two decades. Through FACTBASEDINVESTING.COM, Kenneth provides educational articles, news, market commentary, and other information regarding proven investment systems that work in good times and bad.
Comments contained in the body of this report are technical opinions only and are not necessarily those of Gruneisen Growth Corp. The material herein has been obtained from sources believed to be reliable and accurate, however, its accuracy and completeness cannot be guaranteed. Our firm, employees, and customers may effect transactions, including transactions contrary to any recommendation herein, or have positions in the securities mentioned herein or options with respect thereto. Any recommendation contained in this report may not be suitable for all investors and it is not to be deemed an offer or solicitation on our part with respect to the purchase or sale of any securities. |
|
 |
Financial, Semiconductor, and Biotech Indexes Rose
Kenneth J. Gruneisen - Passed the CAN SLIM® Master's Exam
On Monday the Bank Index ($BKX +0.64%) and the Broker/Dealer Index ($XBD +0.31%) both edged higher, meanwhile the Retail Index ($RLX -0.01%) finished flat. The tech sector was mixed, with modest gains from the Semiconductor Index ($SOX +0.47%) and the Biotechnology Index ($BTK +0.27%), meanwhile the Networking Index ($NWX -0.89%) ended the session solidly in the red. The Gold & Silver Index ($XAU -1.31%) fell while the Integrated Oil Index ($XOI +0.16%) and the Oil Services Index ($OSX +0.16%) each eked out a tiny gain. Charts courtesy www.stockcharts.com
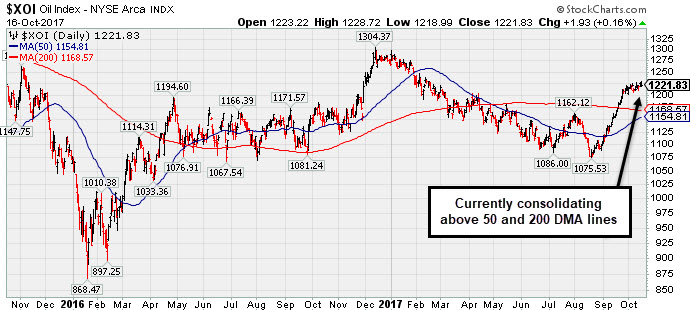 PICTURED: The Integrated Oil Index ($XOI +0.16%) is currently consolidating above its 50-day and 200-day moving average (DMA) lines.
| Oil Services |
$OSX |
138.32 |
+0.23 |
+0.17% |
-24.74% |
| Integrated Oil |
$XOI |
1,221.83 |
+1.93 |
+0.16% |
-3.64% |
| Semiconductor |
$SOX |
1,224.99 |
+5.78 |
+0.47% |
+35.14% |
| Networking |
$NWX |
462.70 |
-4.14 |
-0.89% |
+3.72% |
| Broker/Dealer |
$XBD |
247.20 |
+0.76 |
+0.31% |
+20.42% |
| Retail |
$RLX |
1,559.38 |
-0.17 |
-0.01% |
+16.11% |
| Gold & Silver |
$XAU |
86.14 |
-1.15 |
-1.32% |
+9.23% |
| Bank |
$BKX |
99.52 |
+0.64 |
+0.65% |
+8.42% |
| Biotech |
$BTK |
4,272.94 |
+11.40 |
+0.27% |
+38.96% |
|
|
|
 |
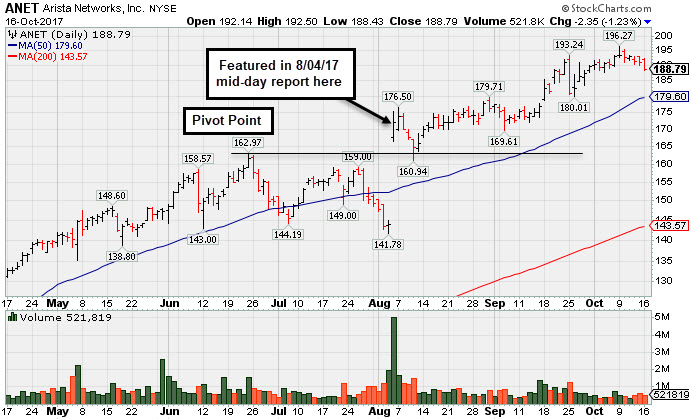
Perched Near All-Time High, Extended From Any Sound Base
Kenneth J. Gruneisen - Passed the CAN SLIM® Master's Exam
Arista Networks Inc (ANET -$2.35 or -1.23% to $188.79) pulled back today for a 3rd consecutive small loss on light volume. It is still perched near its all-time high, extended from any sound base. Its 50-day moving average (DMA) line ($179.60) and prior highs in the $176 area define important near-term support to watch on pullbacks. Fundamentals remain very strong.
It was last shown in this FSU section on 9/19/17 with an annotated graph under the headline, "Extended From Any Sound Base After Additional Volume-Driven Gains". Strength had returned and it gapped up for new highs on 8/04/17 after it reported Jun '17 earnings rose +81% on +51% sales revenues versus the year ago period. ANET has shown strong and steady increases in quarterly sales revenues while earnings have routinely been well above the +25% minimum guideline (C criteria). Its annual earnings (A criteria) growth has been strong, however, its history is limited since its $43 IPO in June of 2014.
ANET traded up as much as +109.2% since first highlighted at $93.80 in yellow with pivot point cited based on its 2015 high plus 10 cents in the 11/21/16 mid-day report (read here).
The number of top-rated funds owning its shares rose from 360 in Dec '15 to 630 Sep '17, a reassuring sign concerning the I criteria. The high-ranked Computer - Networking firm has a Timeliness Rating of A and a Sponsorship Rating of B. Its small supply of 45 million shares (S criteria) in the public float may contribute to greater volatility in the event of institutional buying or selling.
|
|
|
Color Codes Explained :
Y - Better candidates highlighted by our
staff of experts.
G - Previously featured
in past reports as yellow but may no longer be buyable under the
guidelines.
***Last / Change / Volume data in this table is the closing quote data***
Symbol/Exchange
Company Name
Industry Group |
PRICE |
CHANGE
(%Change) |
Day High |
Volume
(% DAV)
(% 50 day avg vol) |
52 Wk Hi
% From Hi |
Featured
Date |
Price
Featured |
Pivot Featured |
|
Max Buy |
MPX
-
NYSE
Marine Products Corp
AUTOMOTIVE - Recreational Vehicles
|
$14.71
|
-0.75
-4.85% |
$15.45
|
45,752
142.98% of 50 DAV
50 DAV is 32,000
|
$17.12
-14.08%
|
9/26/2017
|
$16.30
|
PP = $16.35
|
|
MB = $17.17
|
 Most Recent Note - 10/16/2017 1:46:35 PM
G - Violated its 50 DMA line ($15.37) with higher volume behind today's 6th consecutive loss triggering a technical sell signal and its color code is changed to green. Only a prompt rebound above the 50 DMA would help its outlook improve. Noted with caution in prior reports - "Recent losses negated the breakout attempt and it slumped back into the prior base raising concerns. Confirming volume-driven gains above the pivot point and for new highs would be a very reassuring sign of fresh institutional buying demand,"
>>> FEATURED STOCK ARTICLE : Powerboat Maker Hit Another New 52-Week High - 9/26/2017 |
View all notes |
Set NEW NOTE alert |
Company Profile |
SEC
News |
Chart |
Request a new note
C
A
S
I |
THO
-
NYSE
Thor Industries Inc
AUTOMOTIVE - Recreational Vehicles
|
$130.52
|
+1.35
1.05% |
$131.24
|
602,984
88.41% of 50 DAV
50 DAV is 682,000
|
$129.88
0.49%
|
8/14/2017
|
$106.67
|
PP = $110.01
|
|
MB = $115.51
|
Most Recent Note - 10/13/2017 5:52:39 PM
G - Perched at its all-time high after 8 consecutive weekly gains, very extended from the previously noted base. Prior highs in the $115 area define initial support to watch on pullbacks. Fundamentals remain strong. See the latest FSU analysis for more details and a new annotated graph.
>>> FEATURED STOCK ARTICLE : Extended From Prior Base With Volume Totals Cooling - 10/13/2017 |
View all notes |
Set NEW NOTE alert |
Company Profile |
SEC
News |
Chart |
Request a new note
C
A
S
I |
PFBC
-
NASDAQ
Preferred Bank Los Angls
BANKING - Regional - Pacific Banks
|
$58.84
|
+0.22
0.38% |
$59.53
|
36,808
56.63% of 50 DAV
50 DAV is 65,000
|
$60.99
-3.53%
|
10/10/2017
|
$59.38
|
PP = $59.08
|
|
MB = $62.03
|
Most Recent Note - 10/11/2017 6:04:51 PM
Y - Ended slightly lower with a 3rd consecutive small loss today with above average volume. It was highlighted in yellow with pivot point cited based on its 7/20/17 high plus 10 cents in the 10/10/17 mid-day report. Hit new 52-week highs, triggering a technical buy signal with considerable volume-driven gains on 9/27 and 9/28. Faces no resistance due to overhead supply. Reported earnings +31% on +26% sales revenues for the Jun '17 quarter, its 3rd consecutive quarterly comparison above the +25% minimum guideline (C criteria). See the latest FSU analysis for more details and a new annotated graph.
>>> FEATURED STOCK ARTICLE : Perched Near High Following Volume-Driven Breakout Gains - 10/11/2017 |
View all notes |
Set NEW NOTE alert |
Company Profile |
SEC
News |
Chart |
Request a new note
C
A
S
I |
AVGO
-
NASDAQ
Broadcom Limited
ELECTRONICS - Semiconductor - Broad Line
|
$246.67
|
-1.29
-0.52% |
$249.47
|
1,487,654
58.41% of 50 DAV
50 DAV is 2,547,000
|
$259.36
-4.89%
|
8/24/2017
|
$252.44
|
PP = $256.89
|
|
MB = $269.73
|
Most Recent Note - 10/16/2017 4:12:36 PM
G - Still sputtering near its 50 DMA line ($246.73). Damaging losses below the recent low ($231.53 on 9/25/17) would raise serious concerns and trigger a more worrisome technical sell signal.
>>> FEATURED STOCK ARTICLE : Technical Deterioration Raises Concerns - 9/21/2017 |
View all notes |
Set NEW NOTE alert |
Company Profile |
SEC
News |
Chart |
Request a new note
C
A
S
I |
YY
-
NASDAQ
YY Inc Ads
INTERNET - Internet Service Providers
|
$97.32
|
+4.10
4.40% |
$97.59
|
1,528,215
84.39% of 50 DAV
50 DAV is 1,811,000
|
$94.00
3.53%
|
9/25/2017
|
$80.26
|
PP = $83.10
|
|
MB = $87.26
|
Most Recent Note - 10/16/2017 4:06:03 PM
G - Ended near the session high at a best-ever close with today's 4th consecutive gain backed by below average volume, getting more extended from its prior base. Prior highs in the $83 area define initial support to watch above its 50 DMA line ($79.86).
>>> FEATURED STOCK ARTICLE : Encountered Distributional Pressure When Challenging Prior HIgh - 9/25/2017 |
View all notes |
Set NEW NOTE alert |
Company Profile |
SEC
News |
Chart |
Request a new note
C
A
S
I |
Symbol/Exchange
Company Name
Industry Group |
PRICE |
CHANGE
(%Change) |
Day High |
Volume
(% DAV)
(% 50 day avg vol) |
52 Wk Hi
% From Hi |
Featured
Date |
Price
Featured |
Pivot Featured |
|
Max Buy |
STMP
-
NASDAQ
Stamps.com Inc
INTERNET - Internet Software and Services
|
$216.95
|
-1.40
-0.64% |
$220.05
|
263,352
71.37% of 50 DAV
50 DAV is 369,000
|
$224.64
-3.42%
|
9/11/2017
|
$193.65
|
PP = $220.35
|
|
MB = $231.37
|
Most Recent Note - 10/13/2017 6:07:32 PM
Y - Faces no resistance, however it has stalled near its pivot point based on its 8/07/17 high plus 10 cents. Subsequent volume-driven gains above the pivot point are needed to trigger a proper new (or add-on) technical buy signal. Its 50 DMA line ($205) defines important near-term support above the recent low ($195.05 on 9/28/17) where violations would trigger technical sell signals.
>>> FEATURED STOCK ARTICLE : Perched Near Pivot Point With No Resistance Remaining - 10/4/2017 |
View all notes |
Set NEW NOTE alert |
Company Profile |
SEC
News |
Chart |
Request a new note
C
A
S
I |
HTHT
-
NASDAQ
China Lodging Group Ads
LEISURE - Lodging
|
$134.91
|
+7.53
5.91% |
$135.63
|
562,910
150.51% of 50 DAV
50 DAV is 374,000
|
$138.44
-2.55%
|
9/29/2016
|
$46.12
|
PP = $47.82
|
|
MB = $50.21
|
Most Recent Note - 10/16/2017 4:04:24 PM
G - Rallying today near its record high hit on 10/09/17, very extended from any sound base. Earnings +19% on +18% sales revenues for the Jun '17 quarter were below the +25% minimum earnings guideline (C criteria). Its 50 DMA line ($115.41) defines near-term support.
>>> FEATURED STOCK ARTICLE : Holding Ground Stubbornly After Considerable Rally - 10/5/2017 |
View all notes |
Set NEW NOTE alert |
Company Profile |
SEC
News |
Chart |
Request a new note
C
A
S
I |
LMAT
-
NASDAQ
Lemaitre Vascular Inc
Medical-Products
|
$37.08
|
-0.03
-0.08% |
$37.48
|
67,372
37.22% of 50 DAV
50 DAV is 181,000
|
$39.29
-5.63%
|
7/28/2017
|
$33.50
|
PP = $33.32
|
|
MB = $34.99
|
Most Recent Note - 10/11/2017 3:59:48 PM
G - Extended from any sound base, and volume totals have been cooling while consolidating. Near-term support at its 50 DMA line coincides with prior highs in the $36 area.
>>> FEATURED STOCK ARTICLE : Quietly Pulling Back From High After More Volume-Driven Gains - 9/22/2017 |
View all notes |
Set NEW NOTE alert |
Company Profile |
SEC
News |
Chart |
Request a new note
C
A
S
I |
ESNT
-
NYSE
Essent Group Ltd
Finance-MrtgandRel Svc
|
$42.51
|
+0.91
2.19% |
$42.64
|
1,542,554
195.26% of 50 DAV
50 DAV is 790,000
|
$41.72
1.91%
|
10/9/2017
|
$39.75
|
PP = $41.54
|
|
MB = $43.62
|
Most Recent Note - 10/16/2017 11:53:53 AM
Y - Hitting new all-time highs with today's 5th consecutive gain on ever-increasing volume. Prior session's volume total was only +22% above average. Members were reminded - "Gains above the pivot point must have at least +40% above average volume to trigger a proper technical buy signal under the fact-based investment system's rules."
>>> FEATURED STOCK ARTICLE : Perched Within Close Striking Distance of Prior High - 9/29/2017 |
View all notes |
Set NEW NOTE alert |
Company Profile |
SEC
News |
Chart |
Request a new note
C
A
S
I |
FIVE
-
NASDAQ
Five Below Inc
Retail-DiscountandVariety
|
$55.30
|
+0.02
0.04% |
$55.90
|
743,373
83.90% of 50 DAV
50 DAV is 886,000
|
$57.65
-4.08%
|
10/6/2017
|
$57.13
|
PP = $54.23
|
|
MB = $56.94
|
Most Recent Note - 10/11/2017 4:52:17 PM
Y - Pulled back today for a 3rd small loss on ever-decreasing volume. Prior highs in the $54 area define near-term support. Technically, volume was +130% above average behind a big breakout gain on 10/06/17, when it was highlighted in yellow in the mid-day report.
>>> FEATURED STOCK ARTICLE : Finished Strong With Above Average Volume Behind Big Gain - 10/6/2017 |
View all notes |
Set NEW NOTE alert |
Company Profile |
SEC
News |
Chart |
Request a new note
C
A
S
I |
Symbol/Exchange
Company Name
Industry Group |
PRICE |
CHANGE
(%Change) |
Day High |
Volume
(% DAV)
(% 50 day avg vol) |
52 Wk Hi
% From Hi |
Featured
Date |
Price
Featured |
Pivot Featured |
|
Max Buy |
OLED
-
NASDAQ
Universal Display Corp
Elec-Misc Products
|
$135.50
|
+1.30
0.97% |
$136.10
|
639,606
74.29% of 50 DAV
50 DAV is 861,000
|
$145.30
-6.74%
|
8/31/2017
|
$128.22
|
PP = $127.78
|
|
MB = $134.17
|
Most Recent Note - 10/16/2017 4:27:41 PM
G - Color code is changed to green after a gain with light volume lifted it above its "max buy" level. Its 50 DMA line and recent lows define important near-term support to watch in the $123-124 area.
>>> FEATURED STOCK ARTICLE : Consolidating Near Prior Highs Following Recent Breakout - 9/28/2017 |
View all notes |
Set NEW NOTE alert |
Company Profile |
SEC
News |
Chart |
Request a new note
C
A
S
I |
ANET
-
NYSE
Arista Networks Inc
TELECOMMUNICATIONS - Communication Equipment
|
$188.79
|
-2.35
-1.23% |
$192.50
|
521,359
66.50% of 50 DAV
50 DAV is 784,000
|
$196.27
-3.81%
|
8/4/2017
|
$173.31
|
PP = $163.07
|
|
MB = $171.22
|
Most Recent Note - 10/16/2017 4:11:16 PM
G - Pulled back today for a 3rd consecutive small loss on light volume. Still perched near its all-time high, extended from any sound base. Its 50 DMA line ($179.60) and prior highs in the $176 area define important near-term support to watch on pullbacks. Fundamentals remain very strong.
>>> FEATURED STOCK ARTICLE : Perched Near All-Time High, Extended From Any Sound Base - 10/16/2017 |
View all notes |
Set NEW NOTE alert |
Company Profile |
SEC
News |
Chart |
Request a new note
C
A
S
I |
GRUB
-
NYSE
Grubhub Inc
COMPUTER SOFTWARE and SERVICES - Technical and System Software
|
$51.14
|
-0.47
-0.91% |
$51.88
|
1,229,447
67.33% of 50 DAV
50 DAV is 1,826,000
|
$57.61
-11.23%
|
6/21/2017
|
$47.33
|
PP = $46.94
|
|
MB = $49.29
|
Most Recent Note - 10/13/2017 12:26:26 PM
G - Early weakness today nearly tested the recent low ($49.60 on 9/22/17) noted as near-term support above prior highs in the $47 area. A rebound above its 50 DMA line ($54.08) is needed for its outlook to improve. Recently reported earnings +13% on +32% sales revenues for the Jun '17 quarter, below the +25% minimum earnings guideline (C criteria) raising fundamental concerns.
>>> FEATURED STOCK ARTICLE : Gain Above 50-Day Moving Average Line Helped Technical Stance - 10/2/2017 |
View all notes |
Set NEW NOTE alert |
Company Profile |
SEC
News |
Chart |
Request a new note
C
A
S
I |
IBP
-
NYSE
Installed Building Prod
DIVERSIFIED SERVICES - Business/Management Services
|
$65.20
|
+0.45
0.69% |
$65.65
|
78,329
48.96% of 50 DAV
50 DAV is 160,000
|
$67.15
-2.90%
|
9/19/2017
|
$59.15
|
PP = $60.10
|
|
MB = $63.11
|
Most Recent Note - 10/11/2017 4:58:37 PM
G - Volume totals have been cooling while consolidating. It is extended from prior highs in the $60 area that define initial support above its 50 DMA line ($59.13).
>>> FEATURED STOCK ARTICLE : Building - Maintenance & Service Firm Extended From Latest Base - 10/9/2017 |
View all notes |
Set NEW NOTE alert |
Company Profile |
SEC
News |
Chart |
Request a new note
C
A
S
I |
NCOM
-
NASDAQ
National Commerce Corp
BANKING - Regional - Southeast Banks
|
$42.80
|
+0.05
0.12% |
$43.15
|
32,674
81.69% of 50 DAV
50 DAV is 40,000
|
$43.80
-2.28%
|
4/25/2017
|
$38.95
|
PP = $40.09
|
|
MB = $42.09
|
Most Recent Note - 10/12/2017 5:06:45 PM
G - Still stubbornly holding its ground near its 52-week high following an impressive spurt of volume-driven gains. Recently reported Jun '17 earnings +23% on +45% sales revenues, below the +25% minimum earnings guideline (C criteria), raising fundamental concerns. See the latest FSU analysis for more details and a new annotated graph.
>>> FEATURED STOCK ARTICLE : Holding Ground Following Impressive Volume-Driven Gains - 10/12/2017 |
View all notes |
Set NEW NOTE alert |
Company Profile |
SEC
News |
Chart |
Request a new note
C
A
S
I |
Symbol/Exchange
Company Name
Industry Group |
PRICE |
CHANGE
(%Change) |
Day High |
Volume
(% DAV)
(% 50 day avg vol) |
52 Wk Hi
% From Hi |
Featured
Date |
Price
Featured |
Pivot Featured |
|
Max Buy |
OLLI
-
NASDAQ
Ollie's Bargain Outlet
Retail-DiscountandVariety
|
$45.30
|
+0.00
0.00% |
$45.40
|
217,094
39.62% of 50 DAV
50 DAV is 548,000
|
$46.90
-3.41%
|
9/8/2017
|
$45.20
|
PP = $46.18
|
|
MB = $48.49
|
Most Recent Note - 10/11/2017 4:03:14 PM
Y - Hovering near its all-time high with volume totals cooling. Recent gains above the latest pivot point did not meet the minimum +40% above average volume threshold necessary to trigger a proper new (or add-on) technical buy signal. Confirming volume-driven gains would be a reassuring sign of fresh institutional buying demand. Fundamentals remain strong.
>>> FEATURED STOCK ARTICLE : Quietly Hit New Highs Without Great Volume Conviction - 10/3/2017 |
View all notes |
Set NEW NOTE alert |
Company Profile |
SEC
News |
Chart |
Request a new note
C
A
S
I |
HLI
-
NYSE
Houlihan Lokey Inc Cl A
Finance-Invest Bnk/Bkrs
|
$40.47
|
+0.51
1.28% |
$40.63
|
156,414
72.75% of 50 DAV
50 DAV is 215,000
|
$40.63
-0.39%
|
9/18/2017
|
$37.04
|
PP = $39.78
|
|
MB = $41.77
|
Most Recent Note - 10/16/2017 4:24:42 PM
Y - Matched its all-time high with today's 4th consecutive small gain lacking great volume conviction. Gains above the pivot point must be backed by at least +40% above average volume to trigger a proper new (or add-on) technical buy signal. Subsequent losses below the recent low ($34.41 on 8/18/17) would raise more serious concerns and trigger a technical sell signal.
>>> FEATURED STOCK ARTICLE : Rebounding Toward Prior High and New Pivot Point - 9/27/2017 |
View all notes |
Set NEW NOTE alert |
Company Profile |
SEC
News |
Chart |
Request a new note
C
A
S
I |
ICHR
-
NASDAQ
Ichor Holdings Ltd
ELECTRONICS - Semiconductor Equipment
|
$32.89
|
+0.22
0.67% |
$33.94
|
1,026,267
151.59% of 50 DAV
50 DAV is 677,000
|
$33.06
-0.51%
|
10/10/2017
|
$29.39
|
PP = $28.36
|
|
MB = $29.78
|
Most Recent Note - 10/16/2017 12:01:33 PM
G - On track for an 8th consecutive gain today, very extended from its prior base. Prior highs in the $29 area define initial support to watch on pullbacks. Disciplined investors avoid chasing stocks extended more than +5% above prior highs and always limit losses by selling any stock that falls more than -7% from their purchase price.
>>> FEATURED STOCK ARTICLE : Semiconductor Equipment Firm Finished Strong After Highlighted - 10/10/2017 |
View all notes |
Set NEW NOTE alert |
Company Profile |
SEC
News |
Chart |
Request a new note
C
A
S
I |
|
|
|
THESE ARE NOT BUY RECOMMENDATIONS!
Comments contained in the body of this report are technical
opinions only. The material herein has been obtained
from sources believed to be reliable and accurate, however,
its accuracy and completeness cannot be guaranteed.
This site is not an investment advisor, hence it does
not endorse or recommend any securities or other investments.
Any recommendation contained in this report may not
be suitable for all investors and it is not to be deemed
an offer or solicitation on our part with respect to
the purchase or sale of any securities. All trademarks,
service marks and trade names appearing in this report
are the property of their respective owners, and are
likewise used for identification purposes only.
This report is a service available
only to active Paid Premium Members.
You may opt-out of receiving report notifications
at any time. Questions or comments may be submitted
by writing to Premium Membership Services 665 S.E. 10 Street, Suite 201 Deerfield Beach, FL 33441-5634 or by calling 1-800-965-8307
or 954-785-1121.
|
|
|