You are not logged in.
This means you
CAN ONLY VIEW reports that were published prior to Tuesday, April 1, 2025.
You
MUST UPGRADE YOUR MEMBERSHIP if you want to see any current reports.
AFTER MARKET UPDATE - WEDNESDAY, FEBRUARY 10TH, 2021
Previous After Market Report Next After Market Report >>>
|
|
|
|
DOW |
+61.97 |
31,437.80 |
+0.20% |
|
Volume |
978,348,710 |
+10% |
|
Volume |
10,470,873,500 |
+22% |
|
NASDAQ |
-35.16 |
13,972.53 |
-0.25% |
|
Advancers |
1,605 |
51% |
|
Advancers |
1,762 |
45% |
|
S&P 500 |
-1.35 |
3,909.88 |
-0.03% |
|
Decliners |
1,566 |
49% |
|
Decliners |
2,195 |
55% |
|
Russell 2000 |
-16.56 |
2,282.44 |
-0.72% |
|
52 Wk Highs |
343 |
|
|
52 Wk Highs |
658 |
|
|
S&P 600 |
-4.46 |
1,290.93 |
-0.34% |
|
52 Wk Lows |
6 |
|
|
52 Wk Lows |
18 |
|
|
 |
Major Averages Were Mixed and Little Changed
Kenneth J. Gruneisen - Passed the CAN SLIM® Master's Exam
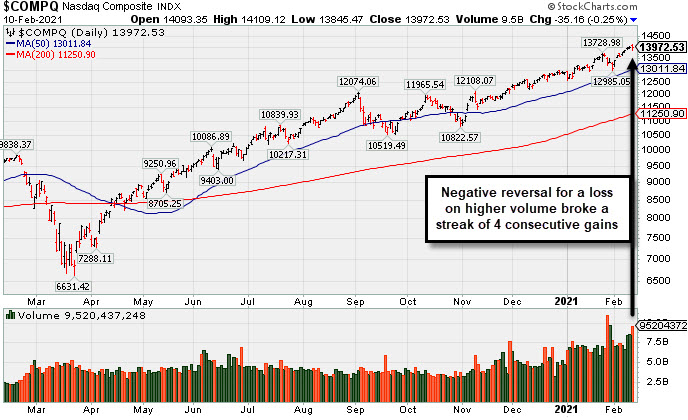
The Dow added 61 points, resuming its ascent to close at a new all-time-high. The S&P 500 edged down less than 0.1%, while the Nasdaq Composite dipped 0.3%, ending a streak of four straight record closes. The volume totals were higher than the prior session on the NYSE and on the Nasdaq exchange. Advancers led decliners by a narrow margin on the NYSE but decliners led advancers by an 11-9 margin on the Nasdaq exchange. There were 105 high-ranked companies from the Leaders List that hit new 52-week highs and were listed on the BreakOuts Page, versus the total of 116 on the prior session. New 52-week highs totals easily outnumbered new 52-week lows totals on both exchanges. The major indices are in a confirmed uptrend (M criteria) with healthy leadership provided by many stocks hitting new highs. Investors are reminded to always make buying and selling decisions based based on the strict criteria and rules of the fact-based investment system. PICTURED: The Nasdaq Composite Index's "negative reversal" for a loss on higher volume broke a streak of 4 consecutive gains into record high territory.
U.S. stocks finished mixed in choppy trading Wednesday as investors digested central bank commentary, corporate earnings results and tepid U.S. inflation data. In central bank news, Federal Reserve Chair Jerome Powell delivered remarks urging broad labor market support from all parts of society, including the private sector. In order to once again reach maximum employment, the Fed chief reiterated the need for continued accommodative monetary policy and called on Washington to provide further fiscal stimulus. On the data front, core consumer prices (excluding food and energy prices) climbed 1.4% year-over-year in January, slowing from December's 1.6% reading. Treasuries advanced following the muted inflation figures, with the yield on the 10-year note down five basis points to 1.12%.
Six of 11 S&P 500 sectors closed in negative territory. The Consumer Discretionary group lagged, with Amazon (AMZN -0.56%) sliding. Energy shares outperformed as oil prices remained at 13-month highs. WTI crude rose 0.2% to $58.50/barrel, extending its longest winning streak in more than two years amid an optimistic demand outlook. In earnings, Twitter (TWTR +13.20%) rising after exceeding top and bottom line analyst estimates. Cisco Systems (CSCO -2.6%) fell after the CEO warned that the pandemic would likely continue to weigh on its growth. Meanwhile, ride-hailing service Lyft (LYFT +4.79%) rose after reporting a smaller-than-expected loss in the fourth quarter. |
 Kenneth J. Gruneisen started out as a licensed stockbroker in August 1987, a couple of months prior to the historic stock market crash that took the Dow Jones Industrial Average down -22.6% in a single day. He has published daily fact-based fundamental and technical analysis on high-ranked stocks online for two decades. Through FACTBASEDINVESTING.COM, Kenneth provides educational articles, news, market commentary, and other information regarding proven investment systems that work in good times and bad.
Comments contained in the body of this report are technical opinions only and are not necessarily those of Gruneisen Growth Corp. The material herein has been obtained from sources believed to be reliable and accurate, however, its accuracy and completeness cannot be guaranteed. Our firm, employees, and customers may effect transactions, including transactions contrary to any recommendation herein, or have positions in the securities mentioned herein or options with respect thereto. Any recommendation contained in this report may not be suitable for all investors and it is not to be deemed an offer or solicitation on our part with respect to the purchase or sale of any securities. |
|
 |
Broker/Dealer Index and Energy Linked Groups Led Gainers
Kenneth J. Gruneisen - Passed the CAN SLIM® Master's Exam
The Broker/Dealer Index ($XBD +0.80%) posted a modest gain while the Bank Index ($BKX +0.02%) finished flat and the Retail Index ($RLX -0.25%) edged lower. The Semiconductor Index ($SOX +0.32%) and Biotech Index ($BTK +0.13%) both edged higher while the Networking Index ($NWX -0.22%) finished slightly lower. The Oil Services Index ($OSX +2.07%) and Integrated Oil Index ($XOI +1.57%) both notched gains while the Gold & Silver Index ($XAU -0.19%) edged lower.
PICTURED: The Oil Services Index ($OSX +2.07%) found prompt support at its 50-day moving average (DMA) line during the latest consolidation and rebounded near the recent high.
| Oil Services |
$OSX |
52.67 |
+1.07 |
+2.07% |
+18.81% |
| Integrated Oil |
$XOI |
909.97 |
+14.02 |
+1.57% |
+14.83% |
| Semiconductor |
$SOX |
3,074.86 |
+9.92 |
+0.32% |
+9.99% |
| Networking |
$NWX |
835.68 |
-1.81 |
-0.22% |
+16.53% |
| Broker/Dealer |
$XBD |
420.29 |
+3.32 |
+0.80% |
+11.31% |
| Retail |
$RLX |
3,672.60 |
-9.08 |
-0.25% |
+3.07% |
| Gold & Silver |
$XAU |
143.65 |
-0.27 |
-0.19% |
-0.37% |
| Bank |
$BKX |
108.06 |
+0.02 |
+0.02% |
+10.36% |
| Biotech |
$BTK |
6,287.29 |
+8.30 |
+0.13% |
+9.55% |
|
|
|
 |
Close Above 50-Day Moving Average But Relative Strength a Concern
Kenneth J. Gruneisen - Passed the CAN SLIM® Master's Exam
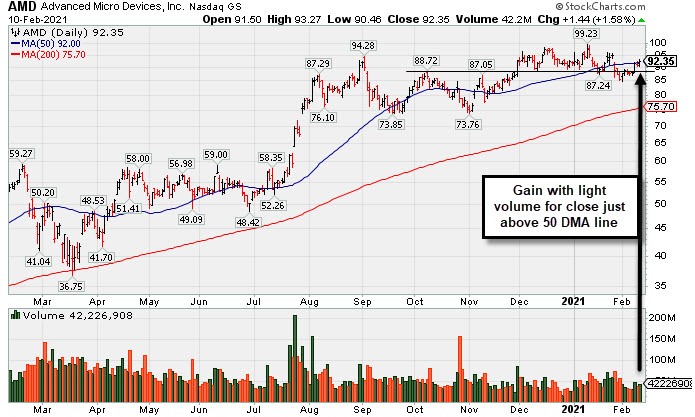
Advanced Micro Devices (AMD +$1.44 or +1.58% to $92.35) posted a small gain today with lighter than average volume. It closed above its 50-day moving average (DMA) line ($92.00) which has recently been acting as resistance. Its current Relative Strength rating of 66 is still below the 80+ minimum guideline for buy candidates. Fundamentals remain strong after it reported Dec '20 quarterly earnings +63% on +53% sales revenues versus the year ago period.
Earnings rose +63% on +53% sales revenues for the Dec '20 quarter versus the year ago period, extending its impressive streak of quarterly comparisons with very strong earnings increases well above the +25% minimum guideline (C criteria) with strong underlying sales revenues growth. Annual earnings growth (A criteria) has been very strong after losses in FY '15 and '16. it has a 98 Earnings Per Share Rating.
AMD hails from the Electronics - Semiconductor Fabless industry which has a Group Relative Strength Rating of 49 (L criteria). It has a large supply of 1.21 billion shares outstanding (S criteria), which makes it less likely to be a quick sprinter. However, the number of top-rated funds owning its shares rose from 1,669 in Jun '19 to 2,456 in Dec '20, a reassuring sign concerning the I criteria. Its current Up/Down Volume Ratio of 0.9 is an unbiased indication its shares have been under slight distributional pressure over the past 50 days. It has a Timeliness Rating of B, a Sponsorship Rating of B, and an Accumulation/Distribution rating of C+.
|
|
|
Color Codes Explained :
Y - Better candidates highlighted by our
staff of experts.
G - Previously featured
in past reports as yellow but may no longer be buyable under the
guidelines.
***Last / Change / Volume data in this table is the closing quote data***
Symbol/Exchange
Company Name
Industry Group |
PRICE |
CHANGE
(%Change) |
Day High |
Volume
(% DAV)
(% 50 day avg vol) |
52 Wk Hi
% From Hi |
Featured
Date |
Price
Featured |
Pivot Featured |
|
Max Buy |
 CRL
-
NYSE
CRL
-
NYSE
Charles River Labs Intl
DRUGS - Biotechnology
|
$280.55
|
+2.70
0.97% |
$286.87
|
328,795
115.37% of 50 DAV
50 DAV is 285,000
|
$284.60
-1.42%
|
12/17/2020
|
$247.06
|
PP = $257.98
|
|
MB = $270.88
|
Most Recent Note - 2/8/2021 2:43:52 PM
G - Rebounded above its "max buy" level near its prior high and its color code is changed to green. Recently tested and found prompt support at the prior high ($257) and its 50 DMA line ($255). Reported Sep '20 quarterly earnings +38% on +11% sales revenues versus the year ago period, above the +25% minimum earnings guideline (C criteria).
>>> FEATURED STOCK ARTICLE : Testing Important Support on Pullback - 1/29/2021 |
View all notes |
Set NEW NOTE alert |
Company Profile |
SEC
News |
Chart |
Request a new note
C
A
S
I |
AMD
-
NYSE
Advanced Micro Devices
ELECTRONICS - Semiconductor - Broad Line
|
$92.35
|
+1.44
1.58% |
$93.27
|
42,231,427
95.58% of 50 DAV
50 DAV is 44,184,300
|
$99.23
-6.93%
|
11/18/2020
|
$82.54
|
PP = $88.72
|
|
MB = $93.16
|
 Most Recent Note - 2/10/2021 5:42:05 PM
G - Quietly rebounded to close above its 50 DMA line ($92.00) which has been acting as resistance. Its current Relative Strength rating of 66 is still below the 80+ minimum guideline for buy candidates. Fundamentals remain strong after it reported Dec '20 quarterly earnings +63% on +53% sales revenues versus the year ago period. See the latest FSU analysis for more details and a new annotated graph.
>>> FEATURED STOCK ARTICLE : Close Above 50-Day Moving Average But Relative Strength a Concern - 2/10/2021 |
View all notes |
Set NEW NOTE alert |
Company Profile |
SEC
News |
Chart |
Request a new note
C
A
S
I |
AMRC
-
NYSE
Ameresco Inc Cl A
ENERGY - Alternative
|
$67.18
|
-2.23
-3.21% |
$70.26
|
417,608
91.58% of 50 DAV
50 DAV is 456,000
|
$69.73
-3.66%
|
12/15/2020
|
$46.72
|
PP = $47.10
|
|
MB = $49.46
|
Most Recent Note - 2/10/2021 5:44:18 PM
G - Reversed after hitting a new all-time high today. Extended from any sound base. Its 50-day moving average (DMA) line ($53.89) defines near-term support to watch..
>>> FEATURED STOCK ARTICLE : Rebounding After Retreat From Record High - 2/1/2021 |
View all notes |
Set NEW NOTE alert |
Company Profile |
SEC
News |
Chart |
Request a new note
C
A
S
I |
TREX
-
NYSE
Trex Company Inc
MATERIALS and CONSTRUCTION - General Building Materials
|
$101.76
|
-2.68
-2.57% |
$105.79
|
494,522
71.57% of 50 DAV
50 DAV is 691,000
|
$104.66
-2.77%
|
6/26/2020
|
$54.53
|
PP = $66.47
|
|
MB = $69.79
|
Most Recent Note - 2/8/2021 2:45:50 PM
G - Touched a new all-time high with today's 3rd consecutive gain backed by below average volume. Its 50 DMA line ($86.55) and prior highs in the $80-81 area define important support to watch on pullbacks. Sep '20 quarterly earnings were +14% on +19% sales revenues versus the year ago period, below the +25% minimum guideline (C criteria) raising fundamental concerns.
>>> FEATURED STOCK ARTICLE : Hit New All-Time High With Gain Backed by Average Volume - 1/19/2021 |
View all notes |
Set NEW NOTE alert |
Company Profile |
SEC
News |
Chart |
Request a new note
C
A
S
I |
CLFD
-
NASDAQ
Clearfield Inc
TELECOMMUNICATIONS - Cables / Satalite Equipment
|
$33.78
|
-1.07
-3.07% |
$35.06
|
232,748
168.66% of 50 DAV
50 DAV is 138,000
|
$37.54
-10.02%
|
1/20/2021
|
$31.38
|
PP = $28.42
|
|
MB = $29.84
|
Most Recent Note - 2/10/2021 5:49:44 PM
G - Suffered a loss today with higher volume breaking a streak of 5 consecutive gains. It is extended from any sound base. Prior highs in the $28 area define initial support to watch above its 50 DMA line ($27.92). Reported Dec '20 quarterly earnings +475% on +40% sales revenues versus the year ago period, continuing its strong earning track record.
>>> FEATURED STOCK ARTICLE : Perched Near Record High With Earnings Report Due Soon - 1/27/2021 |
View all notes |
Set NEW NOTE alert |
Company Profile |
SEC
News |
Chart |
Request a new note
C
A
S
I |
Symbol/Exchange
Company Name
Industry Group |
PRICE |
CHANGE
(%Change) |
Day High |
Volume
(% DAV)
(% 50 day avg vol) |
52 Wk Hi
% From Hi |
Featured
Date |
Price
Featured |
Pivot Featured |
|
Max Buy |
NOW
-
NYSE
Servicenow Inc
Computer Sftwr-Enterprse
|
$589.36
|
+7.58
1.30% |
$593.78
|
953,701
69.21% of 50 DAV
50 DAV is 1,378,000
|
$598.37
-1.51%
|
8/20/2020
|
$453.34
|
PP = $454.79
|
|
MB = $477.53
|
Most Recent Note - 2/5/2021 5:03:09 PM
G - Hit new all-time highs with recent gains backed by light volume. A new pivot point was not cited due to fundamental concerns noted as its impressive rally has continued. Gapped up on 1/28/21 promptly rebounding above its 50 DMA line ($538.84). Fundamental concerns remain after it reported Dec '20 quarterly earnings +22% on +31% sales revenues versus the year ago period, its 2nd consecutive comparison below the +25% minimum guideline (C criteria) of the fact-based investment system. See the latest FSU analysis for more details and a new annotated graph.
>>> FEATURED STOCK ARTICLE : Hit New Highs With Latest Gains Backed by Light Volume - 2/5/2021 |
View all notes |
Set NEW NOTE alert |
Company Profile |
SEC
News |
Chart |
Request a new note
C
A
S
I |
SMPL
-
NASDAQ
Simply Good Foods Co
Food-Confectionery
|
$29.99
|
+0.32
1.08% |
$30.23
|
320,637
27.08% of 50 DAV
50 DAV is 1,183,900
|
$32.03
-6.37%
|
12/28/2020
|
$30.40
|
PP = $31.44
|
|
MB = $33.01
|
Most Recent Note - 2/8/2021 3:07:20 PM
G - Posting a gain today with lighter than average volume. Its Relative Strength Rating is 64, still below the 80+ minimum guideline. Its 50 DMA line ($27.23) and prior low ($26.78) define near term support to watch.
>>> FEATURED STOCK ARTICLE : Relative Strength Rating Suffered During Stalling Action - 1/21/2021 |
View all notes |
Set NEW NOTE alert |
Company Profile |
SEC
News |
Chart |
Request a new note
C
A
S
I |
ALRM
-
NASDAQ
Alarm.com Holdings Inc
Security/Sfty
|
$101.88
|
-2.72
-2.60% |
$107.18
|
359,933
78.76% of 50 DAV
50 DAV is 457,000
|
$108.67
-6.25%
|
2/9/2021
|
$71.88
|
PP = $108.67
|
|
MB = $114.10
|
Most Recent Note - 2/9/2021 5:39:32 PM
Y - Rebounding toward its prior high with today's gain backed by below average volume. Color code is changed to yellow as a valid secondary buy point exists up to 5% above the prior high since it found support at its 10 week moving average (WMA) line ($97.31).
>>> FEATURED STOCK ARTICLE : Encountered Distributional Pressure After Big Rally - 1/20/2021 |
View all notes |
Set NEW NOTE alert |
Company Profile |
SEC
News |
Chart |
Request a new note
C
A
S
I |
TEAM
-
NASDAQ
Atlassian Corp Plc Cl A
Comp Sftwr-Spec Enterprs
|
$252.46
|
+4.41
1.78% |
$256.05
|
1,421,100
99.45% of 50 DAV
50 DAV is 1,429,000
|
$251.28
0.47%
|
10/12/2020
|
$193.77
|
PP = $199.60
|
|
MB = $209.58
|
Most Recent Note - 2/8/2021 5:17:07 PM
G - Quietly touched a new high today. Rebounded impressively from a brief dip below its 50 DMA line ($232.94). Recent low ($208.62 on 1/27/21) defines important near-term support to watch. Its current Relative Strength Rating is 72, below the +80 minimum guideline for buy candidates. Fundamental concerns remain after earnings rose +0% on +23% sales revenues for the Dec '20 quarter versus the year ago period, its 2nd comparison below the +25% minimum earnings guideline (C criteria). See the latest FSU analysis for more details and a new annotated graph.
>>> FEATURED STOCK ARTICLE : Quietly Touched a New High Despite Fundamental Concerns Noted - 2/8/2021 |
View all notes |
Set NEW NOTE alert |
Company Profile |
SEC
News |
Chart |
Request a new note
C
A
S
I |
SHOP
-
NYSE
Shopify Inc Cl A
Computer Sftwr-Enterprse
|
$1,462.42
|
+29.43
2.05% |
$1,499.75
|
2,067,752
159.80% of 50 DAV
50 DAV is 1,294,000
|
$1,453.49
0.61%
|
2/2/2021
|
$1,218.72
|
PP = $1,285.28
|
|
MB = $1,349.54
|
Most Recent Note - 2/10/2021 1:00:36 PM
G - Extended from any sound base, it has rallied well above its "max buy" level and hit yet another new all-time high with above average volume behind today's 5th consecutive gain. Prior high ($1,285 on 12/22/20) defines important support to watch above its 50 DMA line ($1,164).
>>> FEATURED STOCK ARTICLE : Perched Within Striking Distance of New Pivot Point - 2/3/2021 |
View all notes |
Set NEW NOTE alert |
Company Profile |
SEC
News |
Chart |
Request a new note
C
A
S
I |
Symbol/Exchange
Company Name
Industry Group |
PRICE |
CHANGE
(%Change) |
Day High |
Volume
(% DAV)
(% 50 day avg vol) |
52 Wk Hi
% From Hi |
Featured
Date |
Price
Featured |
Pivot Featured |
|
Max Buy |
YETI
-
NYSE
Yeti Holdings Inc
Leisure-Products
|
$78.00
|
+0.78
1.01% |
$79.42
|
1,443,424
109.77% of 50 DAV
50 DAV is 1,315,000
|
$80.89
-3.57%
|
11/5/2020
|
$57.25
|
PP = $55.14
|
|
MB = $57.90
|
Most Recent Note - 2/8/2021 3:09:19 PM
G - Rebounding further above the 50 DMA line ($69.93) with today's 4th consecutive gain backed by below average volume. It has not formed a sound base of sufficient length. Prior low ($64.80) on 2/01/21) defines important near term support below its 50 DMA line.
>>> FEATURED STOCK ARTICLE : 50-Day Moving Average and Prior Lows Define Near-Term Support - 1/22/2021 |
View all notes |
Set NEW NOTE alert |
Company Profile |
SEC
News |
Chart |
Request a new note
C
A
S
I |
BJ
-
NYSE
BJs Wholesale Club Hldgs
Retail-DiscountandVariety
|
$43.69
|
-0.03
-0.07% |
$44.08
|
1,022,180
42.87% of 50 DAV
50 DAV is 2,384,400
|
$50.18
-12.93%
|
1/28/2021
|
$44.74
|
PP = $47.56
|
|
MB = $49.94
|
Most Recent Note - 2/10/2021 5:48:18 PM
Y - Volume totals have been cooling while stubbornly holding its ground. The prior low and 50 DMA line define important near term support in the $40 area.
>>> FEATURED STOCK ARTICLE : Pulled Back After Breakout Capped 7-Day Winning Streak - 1/28/2021 |
View all notes |
Set NEW NOTE alert |
Company Profile |
SEC
News |
Chart |
Request a new note
C
A
S
I |
DOCU
-
NASDAQ
Docusign Inc
Computer Sftwr-Enterprse
|
$255.25
|
-0.57
-0.22% |
$261.76
|
2,222,341
62.27% of 50 DAV
50 DAV is 3,569,000
|
$290.23
-12.05%
|
1/12/2021
|
$253.50
|
PP = $256.10
|
|
MB = $268.91
|
Most Recent Note - 2/9/2021 5:34:06 PM
Y - Wedging higher since its rebound above the 50 DMA line ($238) helped its outlook improve. Faces little resistance due to overhead supply. The prior low ($216.50 on 1/04/21) defines the next important support to watch. Fundamentals remain strong. See the latest FSU analysis for more details and a new annotated graph.
>>> FEATURED STOCK ARTICLE : Consolidating Back Above 50-Day Moving Average Near Prior High - 2/9/2021 |
View all notes |
Set NEW NOTE alert |
Company Profile |
SEC
News |
Chart |
Request a new note
C
A
S
I |
DT
-
NYSE
Dynatrace Inc
Computer Sftwr-Enterprse
|
$54.48
|
-0.68
-1.23% |
$56.20
|
1,426,880
57.98% of 50 DAV
50 DAV is 2,461,000
|
$56.77
-4.03%
|
2/4/2021
|
$51.39
|
PP = $48.95
|
|
MB = $51.40
|
Most Recent Note - 2/10/2021 5:52:49 PM
G - Volume totals are cooling while perched near its all-time high following a streak of volume-driven gains. Prior highs in the $48 area define initial support to watch above its 50 DMA line. Fundamentals remain strong after it reported Dec '20 earnings +70% on +28% sales revenues versus the year ago period.
>>> FEATURED STOCK ARTICLE : Breakout Action Returns Dynatrace to Featured Stocks List - 2/4/2021 |
View all notes |
Set NEW NOTE alert |
Company Profile |
SEC
News |
Chart |
Request a new note
C
A
S
I |
QTWO
-
NYSE
Q2 Holdings Inc
Computer Sftwr-Financial
|
$145.74
|
+1.62
1.12% |
$148.56
|
627,743
128.64% of 50 DAV
50 DAV is 488,000
|
$144.86
0.61%
|
11/12/2020
|
$105.14
|
PP = $106.54
|
|
MB = $111.87
|
Most Recent Note - 2/8/2021 3:03:02 PM
G - Inching to another new high with today's gain, getting more extended from any sound base. Its 50 DMA line ($126.22) defines important near term support to watch on pullbacks.
>>> FEATURED STOCK ARTICLE : Perched Near All-Time High Stubbornly Holding Ground - 1/26/2021 |
View all notes |
Set NEW NOTE alert |
Company Profile |
SEC
News |
Chart |
Request a new note
C
A
S
I |
Symbol/Exchange
Company Name
Industry Group |
PRICE |
CHANGE
(%Change) |
Day High |
Volume
(% DAV)
(% 50 day avg vol) |
52 Wk Hi
% From Hi |
Featured
Date |
Price
Featured |
Pivot Featured |
|
Max Buy |
AXON
-
NASDAQ
Axon Enterprise Inc
Security/Sfty
|
$187.98
|
+4.82
2.63% |
$190.04
|
482,482
80.15% of 50 DAV
50 DAV is 602,000
|
$184.89
1.67%
|
12/22/2020
|
$127.84
|
PP = $130.51
|
|
MB = $137.04
|
Most Recent Note - 2/10/2021 5:45:49 PM
G - Very extended from any sound base, it posted a 9th consecutive gain today with below average volume. Its 50 DMA line ($142) and prior high ($134) define important support to watch on pullbacks. Fundamentals remain strong. Formerly traded under the ticker symbol AAXN where prior notes and detailed analysis may be reviewed.
>>> FEATURED STOCK ARTICLE : Extended From Prior Base Following Streak fo Volume-Driven Gains - 2/2/2021 |
View all notes |
Set NEW NOTE alert |
Company Profile |
SEC
News |
Chart |
Request a new note
C
A
S
I |
|
|
|
THESE ARE NOT BUY RECOMMENDATIONS!
Comments contained in the body of this report are technical
opinions only. The material herein has been obtained
from sources believed to be reliable and accurate, however,
its accuracy and completeness cannot be guaranteed.
This site is not an investment advisor, hence it does
not endorse or recommend any securities or other investments.
Any recommendation contained in this report may not
be suitable for all investors and it is not to be deemed
an offer or solicitation on our part with respect to
the purchase or sale of any securities. All trademarks,
service marks and trade names appearing in this report
are the property of their respective owners, and are
likewise used for identification purposes only.
This report is a service available
only to active Paid Premium Members.
You may opt-out of receiving report notifications
at any time. Questions or comments may be submitted
by writing to Premium Membership Services 665 S.E. 10 Street, Suite 201 Deerfield Beach, FL 33441-5634 or by calling 1-800-965-8307
or 954-785-1121.
|
|
|