***Last / Change / Volume data in this table is the closing quote data***
Symbol/Exchange
Company Name
Industry Group |
PRICE |
CHANGE
(%Change) |
Day High |
Volume
(% DAV)
(% 50 day avg vol) |
52 Wk Hi
% From Hi |
Featured
Date |
Price
Featured |
Pivot Featured |
|
Max Buy |
 ABCB
-
NASDAQ
ABCB
-
NASDAQ
Ameris Bancorp
BANKING - Regional - Mid-Atlantic Banks
|
$54.05
|
-1.51
-2.72% |
$56.46
|
258,087
61.45% of 50 DAV
50 DAV is 420,000
|
$59.85
-9.69%
|
5/21/2021
|
$58.86
|
PP = $57.91
|
|
MB = $60.81
|
 Most Recent Note - 6/10/2021 6:06:19 PM
Y - Testing support at its 50 DMA line ($54.02) with today's 3rd consecutive loss on light volume, still sputtering below the previously cited pivot point. More damaging losses would raise greater concerns and trigger a worrisome technical sell signal.
>>> FEATURED STOCK ARTICLE : Breakout to New All-Time High for Another Regional Bank - 5/21/2021 |
View all notes |
Set NEW NOTE alert |
Company Profile |
SEC
News |
Chart |
Request a new note
C
A
S
I |
SIVB
-
NASDAQ
S V B Financial Group
BANKING - Regional - Pacific Banks
|
$566.47
|
-27.76
-4.67% |
$604.95
|
537,948
127.78% of 50 DAV
50 DAV is 421,000
|
$608.84
-6.96%
|
4/23/2021
|
$579.70
|
PP = $577.16
|
|
MB = $606.02
|
Most Recent Note - 6/10/2021 1:02:41 PM
Y - Pulling back this week after inching to new all-time highs with gains backed by light volume. Confirming gains above the pivot point backed by at least +40% above average volume are still needed to help clinch a convincing technical buy signal. Its 50 DMA line ($553) defines near-term support to watch. Reported earnings +293% on +64% sales revenues for the Mar '21 quarter versus the year ago period, its 3rd strong comparison. Completed a new Public Offering on 3/24/21.
>>> FEATURED STOCK ARTICLE : Sputtering Since Featured Without Confirming Gains - 5/20/2021 |
View all notes |
Set NEW NOTE alert |
Company Profile |
SEC
News |
Chart |
Request a new note
C
A
S
I |
LOGI
-
NASDAQ
Logitech Intl Sa
COMPUTER HARDWARE - Computer Peripherals
|
$132.56
|
-6.14
-4.43% |
$135.83
|
1,508,721
191.71% of 50 DAV
50 DAV is 787,000
|
$140.17
-5.43%
|
5/26/2021
|
$119.13
|
PP = $120.34
|
|
MB = $126.36
|
Most Recent Note - 6/10/2021 12:42:05 PM
G - Pulling back from its all-time high with today's gap down and loss on higher volume. Very extended from the previously noted base. Prior highs in the $120-117 area define initial support to watch on pullbacks.
>>> FEATURED STOCK ARTICLE : Streak of Gains to New Highs Lacked Great Volume Conviction - 5/27/2021 |
View all notes |
Set NEW NOTE alert |
Company Profile |
SEC
News |
Chart |
Request a new note
C
A
S
I |
CROX
-
NASDAQ
Crocs Inc
CONSUMER NON-DURABLES - Textile - Apparel Footwear
|
$104.54
|
-0.64
-0.61% |
$105.81
|
939,718
55.38% of 50 DAV
50 DAV is 1,697,000
|
$109.91
-4.89%
|
4/27/2021
|
$99.81
|
PP = $86.50
|
|
MB = $90.83
|
Most Recent Note - 6/7/2021 5:31:40 PM
G - Posted a 3rd consecutive gain today with below average volume, hovering near is all-time high. Its 50 DMA line ($92.79) defines initial support above prior highs in the $86 area.
>>> FEATURED STOCK ARTICLE : Encountered Distributional Pressure Late This Week - 5/28/2021 |
View all notes |
Set NEW NOTE alert |
Company Profile |
SEC
News |
Chart |
Request a new note
C
A
S
I |
RCKY
-
NASDAQ
Rocky Brands Inc
CONSUMER NON-DURABLES - Textile - Apparel Footwear
|
$53.46
|
-1.48
-2.69% |
$55.20
|
63,655
65.62% of 50 DAV
50 DAV is 97,000
|
$69.00
-22.52%
|
5/5/2021
|
$61.65
|
PP = $61.55
|
|
MB = $64.63
|
Most Recent Note - 6/7/2021 5:27:16 PM
G - Suffered a 4th consecutive loss today with below average volume and it has been sputtering below its 50 DMA line ($56.38). A rebound above that short-term average is needed for its outlook to improve. The prior low ($50.52 on 5/19/21) defines the next important support where any violation may trigger a more worrisome technical sell signal. Fundamentals remain strong. See the latest FSU analysis for more details and a new annotated graph.
>>> FEATURED STOCK ARTICLE : Still Sputtering After Slump Below 50-Day Moving Average - 6/7/2021 |
View all notes |
Set NEW NOTE alert |
Company Profile |
SEC
News |
Chart |
Request a new note
C
A
S
I |
Symbol/Exchange
Company Name
Industry Group |
PRICE |
CHANGE
(%Change) |
Day High |
Volume
(% DAV)
(% 50 day avg vol) |
52 Wk Hi
% From Hi |
Featured
Date |
Price
Featured |
Pivot Featured |
|
Max Buy |
CRL
-
NYSE
Charles River Labs Intl
DRUGS - Biotechnology
|
$354.78
|
+8.87
2.56% |
$354.89
|
386,549
56.02% of 50 DAV
50 DAV is 690,000
|
$349.13
1.62%
|
6/9/2021
|
$345.91
|
PP = $349.23
|
|
MB = $366.69
|
Most Recent Note - 6/9/2021 6:04:03 PM
Y - Posted a 5th consecutive gain with below average volume, wedging toward the prior high. Its 50 DMA line ($323) defines near-term support to watch on pullbacks. Color code is changed to yellow with new pivot point cited based on its 5/05/21 high plus 10 cents. Subsequent gains above the pivot point backed by at least +40% above average volume may trigger a new (or add-on) technical buy signal. Reported Mar '21 quarterly earnings +38% on +17% sales revenues versus the year ago period. Two of the past 3 quarterly comparisons have been above the +25% minimum earnings guideline (C criteria). See the latest FSU analysis for more details and a new annotated graph.
>>> FEATURED STOCK ARTICLE : Building New Base After Strong Quarterly Earnings Report - 6/9/2021 |
View all notes |
Set NEW NOTE alert |
Company Profile |
SEC
News |
Chart |
Request a new note
C
A
S
I |
GNRC
-
NYSE
Generac Hldgs Inc
Electrical-Power/Equipmt
|
$344.62
|
+0.91
0.26% |
$347.92
|
446,001
67.99% of 50 DAV
50 DAV is 656,000
|
$364.00
-5.32%
|
6/8/2021
|
$348.46
|
PP = $342.38
|
|
MB = $359.50
|
Most Recent Note - 6/8/2021 4:57:04 PM
Y - Finished strong today after highlighted in yellow with pivot point cited based on its 4/06/21 high. Gapped up today and triggered a technical buy signal while clearing prior highs and nearly challenging its all-time high. Reported earnings +174% on +70% sales revenues for the Mar '21 quarter versus the year ago period, its 3rd strong quarterly comparison above the +25% minimum guideline (C criteria). Annual earnings (A criteria) growth has been strong and steady. See the latest FSU analysis for more details and a new annotated graph.
>>> FEATURED STOCK ARTICLE : Gap Up Gain With +118% Above Average Volume - 6/8/2021 |
View all notes |
Set NEW NOTE alert |
Company Profile |
SEC
News |
Chart |
Request a new note
C
A
S
I |
CAMT
-
NASDAQ
Camtek Ltd
ELECTRONICS - Scientific and Technical Instrum
|
$38.16
|
-1.02
-2.60% |
$39.02
|
220,377
69.30% of 50 DAV
50 DAV is 318,000
|
$40.47
-5.71%
|
4/28/2021
|
$35.03
|
PP = $35.34
|
|
MB = $37.11
|
Most Recent Note - 6/8/2021 11:54:42 AM
G - Gapped up today hitting a new 52-week high and its color code is changed to green after rising above its "max buy" level. It abruptly rebounded above its 50 DMA line ($32.53) after a deep pullback in recent weeks.
>>> FEATURED STOCK ARTICLE : Perched at 52-Week High After 4th Consecutive Gain - 6/1/2021 |
View all notes |
Set NEW NOTE alert |
Company Profile |
SEC
News |
Chart |
Request a new note
C
A
S
I |
ASML
-
NASDAQ
A S M L Holding N.V. NY
ELECTRONICS - Semiconductor Equipment and Mate
|
$699.94
|
+17.35
2.54% |
$704.78
|
796,235
86.45% of 50 DAV
50 DAV is 921,000
|
$692.12
1.13%
|
5/25/2021
|
$669.59
|
PP = $675.75
|
|
MB = $709.54
|
Most Recent Note - 6/10/2021 6:07:25 PM
Y - Hit another new all time high with light volume behind today's gain. Highlighted in yellow with pivot point cited based on its 4/26/21 high plus 10 cents. Subsequent gain and a strong close above its pivot point backed by at least +40% above average volume is needed to trigger a proper technical buy signal. Its 50 DMA line ($649) defines important near-term support to watch. Reported Mar '21 quarterly earnings +264% on +90% sales revenues versus the year-ago period. The 4 latest quarterly comparisons were above the +25% minimum earnings guideline (C criteria). Annual earnings history included a small downturn in FY '19. Dutch Electronics - Semiconductor Equipment firm made an impressive rally from a deep slump in March.
>>> FEATURED STOCK ARTICLE : Perched Near All-Time High After Short Base Above 50-Day Average - 5/26/2021 |
View all notes |
Set NEW NOTE alert |
Company Profile |
SEC
News |
Chart |
Request a new note
C
A
S
I |
BRKS
-
NASDAQ
Brooks Automation
ELECTRONICS - Semiconductor Equipment and Mate
|
$98.59
|
+2.34
2.43% |
$99.00
|
484,711
60.97% of 50 DAV
50 DAV is 795,000
|
$108.72
-9.32%
|
4/5/2021
|
$99.31
|
PP = $91.88
|
|
MB = $96.47
|
Most Recent Note - 6/9/2021 6:11:02 PM
G - Pulled back with below average volume testing its its 50 DMA line ($96.56) which defines important near-term support. More damaging losses below the recent low ($86.12 on 5/12/21) would raise serious concerns.
>>> FEATURED STOCK ARTICLE : Consolidating Above 50-Day Moving Average Line and Prior High - 6/3/2021 |
View all notes |
Set NEW NOTE alert |
Company Profile |
SEC
News |
Chart |
Request a new note
C
A
S
I |
Symbol/Exchange
Company Name
Industry Group |
PRICE |
CHANGE
(%Change) |
Day High |
Volume
(% DAV)
(% 50 day avg vol) |
52 Wk Hi
% From Hi |
Featured
Date |
Price
Featured |
Pivot Featured |
|
Max Buy |
OPY
-
NYSE
Oppenheimer Holdings Inc
FINANCIAL SERVICES - Investment Brokerage - Regiona
|
$49.57
|
+1.02
2.10% |
$50.00
|
83,576
85.28% of 50 DAV
50 DAV is 98,000
|
$52.45
-5.49%
|
6/7/2021
|
$48.74
|
PP = $52.55
|
|
MB = $55.18
|
Most Recent Note - 6/7/2021 5:42:13 PM
Y - Color code is changed to yellow with new pivot point cited based on its 5/03/21 high plus 10 cents. Still perched near its 52-week high, consolidating in an orderly fashion above its 50 DMA line ($46.61). Subsequent gains above its pivot point backed by at least +40% may trigger a new (or add-on) technical buy signal. Fundamentals remain strong.
>>> FEATURED STOCK ARTICLE : Extended From Any Sound Base After Decent Rally - 5/17/2021 |
View all notes |
Set NEW NOTE alert |
Company Profile |
SEC
News |
Chart |
Request a new note
C
A
S
I |
MTH
-
NYSE
Meritage Homes Corp
MATERIALS and CONSTRUCTION - Residential Construction
|
$97.18
|
-4.24
-4.18% |
$100.87
|
626,526
159.22% of 50 DAV
50 DAV is 393,500
|
$120.19
-19.14%
|
5/12/2021
|
$108.84
|
PP = $117.16
|
|
MB = $123.02
|
Most Recent Note - 6/10/2021 6:16:23 PM
G -Sank further below its 50 DMA line ($102.55) with heavier volume behind today's damaging loss raising concerns and triggering a technical sell signal. A prompt rebound above the 50 DMA line is needed for its outlook to improve. Subsequent gains above the pivot point with at least +40% above average volume would be a reassuring confirmation of fresh institutional buying demand. Fundamentals remain strong.
>>> FEATURED STOCK ARTICLE : Homebuilder Pulled Back After Hitting New High - 5/13/2021 |
View all notes |
Set NEW NOTE alert |
Company Profile |
SEC
News |
Chart |
Request a new note
C
A
S
I |
CRMT
-
NASDAQ
Americas Car-Mart Inc
SPECIALTY RETAIL - Auto Dealerships
|
$147.26
|
-1.24
-0.84% |
$149.58
|
83,151
170.74% of 50 DAV
50 DAV is 48,700
|
$177.45
-17.01%
|
5/25/2021
|
$159.80
|
PP = $165.10
|
|
MB = $173.36
|
Most Recent Note - 6/9/2021 6:06:42 PM
G - Color code is changed to green after slumping below its 50 DMA line ($151.76) with today's loss on above average volume raising concerns. More damaging losses below the prior low ($142) trigger a worrisome technical sell signal.
>>> FEATURED STOCK ARTICLE : Car Dealership Firm Challenging All-Time High - 5/25/2021 |
View all notes |
Set NEW NOTE alert |
Company Profile |
SEC
News |
Chart |
Request a new note
C
A
S
I |
LAD
-
NYSE
Lithia Motors Inc Cl A
SPECIALTY RETAIL - Auto Dealerships
|
$327.85
|
-0.44
-0.13% |
$332.00
|
366,735
91.55% of 50 DAV
50 DAV is 400,600
|
$417.98
-21.56%
|
4/21/2021
|
$377.00
|
PP = $418.08
|
|
MB = $438.98
|
Most Recent Note - 6/10/2021 6:09:56 PM
It will be dropped from the Featured Stocks list tonight after suffering a 7th consecutive small loss. Relative Strength Rating has slumped to 78, below the 80+ minimum guideline for buy candidates. Completed a new Public Offering on 5/19/21. A rebound above its 50 DMA line ($370) is needed for its outlook to improve. It faces resistance due to overhead supply up to the $417 level.
>>> FEATURED STOCK ARTICLE : Gap Down After Proposing New Public Offering - 5/19/2021 |
View all notes |
Set NEW NOTE alert |
Company Profile |
SEC
News |
Chart |
Request a new note
C
A
S
I |
MED
-
NYSE
Medifast Inc
SPECIALTY RETAIL - Specialty Retail, Other
|
$290.39
|
-2.97
-1.01% |
$296.55
|
111,991
95.72% of 50 DAV
50 DAV is 117,000
|
$336.99
-13.83%
|
5/11/2021
|
$285.72
|
PP = $279.56
|
|
MB = $293.54
|
Most Recent Note - 6/7/2021 5:32:57 PM
G - Pulled back today for a 5th consecutive loss with near average volume. It is extended from the previously noted base. The prior high in the $279 area defines initial support to watch.
>>> FEATURED STOCK ARTICLE : Held Ground Following Breakout Gain on Prior Session - 5/11/2021 |
View all notes |
Set NEW NOTE alert |
Company Profile |
SEC
News |
Chart |
Request a new note
C
A
S
I |
Symbol/Exchange
Company Name
Industry Group |
PRICE |
CHANGE
(%Change) |
Day High |
Volume
(% DAV)
(% 50 day avg vol) |
52 Wk Hi
% From Hi |
Featured
Date |
Price
Featured |
Pivot Featured |
|
Max Buy |
CLFD
-
NASDAQ
Clearfield Inc
TELECOMMUNICATIONS - Cables / Satalite Equipment
|
$39.95
|
-0.24
-0.60% |
$40.95
|
59,902
49.10% of 50 DAV
50 DAV is 122,000
|
$43.64
-8.46%
|
6/4/2021
|
$40.01
|
PP = $40.36
|
|
MB = $42.38
|
Most Recent Note - 6/7/2021 12:00:18 PM
Y - There was a "negative reversal" after today's early gain for another new 52-week high. Big gain on the prior session backed by 197% above average volume clinched a new technical buy signal. New pivot point was cited based on its 4/26/21 high plus 10 cents. Its 50 DMA line ($34.50) and recent low define important near-term support in the $33-34 area. Fundamentals remain strong after it reported Mar '21 quarterly earnings +440% on +45% sales revenues versus the year ago period, continuing its strong earnings track record.
>>> FEATURED STOCK ARTICLE : Stalled and Found Support Above 50-Day Moving Average - 5/24/2021 |
View all notes |
Set NEW NOTE alert |
Company Profile |
SEC
News |
Chart |
Request a new note
C
A
S
I |
FSBW
-
NASDAQ
F S Bancorp
Banks-West/Southwest
|
$69.48
|
-1.62
-2.28% |
$71.55
|
9,006
72.63% of 50 DAV
50 DAV is 12,400
|
$73.62
-5.62%
|
5/18/2021
|
$70.16
|
PP = $73.72
|
|
MB = $77.41
|
Most Recent Note - 6/7/2021 5:34:18 PM
Y - This thinly-traded Bank is still perched within close striking distance of the pivot point cited based on its 3/08/21 high plus 10 cents. It has been consolidating above its 50 DMA line ($68.63) where it found prompt support during its ongoing ascent. Subsequent gains above the pivot point backed by at least +40% above average volume are needed to trigger a technical buy signal. Fundamentals remain strong.
>>> FEATURED STOCK ARTICLE : Thinly-Traded Bank Consolidating Above 50-Day Moving Average - 5/18/2021 |
View all notes |
Set NEW NOTE alert |
Company Profile |
SEC
News |
Chart |
Request a new note
C
A
S
I |
SMPL
-
NASDAQ
Simply Good Foods Co
Food-Confectionery
|
$35.04
|
-0.32
-0.90% |
$35.55
|
289,135
55.71% of 50 DAV
50 DAV is 519,000
|
$35.61
-1.60%
|
12/28/2020
|
$30.40
|
PP = $31.44
|
|
MB = $33.01
|
Most Recent Note - 6/10/2021 6:13:56 PM
G - Pulled back today with light volume after quietly wedging to touch a new high on the prior session. Near-term support to watch is its 50 DMA line ($33.51) and the prior low ($31.09 on 5/18/21). Reported Feb '21 quarterly earnings +9% on +2% sales revenues versus the year ago period, below the +25% minimum earnings guideline (C criteria), raising fundamental concerns.
>>> FEATURED STOCK ARTICLE : Hovering Near All-Time High Following Lackluster Quarter - 5/10/2021 |
View all notes |
Set NEW NOTE alert |
Company Profile |
SEC
News |
Chart |
Request a new note
C
A
S
I |
QRVO
-
NASDAQ
"Qorvo, Inc"
ELECTRONICS - Semiconductor - Integrated Cir
|
$182.91
|
+1.36
0.75% |
$184.08
|
578,447
50.05% of 50 DAV
50 DAV is 1,155,800
|
$201.68
-9.31%
|
4/1/2021
|
$190.48
|
PP = $191.92
|
|
MB = $201.52
|
Most Recent Note - 6/10/2021 6:12:20 PM
G - Consolidating in a tight range near its 50 DMA line ($184). Its current Relative Strength Rating is 70, below the 80+ minimum for buy candidates.
>>> FEATURED STOCK ARTICLE : Rebound Above 50-Day Moving Average Helped Outlook - 6/2/2021 |
View all notes |
Set NEW NOTE alert |
Company Profile |
SEC
News |
Chart |
Request a new note
C
A
S
I |
YETI
-
NYSE
Yeti Holdings Inc
Leisure-Products
|
$91.54
|
-3.22
-3.40% |
$95.76
|
1,378,836
95.16% of 50 DAV
50 DAV is 1,449,000
|
$94.98
-3.62%
|
5/13/2021
|
$84.20
|
PP = $90.65
|
|
MB = $95.18
|
Most Recent Note - 6/7/2021 5:37:21 PM
Y - Spiked to a new all-time high with today's big volume-driven gain. Its 50 DMA line ($84.08) and prior highs in the $80 area define near-term support to watch on pullbacks. Reported Mar 21 quarterly earnings +245% on +42% sales revenues versus the year ago period, continuing its strong earnings track record.
>>> FEATURED STOCK ARTICLE : Hovering Near High After Finding Support at 50-Day Moving Average - 6/4/2021 |
View all notes |
Set NEW NOTE alert |
Company Profile |
SEC
News |
Chart |
Request a new note
C
A
S
I |
Symbol/Exchange
Company Name
Industry Group |
PRICE |
CHANGE
(%Change) |
Day High |
Volume
(% DAV)
(% 50 day avg vol) |
52 Wk Hi
% From Hi |
Featured
Date |
Price
Featured |
Pivot Featured |
|
Max Buy |
MRBK
-
NASDAQ
Meridian Corp
Banks-Northeast
|
$26.93
|
+0.17
0.64% |
$27.18
|
23,927
87.01% of 50 DAV
50 DAV is 27,500
|
$29.18
-7.71%
|
5/18/2021
|
$25.58
|
PP = $28.06
|
|
MB = $29.46
|
Most Recent Note - 6/10/2021 6:11:08 PM
Y -Still consolidating in a tight range above its 50 DMA line ($26.18). Stalled since reaching a new 52-week high when featured on 5/18/21. Reported Mar '21 earnings +323% on +93% sales revenues versus the year ago period, continuing its strong earnings track record. Recent low ($24.01 on 4/21/21) defines important near-term support where any violation may trigger a worrisome technical sell signal. Its Relative Strength Rating is 76, below the 80 minimum guideline.
>>> FEATURED STOCK ARTICLE : Bank Consolidating Near 50 Day Moving Average Line - 5/7/2021 |
View all notes |
Set NEW NOTE alert |
Company Profile |
SEC
News |
Chart |
Request a new note
C
A
S
I |
CLAR
-
NASDAQ
Clarus Corporation
Leisure-Products
|
$25.15
|
-0.36
-1.41% |
$25.83
|
110,616
62.14% of 50 DAV
50 DAV is 178,000
|
$26.07
-3.53%
|
5/12/2021
|
$21.40
|
PP = $19.73
|
|
MB = $20.72
|
Most Recent Note - 6/7/2021 11:58:32 AM
G - Gapped up for a big gain today with higher volume as it hit another new 52-week high, getting very extended from the previously noted base. Prior high ($19.63 on 3/09/21) defines initial support to watch above its 50 DMA line ($19.83).
>>> FEATURED STOCK ARTICLE : 4 Volume-Driven Gains Into New High Territory - 5/12/2021 |
View all notes |
Set NEW NOTE alert |
Company Profile |
SEC
News |
Chart |
Request a new note
C
A
S
I |
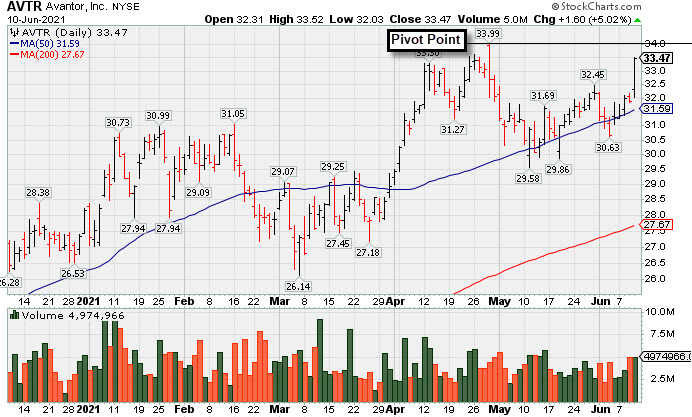
AVTR
-
NYSE
Avantor Inc
Medical-Research Eqp/Svc
|
$33.47
|
+1.60
5.02% |
$33.52
|
4,965,942
127.72% of 50 DAV
50 DAV is 3,888,000
|
$33.99
-1.53%
|
6/10/2021
|
$32.94
|
PP = $34.09
|
|
MB = $35.79
|
Most Recent Note - 6/10/2021 6:03:23 PM
Y - Finished strong and at the session high with +27% above average volume behind today's big gain after highlighted in yellow in the earlier mid-day report with a pivot point cited based on its 4/29/21 high plus 10 cents. Found support at its 50 DMA line during the recent consolidation. Subsequent gains above the pivot point backed by at least +40% are needed to trigger a proper technical buy signal. The Mar '21 quarter marked its 3rd consecutive quarterly comparison with earnings above the year ago period by at least +25% (C criteria). Annual earnings growth has been strong (A criteria). Following its $14 IPO on 5/17/19 it completed Secondary Offerings on 5/21/20, 8/21/20 and 11/09/20. See the latest FSU analysis for more details and a new annotated graph.
>>> FEATURED STOCK ARTICLE : Medical Research Firm Challenging Prior High - 6/10/2021 |
View all notes |
Set NEW NOTE alert |
Company Profile |
SEC
News |
Chart |
Request a new note
C
A
S
I |