You are not logged in.
This means you
CAN ONLY VIEW reports that were published prior to Thursday, March 20, 2025.
You
MUST UPGRADE YOUR MEMBERSHIP if you want to see any current reports.
AFTER MARKET UPDATE - FRIDAY, MAY 28TH, 2021
Previous After Market Report Next After Market Report >>>
|
|
|
|
DOW |
+64.81 |
34,529.45 |
+0.19% |
|
Volume |
1,025,270,417 |
-46% |
|
Volume |
4,406,229,000 |
-13% |
|
NASDAQ |
+12.46 |
13,748.74 |
+0.09% |
|
Advancers |
1,962 |
60% |
|
Advancers |
2,204 |
53% |
|
S&P 500 |
+3.23 |
4,204.11 |
+0.08% |
|
Decliners |
1,314 |
40% |
|
Decliners |
1,942 |
47% |
|
Russell 2000 |
-4.10 |
2,268.97 |
-0.18% |
|
52 Wk Highs |
225 |
|
|
52 Wk Highs |
172 |
|
|
S&P 600 |
-4.19 |
1,371.94 |
-0.30% |
|
52 Wk Lows |
17 |
|
|
52 Wk Lows |
35 |
|
|
 |
Major Indices End Quietly Higher Ahead of Memorial Day Weekend
Kenneth J. Gruneisen - Passed the CAN SLIM® Master's Exam
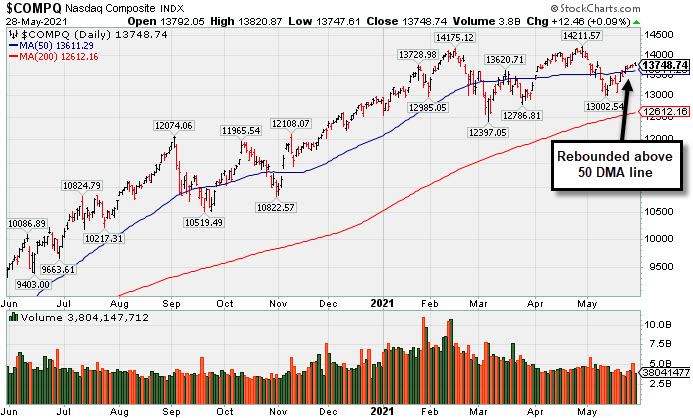
The Dow added 64 points, capping a weekly increase of 0.9% and monthly jump of 1.9%. The S&P 500 rose 0.1%, ending 1.2% higher on the week. The broad index posted its fourth straight monthly gain, its longest winning streak since August (+0.6%). The Nasdaq Composite was up 0.1% on the session, though its 2.1% weekly advance was insufficient to prevent the tech-heavy benchmark from snapping a six-month winning streak that had been its best stretch since January 2018 (-1.5% in May). The small-cap Russell 2000 eked out a monthly gain for an eighth consecutive month, its longest such run since 1995. The volume totals for Friday reported were lighter than the prior session on the NYSE and on the Nasdaq exchange as trading activity calmed ahead of the long Memorial Day weekend. Advancers led decliners by a 3-2 margin on the NYSE and by a narrower margin on the Nasdaq exchange. There were 42 high-ranked companies from the Leaders List that hit new 52-week highs and were listed on the BreakOuts Page, versus 57 on the prior session. New 52-week highs totals again solidly outnumbered new 52-week lows totals on the NYSE and on the Nasdaq exchange. The major indices (M criteria) are still in an uptrend, but that trend has come under pressure in recent weeks. Investors are reminded to always make buying and selling decisions on case-by-case basis under the strict criteria and rules of the fact-based investment system.
PICTURED: The Nasdaq Composite Index recently rebounded above its 50-day moving average (DMA) line.
U.S. stocks finished higher on Friday amid economic optimism. Investors digested President Biden’s first full budget plan, which detailed his goals for $6 trillion in spending during the next fiscal year. On the data front, personal spending increased 0.5% in April, moderating from March's stimulus-fueled 4.7% gain. Separately, the core PCE deflator (the Fed's preferred proxy for inflation) spiked 3.1% year-over-year in April, the biggest jump since 1992. Another release revealed business activity in the Chicago Fed region unexpectedly soared to its highest level since 1973 in May. Additionally, the University of Michigan's gauge of consumer sentiment was upwardly revised this month.
Treasuries strengthened, with the yield on the 10-year note down one basis point to 1.59%. In commodities, WTI crude pared its monthly gain to 4.8%, while COMEX gold rallied 7.7% in May.
In earnings, salesforce.com (CRM +5.43%) rose following upbeat results. Ulta Beauty (ULTA +5.18%) rose after more than doubling consensus profit estimates and lifting its guidance. |
 Kenneth J. Gruneisen started out as a licensed stockbroker in August 1987, a couple of months prior to the historic stock market crash that took the Dow Jones Industrial Average down -22.6% in a single day. He has published daily fact-based fundamental and technical analysis on high-ranked stocks online for two decades. Through FACTBASEDINVESTING.COM, Kenneth provides educational articles, news, market commentary, and other information regarding proven investment systems that work in good times and bad.
Comments contained in the body of this report are technical opinions only and are not necessarily those of Gruneisen Growth Corp. The material herein has been obtained from sources believed to be reliable and accurate, however, its accuracy and completeness cannot be guaranteed. Our firm, employees, and customers may effect transactions, including transactions contrary to any recommendation herein, or have positions in the securities mentioned herein or options with respect thereto. Any recommendation contained in this report may not be suitable for all investors and it is not to be deemed an offer or solicitation on our part with respect to the purchase or sale of any securities. |
|
 |
Broker/Dealer, Semiconductor, and Gold & Silver Indexes Rose
Kenneth J. Gruneisen - Passed the CAN SLIM® Master's Exam
The Broker/Dealer Index ($XBD +1.21%) posted a solid gain while the Bank Index ($BKX -0.17%) and Retail Index ($RLX -0.05%) both ended Friday's session slightly in the red. The tech sector had a positive bias as the Semiconductor Index ($SOX +0.88%) outpaced the Biotech Index ($BTK +0.31%) and Networking Index ($NWX +0.10%). The Gold & Silver Index ($XAU +0.50%) posted a small gain and the Integrated Oil Index ($XOI +0.14%) also inched higher, meanwhile the Oil Services Index ($OSX -0.50%) suffered a small loss. PICTURED: The Gold & Silver Index ($XAU +0.50%) has been holding its ground after recently trading above its 2020 high.
| Oil Services |
$OSX |
61.35 |
-0.31 |
-0.50% |
+38.40% |
| Integrated Oil |
$XOI |
1,082.59 |
+1.51 |
+0.14% |
+36.61% |
| Semiconductor |
$SOX |
3,187.20 |
+27.92 |
+0.88% |
+14.01% |
| Networking |
$NWX |
840.14 |
+0.86 |
+0.10% |
+17.15% |
| Broker/Dealer |
$XBD |
471.84 |
+5.63 |
+1.21% |
+24.96% |
| Retail |
$RLX |
3,798.40 |
-2.03 |
-0.05% |
+6.60% |
| Gold & Silver |
$XAU |
163.96 |
+0.82 |
+0.50% |
+13.71% |
| Bank |
$BKX |
133.62 |
-0.22 |
-0.17% |
+36.47% |
| Biotech |
$BTK |
5,572.71 |
+17.15 |
+0.31% |
-2.90% |
|
|
|
 |
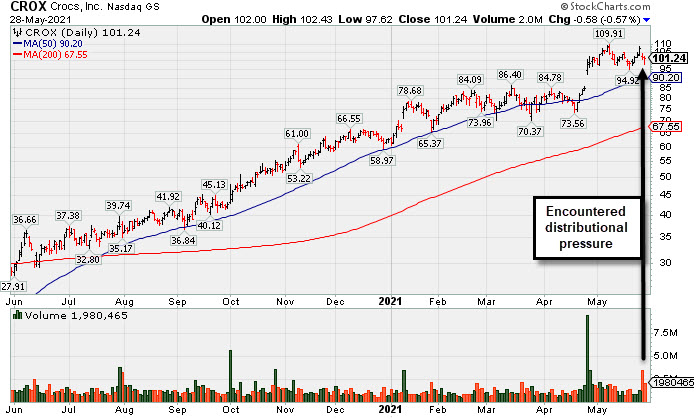
Encountered Distributional Pressure Late This Week
Kenneth J. Gruneisen - Passed the CAN SLIM® Master's Exam
Crocs, Inc (CROX -$0.58 or -0.57% to $101.24) abruptly retreated with higher volume on Thursday and then edged lower Friday after challenging its all-time high with 4 consecutive gains marked by below average volume. Its 50-day moving average (DMA) line ($90.20) defines initial support above prior highs in the $86 area.
CROX was highlighted in yellow in the 4/27/21 mid-day report (read here) with new pivot point cited based on its 3/15/21 high plus 10 cents. It hit new 52-week and all-time highs (N criteria) with a big "breakaway gap" A "breakaway gap" is the one noted exception to the fact-based investment system's rule of not chasing any stock more than 5% above the prior high. However, the risk increases of one being stopped out on an ordinary pullback of 7-8% whenever chasing any stock too far above any sound base pattern.
Bullish action came after it reported Mar '21 quarterly earnings +577% on +64% sales revenues versus the year ago period, its 3rd strong quarterly comparison after some negative comparisons. Annual earnings (A criteria) growth has been strong and steady following losses in FY '15 and '16. CROX has the highest possible Earnings Per Share Rating of 99.
The high-ranked Apparel - Shoes & Rel Mfg firm saw the number of top-rated funds owning its shares rise from 438 in Jun '20 to 587 in Mar '21, a reassuring sign of institutional buying demand (I criteria). Its current Up/Down Volume Ratio of 1.3 is an unbiased indication its shares have been under accumulation over the past 50 days. Its Accumulation/Distribution Rating is C+ and Timeliness Rating is B, and its Sponsorship Rating is C. Its small supply of only 65.4 million shares outstanding can contribute to greater volatility in the event of institutional buying or selling.
|
|
|
Color Codes Explained :
Y - Better candidates highlighted by our
staff of experts.
G - Previously featured
in past reports as yellow but may no longer be buyable under the
guidelines.
***Last / Change / Volume data in this table is the closing quote data***
Symbol/Exchange
Company Name
Industry Group |
PRICE |
CHANGE
(%Change) |
Day High |
Volume
(% DAV)
(% 50 day avg vol) |
52 Wk Hi
% From Hi |
Featured
Date |
Price
Featured |
Pivot Featured |
|
Max Buy |
 ABCB
-
NASDAQ
ABCB
-
NASDAQ
Ameris Bancorp
BANKING - Regional - Mid-Atlantic Banks
|
$54.94
|
-0.15
-0.27% |
$55.58
|
302,032
62.79% of 50 DAV
50 DAV is 481,000
|
$59.85
-8.20%
|
5/21/2021
|
$58.86
|
PP = $57.91
|
|
MB = $60.81
|
 Most Recent Note - 5/28/2021 5:36:22 PM
Y - Abruptly reversed from its high this week and slumped back into the prior base raising concerns. Found support at its 50 DMA line ($53.59). More damaging losses would raise greater concerns and trigger a worrisome technical sell signal.
>>> FEATURED STOCK ARTICLE : Breakout to New All-Time High for Another Regional Bank - 5/21/2021 |
View all notes |
Set NEW NOTE alert |
Company Profile |
SEC
News |
Chart |
Request a new note
C
A
S
I |
SIVB
-
NASDAQ
S V B Financial Group
BANKING - Regional - Pacific Banks
|
$582.89
|
-1.80
-0.31% |
$588.45
|
212,598
40.19% of 50 DAV
50 DAV is 529,000
|
$595.90
-2.18%
|
4/23/2021
|
$579.70
|
PP = $577.16
|
|
MB = $606.02
|
Most Recent Note - 5/25/2021 5:33:56 PM
Y - Hovering in a tight range and stubbornly holding its ground near its all-time high with volume totals cooling. Confirming volume-driven gains are still needed to help clinch a convincing technical buy signal. Its 50 DMA line ($536) defines near-term support to watch. Reported earnings +293% on +64% sales revenues for the Mar '21 quarter versus the year ago period, its 3rd strong comparison. Completed a new Public Offering on 3/24/21.
>>> FEATURED STOCK ARTICLE : Sputtering Since Featured Without Confirming Gains - 5/20/2021 |
View all notes |
Set NEW NOTE alert |
Company Profile |
SEC
News |
Chart |
Request a new note
C
A
S
I |
LOGI
-
NASDAQ
Logitech Intl Sa
COMPUTER HARDWARE - Computer Peripherals
|
$123.10
|
+1.10
0.90% |
$123.73
|
499,578
65.30% of 50 DAV
50 DAV is 765,000
|
$122.10
0.82%
|
5/26/2021
|
$119.13
|
PP = $120.34
|
|
MB = $126.36
|
Most Recent Note - 5/27/2021 5:27:08 PM
Y - Hit a new all-time high with near average volume behind today's gain. Color code was changed to yellow with pivot point cited based on its 2/16/21 high plus 10 cents. Switzerland-based Computer - Hardware/Peripherals firm posted a 10th gain in the span of 11 sessions. Subsequent gains above its pivot point backed by at least +40% above average volume may trigger a technical buy signal. Reported Mar '21 quarterly earnings +245% on +117% sales revenues versus the year ago period, its 4th strong quarter well above the +25% minimum earnings guideline (C criteria). Annual earnings (A criteria) history has been strong. Sequential comparisons show encouraging acceleration in its sales revenues growth rate. See the latest FSU analysis for more details and a new annotated graph.
>>> FEATURED STOCK ARTICLE : Streak of Gains to New Highs Lacked Great Volume Conviction - 5/27/2021 |
View all notes |
Set NEW NOTE alert |
Company Profile |
SEC
News |
Chart |
Request a new note
C
A
S
I |
CROX
-
NASDAQ
Crocs Inc
CONSUMER NON-DURABLES - Textile - Apparel Footwear
|
$101.24
|
-0.58
-0.57% |
$102.43
|
1,980,425
136.96% of 50 DAV
50 DAV is 1,446,000
|
$109.91
-7.89%
|
4/27/2021
|
$99.81
|
PP = $86.50
|
|
MB = $90.83
|
Most Recent Note - 5/28/2021 5:22:08 PM
G - Abruptly retreated with higher volume late this week after challenging its all-time high with 4 consecutive gains marked by below average volume. Its 50 DMA line ($90.20) defines initial support above prior highs in the $86 area. See the latest FSU analysis for more details and new annotated graph.
>>> FEATURED STOCK ARTICLE : Encountered Distributional Pressure Late This Week - 5/28/2021 |
View all notes |
Set NEW NOTE alert |
Company Profile |
SEC
News |
Chart |
Request a new note
C
A
S
I |
RCKY
-
NASDAQ
Rocky Brands Inc
CONSUMER NON-DURABLES - Textile - Apparel Footwear
|
$58.32
|
+0.04
0.07% |
$59.49
|
69,506
70.92% of 50 DAV
50 DAV is 98,000
|
$69.00
-15.48%
|
5/5/2021
|
$61.65
|
PP = $61.55
|
|
MB = $64.63
|
Most Recent Note - 5/26/2021 3:53:02 PM
G - Gapped up today and rebounded above its 50 DMA line ($55.16) helping its outlook improve. Fundamentals remain strong.
>>> FEATURED STOCK ARTICLE : Rocky Brands Powered Higher After Strong Earnings - 5/5/2021 |
View all notes |
Set NEW NOTE alert |
Company Profile |
SEC
News |
Chart |
Request a new note
C
A
S
I |
Symbol/Exchange
Company Name
Industry Group |
PRICE |
CHANGE
(%Change) |
Day High |
Volume
(% DAV)
(% 50 day avg vol) |
52 Wk Hi
% From Hi |
Featured
Date |
Price
Featured |
Pivot Featured |
|
Max Buy |
CRL
-
NYSE
Charles River Labs Intl
DRUGS - Biotechnology
|
$337.99
|
+5.79
1.74% |
$339.76
|
570,425
85.65% of 50 DAV
50 DAV is 666,000
|
$349.13
-3.19%
|
12/17/2020
|
$247.06
|
PP = $257.98
|
|
MB = $270.88
|
Most Recent Note - 5/27/2021 2:23:10 PM
G - Posting a big gain today, consolidating above its 50 DMA line ($315) which defines initial support above the prior high ($303). Reported Mar '21 quarterly earnings +38% on +17%v sales revenues versus the year ago period. Two of the past 3 quarterly comparisons have been above the +25% minimum earnings guideline (C criteria).
>>> FEATURED STOCK ARTICLE : Pulling Back From Record High Following Strong Quarterly Report - 5/6/2021 |
View all notes |
Set NEW NOTE alert |
Company Profile |
SEC
News |
Chart |
Request a new note
C
A
S
I |
CAMT
-
NASDAQ
Camtek Ltd
ELECTRONICS - Scientific and Technical Instrum
|
$36.47
|
+0.97
2.73% |
$36.81
|
309,849
105.75% of 50 DAV
50 DAV is 293,000
|
$36.14
0.91%
|
4/28/2021
|
$35.03
|
PP = $35.34
|
|
MB = $37.11
|
Most Recent Note - 5/28/2021 5:24:17 PM
Y - Hit a new 52-week high today with a gain on average volume. Abruptly rebounded above its 50 DMA line ($31.50) toward the prior high.
>>> FEATURED STOCK ARTICLE : Earnings Acceleration and Perched at High After Ascending Base - 4/28/2021 |
View all notes |
Set NEW NOTE alert |
Company Profile |
SEC
News |
Chart |
Request a new note
C
A
S
I |
ASML
-
NASDAQ
A S M L Holding N.V. NY
ELECTRONICS - Semiconductor Equipment and Mate
|
$675.47
|
+10.38
1.56% |
$675.98
|
609,022
59.19% of 50 DAV
50 DAV is 1,029,000
|
$679.44
-0.58%
|
5/25/2021
|
$669.59
|
PP = $675.75
|
|
MB = $709.54
|
Most Recent Note - 5/28/2021 5:37:48 PM
Y - Managed a best-ever close with today's gain backed by light volume. Highlighted in yellow with pivot point cited based on its 4/26/21 high plus 10 cents. Subsequent gain and a strong close above its pivot point backed by at least +40% above average volume is needed to trigger a proper technical buy signal. Found support at its 50 DMA line ($634) during a 4-week consolidation. Reported Mar '21 quarterly earnings +264% on +90% sales revenues versus the year-ago period. The 4 latest quarterly comparisons were above the +25% minimum earnings guideline (C criteria). Annual earnings history included a small downturn in FY '19. Dutch Electronics - Semiconductor Equipment firm made an impressive rally from a deep slump in March. See the latest FSU analysis for more details and an annotated graph.
>>> FEATURED STOCK ARTICLE : Perched Near All-Time High After Short Base Above 50-Day Average - 5/26/2021 |
View all notes |
Set NEW NOTE alert |
Company Profile |
SEC
News |
Chart |
Request a new note
C
A
S
I |
BRKS
-
NASDAQ
Brooks Automation
ELECTRONICS - Semiconductor Equipment and Mate
|
$102.09
|
+2.28
2.28% |
$103.59
|
508,163
59.57% of 50 DAV
50 DAV is 853,000
|
$108.72
-6.10%
|
4/5/2021
|
$99.31
|
PP = $91.88
|
|
MB = $96.47
|
Most Recent Note - 5/28/2021 5:39:37 PM
G - Posted a 3rd consecutive gain today with light volume and its color code is changed to green after rising above its "max buy" level. Volume totals have been cooling while consolidating above its 50 DMA line ($94) where it found prompt support. More damaging losses below the recent low ($86.12 on 5/12/21) would raise serious concerns.
>>> FEATURED STOCK ARTICLE : Extended From Base and Consolidating After Recent Rally - 4/30/2021 |
View all notes |
Set NEW NOTE alert |
Company Profile |
SEC
News |
Chart |
Request a new note
C
A
S
I |
OPY
-
NYSE
Oppenheimer Holdings Inc
FINANCIAL SERVICES - Investment Brokerage - Regiona
|
$49.97
|
+0.51
1.03% |
$50.03
|
110,167
97.49% of 50 DAV
50 DAV is 113,000
|
$52.45
-4.73%
|
2/25/2021
|
$38.95
|
PP = $38.11
|
|
MB = $40.02
|
Most Recent Note - 5/27/2021 2:32:05 PM
G - Consolidating quietly, still well above its 50 DMA line($45.57) which defines important near-term support, extended from any sound base. Bullish action came after it reported Mar '21 quarterly earnings +402% on +59% sales revenues versus the year ago period.
>>> FEATURED STOCK ARTICLE : Extended From Any Sound Base After Decent Rally - 5/17/2021 |
View all notes |
Set NEW NOTE alert |
Company Profile |
SEC
News |
Chart |
Request a new note
C
A
S
I |
Symbol/Exchange
Company Name
Industry Group |
PRICE |
CHANGE
(%Change) |
Day High |
Volume
(% DAV)
(% 50 day avg vol) |
52 Wk Hi
% From Hi |
Featured
Date |
Price
Featured |
Pivot Featured |
|
Max Buy |
MTH
-
NYSE
Meritage Homes Corp
MATERIALS and CONSTRUCTION - Residential Construction
|
$107.67
|
-0.71
-0.66% |
$109.50
|
253,665
61.98% of 50 DAV
50 DAV is 409,300
|
$120.19
-10.42%
|
5/12/2021
|
$108.84
|
PP = $117.16
|
|
MB = $123.02
|
Most Recent Note - 5/27/2021 2:29:43 PM
Y -Volume totals have still been mostly light while consolidating since hitting a new 52-week high on 5/10/21. Subsequent gains above the pivot point with at least +40% above average volume would be a reassuring confirmation of fresh institutional buying demand. Reported earnings +88% on +20% sales revenues for the Mar '21 quarter versus the year ago period, its 7th consecutive strong quarterly comparison above the +25% minimum guideline (C criteria). Annual earnings (A criteria) history has been strong after a downturn in FY '15.
>>> FEATURED STOCK ARTICLE : Homebuilder Pulled Back After Hitting New High - 5/13/2021 |
View all notes |
Set NEW NOTE alert |
Company Profile |
SEC
News |
Chart |
Request a new note
C
A
S
I |
CRMT
-
NASDAQ
Americas Car-Mart Inc
SPECIALTY RETAIL - Auto Dealerships
|
$164.39
|
-4.78
-2.83% |
$173.57
|
46,787
99.55% of 50 DAV
50 DAV is 47,000
|
$177.45
-7.36%
|
5/25/2021
|
$159.80
|
PP = $165.10
|
|
MB = $173.36
|
Most Recent Note - 5/28/2021 5:28:36 PM
Y - Following a "negative reversal on the prior session at its all-time high it pulled back further today and closed below the pivot point raising some concern. Prior highs define initial support to watch above its 50 DMA line ($151.12).
>>> FEATURED STOCK ARTICLE : Car Dealership Firm Challenging All-Time High - 5/25/2021 |
View all notes |
Set NEW NOTE alert |
Company Profile |
SEC
News |
Chart |
Request a new note
C
A
S
I |
LAD
-
NYSE
Lithia Motors Inc Cl A
SPECIALTY RETAIL - Auto Dealerships
|
$351.99
|
-6.12
-1.71% |
$361.13
|
367,623
94.50% of 50 DAV
50 DAV is 389,000
|
$417.98
-15.79%
|
4/21/2021
|
$377.00
|
PP = $418.08
|
|
MB = $438.98
|
Most Recent Note - 5/26/2021 3:57:24 PM
G - Completed a new Public Offering last week. A rebound above its 50 DMA line ($379) is needed for its outlook to improve. Faces resistance due to overhead supply up to the $417 level.
>>> FEATURED STOCK ARTICLE : Gap Down After Proposing New Public Offering - 5/19/2021 |
View all notes |
Set NEW NOTE alert |
Company Profile |
SEC
News |
Chart |
Request a new note
C
A
S
I |
MED
-
NYSE
Medifast Inc
SPECIALTY RETAIL - Specialty Retail, Other
|
$332.25
|
+1.72
0.52% |
$336.99
|
86,317
70.18% of 50 DAV
50 DAV is 123,000
|
$332.28
-0.01%
|
5/11/2021
|
$285.72
|
PP = $279.56
|
|
MB = $293.54
|
Most Recent Note - 5/27/2021 2:25:48 PM
G - Volume totals are cooling while stubbornly holding its ground, very extended from the previously noted base. Prior highs in the $279 area define initial support to watch on pullbacks.
>>> FEATURED STOCK ARTICLE : Held Ground Following Breakout Gain on Prior Session - 5/11/2021 |
View all notes |
Set NEW NOTE alert |
Company Profile |
SEC
News |
Chart |
Request a new note
C
A
S
I |
CLFD
-
NASDAQ
Clearfield Inc
TELECOMMUNICATIONS - Cables / Satalite Equipment
|
$37.82
|
-0.11
-0.29% |
$38.37
|
66,551
52.82% of 50 DAV
50 DAV is 126,000
|
$40.26
-6.06%
|
4/26/2021
|
$39.68
|
PP = $38.85
|
|
MB = $40.79
|
Most Recent Note - 5/27/2021 2:19:25 PM
Y - Gapped up today for a gain backed by higher volume, but it remains below its previously cited pivot point, consolidating in a choppy fashion. Its 50 DMA line ($33.48) and recent lows which define important near-term support. Fundamentals remain strong after it reported Mar '21 quarterly earnings +440% on +45% sales revenues versus the year ago period, continuing its strong earnings track record.
>>> FEATURED STOCK ARTICLE : Stalled and Found Support Above 50-Day Moving Average - 5/24/2021 |
View all notes |
Set NEW NOTE alert |
Company Profile |
SEC
News |
Chart |
Request a new note
C
A
S
I |
Symbol/Exchange
Company Name
Industry Group |
PRICE |
CHANGE
(%Change) |
Day High |
Volume
(% DAV)
(% 50 day avg vol) |
52 Wk Hi
% From Hi |
Featured
Date |
Price
Featured |
Pivot Featured |
|
Max Buy |
FSBW
-
NASDAQ
F S Bancorp
Banks-West/Southwest
|
$71.18
|
-0.34
-0.48% |
$71.77
|
5,266
37.61% of 50 DAV
50 DAV is 14,000
|
$73.62
-3.31%
|
5/18/2021
|
$70.16
|
PP = $73.72
|
|
MB = $77.41
|
Most Recent Note - 5/26/2021 5:18:32 PM
Y - This thinly-traded Bank is perched within striking distance of the pivot point cited based on its 3/08/21 high plus 10 cents, still consolidating above its 50 DMA line ($68.24) where it found prompt support during its ongoing ascent. Subsequent gains above the pivot point backed by at least +40% above average volume are needed to trigger a technical buy signal. Reported Mar '21 quarterly earnings +137% on +16% sales revenues versus the year ago period, its 4th consecutive strong quarterly comparison above the +25% minimum earnings guideline (C criteria), matching the fact-based investment system's winning models. Its annual earnings (A criteria) history has been great. This thinly traded Bank completed a new Public Offering on 9/08/17.
>>> FEATURED STOCK ARTICLE : Thinly-Traded Bank Consolidating Above 50-Day Moving Average - 5/18/2021 |
View all notes |
Set NEW NOTE alert |
Company Profile |
SEC
News |
Chart |
Request a new note
C
A
S
I |
SMPL
-
NASDAQ
Simply Good Foods Co
Food-Confectionery
|
$34.53
|
+0.09
0.26% |
$34.87
|
373,475
61.13% of 50 DAV
50 DAV is 611,000
|
$35.48
-2.68%
|
12/28/2020
|
$30.40
|
PP = $31.44
|
|
MB = $33.01
|
Most Recent Note - 5/28/2021 5:30:31 PM
G - Quietly touched a new all-time high on the prior session but reversed and ended near the session low. Found prompt support near its 50 DMA line ($32.92). Reported Feb '21 quarterly earnings +9% on +2% sales revenues versus the year ago period, below the +25% minimum earnings guideline (C criteria), raising fundamental concerns. Its current Relative Strength Rating has improved to 84, above the 80+ minimum guideline for buy candidates.
>>> FEATURED STOCK ARTICLE : Hovering Near All-Time High Following Lackluster Quarter - 5/10/2021 |
View all notes |
Set NEW NOTE alert |
Company Profile |
SEC
News |
Chart |
Request a new note
C
A
S
I |
QRVO
-
NASDAQ
"Qorvo, Inc"
ELECTRONICS - Semiconductor - Integrated Cir
|
$182.72
|
-2.42
-1.31% |
$185.50
|
961,995
82.35% of 50 DAV
50 DAV is 1,168,200
|
$201.68
-9.40%
|
4/1/2021
|
$190.48
|
PP = $191.92
|
|
MB = $201.52
|
Most Recent Note - 5/27/2021 2:34:07 PM
G - Today's gain with light volume is challenging its 50 DMA line ($183.78) which may act as resistance. A rebound above the 50 DMA line is needed for its outlook to improve. Its Relative Strength Rating is 70, below the 80+ minimum for buy candidates. Stalled after recently wedging up to new highs from a 9-week base.
>>> FEATURED STOCK ARTICLE : Quiet Gain For Best Ever Close - 4/29/2021 |
View all notes |
Set NEW NOTE alert |
Company Profile |
SEC
News |
Chart |
Request a new note
C
A
S
I |
YETI
-
NYSE
Yeti Holdings Inc
Leisure-Products
|
$87.60
|
-0.20
-0.23% |
$87.91
|
1,131,740
79.14% of 50 DAV
50 DAV is 1,430,000
|
$91.55
-4.31%
|
5/13/2021
|
$84.20
|
PP = $90.65
|
|
MB = $95.18
|
Most Recent Note - 5/28/2021 5:32:42 PM
Y - Hovering near its all-time high with volume totals cooling. Near term support to watch is at its 50 DMA line ($82.39) and prior highs in the $80 area. Reported Mar 21 quarterly earnings +245% on +42% sales revenues versus the year ago period, continuing its strong earnings track record. Previously noted that a valid secondary buy point exists from its 10 WMA line up to 5% above the latest high.
>>> FEATURED STOCK ARTICLE : Hovering Near Record High Following Volume-Driven Gains - 5/3/2021 |
View all notes |
Set NEW NOTE alert |
Company Profile |
SEC
News |
Chart |
Request a new note
C
A
S
I |
MRBK
-
NASDAQ
Meridian Corp
Banks-Northeast
|
$27.07
|
+0.15
0.56% |
$27.66
|
38,272
119.60% of 50 DAV
50 DAV is 32,000
|
$29.18
-7.23%
|
5/18/2021
|
$25.58
|
PP = $28.06
|
|
MB = $29.46
|
Most Recent Note - 5/27/2021 2:28:24 PM
Y - Tested support at its 50 DMA line this week ($26.02) after stalling since reaching a new 52-week high when featured on 5/18/21. Reported Mar '21 earnings +323% on +93% sales revenues versus the year ago period, continuing its strong earnings track record. Recent low ($24.01 on 4/21/21) defines important near-term support where any violation may trigger a worrisome technical sell signal. Its Relative Strength Rating is 80, right at the 80 minimum guideline.
>>> FEATURED STOCK ARTICLE : Bank Consolidating Near 50 Day Moving Average Line - 5/7/2021 |
View all notes |
Set NEW NOTE alert |
Company Profile |
SEC
News |
Chart |
Request a new note
C
A
S
I |
Symbol/Exchange
Company Name
Industry Group |
PRICE |
CHANGE
(%Change) |
Day High |
Volume
(% DAV)
(% 50 day avg vol) |
52 Wk Hi
% From Hi |
Featured
Date |
Price
Featured |
Pivot Featured |
|
Max Buy |
CLAR
-
NASDAQ
Clarus Corporation
Leisure-Products
|
$23.69
|
+0.17
0.72% |
$23.79
|
125,841
72.32% of 50 DAV
50 DAV is 174,000
|
$23.70
-0.04%
|
5/12/2021
|
$21.40
|
PP = $19.73
|
|
MB = $20.72
|
Most Recent Note - 5/26/2021 5:13:34 PM
G - Posted a small gain today with light volume for a best-ever close. Very extended from the previously noted base. Prior high ($19.63 on 3/09/21) defines initial support to watch above its 50 DMA line ($18.76).
>>> FEATURED STOCK ARTICLE : 4 Volume-Driven Gains Into New High Territory - 5/12/2021 |
View all notes |
Set NEW NOTE alert |
Company Profile |
SEC
News |
Chart |
Request a new note
C
A
S
I |
|
|
|
THESE ARE NOT BUY RECOMMENDATIONS!
Comments contained in the body of this report are technical
opinions only. The material herein has been obtained
from sources believed to be reliable and accurate, however,
its accuracy and completeness cannot be guaranteed.
This site is not an investment advisor, hence it does
not endorse or recommend any securities or other investments.
Any recommendation contained in this report may not
be suitable for all investors and it is not to be deemed
an offer or solicitation on our part with respect to
the purchase or sale of any securities. All trademarks,
service marks and trade names appearing in this report
are the property of their respective owners, and are
likewise used for identification purposes only.
This report is a service available
only to active Paid Premium Members.
You may opt-out of receiving report notifications
at any time. Questions or comments may be submitted
by writing to Premium Membership Services 665 S.E. 10 Street, Suite 201 Deerfield Beach, FL 33441-5634 or by calling 1-800-965-8307
or 954-785-1121.
|
|
|