***Last / Change / Volume data in this table is the closing quote data***
Symbol/Exchange
Company Name
Industry Group |
PRICE |
CHANGE
(%Change) |
Day High |
Volume
(% DAV)
(% 50 day avg vol) |
52 Wk Hi
% From Hi |
Featured
Date |
Price
Featured |
Pivot Featured |
|
Max Buy |
OSBC
-
NASDAQ
Old Second Bancorp Inc
BANKING - Regional - Midwest Banks
|
$15.05
|
+0.65
4.51% |
$15.05
|
154,218
200.80% of 50 DAV
50 DAV is 76,800
|
$15.60
-3.53%
|
5/21/2018
|
$15.50
|
PP = $15.10
|
|
MB = $15.86
|
Most Recent Note - 6/28/2018 12:11:59 PM
Y - Near its 50 DMA line ($14.79) with today's gain after 5 consecutive losses marked by above average volume. Its prior low ($14) and 200 DMA line ($13.94) define the next important support level. Stalled after highlighted in yellow on 5/21/18 with pivot point cited based on prior highs plus 10 cents. Fundamentals remain strong.
>>> FEATURED STOCK ARTICLE : Hit New High Today After Orderly Consolidation - 5/21/2018 |
View all notes |
Set NEW NOTE alert |
Company Profile |
SEC
News |
Chart |
Request a new note
C
A
S
I |
PFBC
-
NASDAQ
Preferred Bank Los Angls
BANKING - Regional - Pacific Banks
|
$66.10
|
+4.64
7.55% |
$66.26
|
699,198
910.41% of 50 DAV
50 DAV is 76,800
|
$67.88
-2.62%
|
5/18/2018
|
$62.91
|
PP = $67.75
|
|
MB = $71.14
|
 Most Recent Note - 7/2/2018 12:29:45 PM
G - Color code is changed to yellow after gapping up and rebounding above its 50 DMA line ($64.57) helping its outlook improve. Recent low ($61.14) defines near-term support where more damaging losses would raise serious concerns. Its Relative Strength has slumped to 58.
>>> FEATURED STOCK ARTICLE : Some Technical Sputtering Yet Bank is Still Only -7% Off High - 5/18/2018 |
View all notes |
Set NEW NOTE alert |
Company Profile |
SEC
News |
Chart |
Request a new note
C
A
S
I |
SIVB
-
NASDAQ
S V B Financial Group
BANKING - Regional - Pacific Banks
|
$292.24
|
+3.48
1.21% |
$294.42
|
442,975
80.39% of 50 DAV
50 DAV is 551,000
|
$329.65
-11.35%
|
3/12/2018
|
$267.79
|
PP = $263.19
|
|
MB = $276.35
|
Most Recent Note - 7/2/2018 6:26:23 PM
G - A rebound above the 50 DMA line ($309) is needed for its outlook to improve following damaging volume-driven losses. Fundamentals are strong.
>>> FEATURED STOCK ARTICLE : Wedging Higher Following Big Breakaway Gap - 5/22/2018 |
View all notes |
Set NEW NOTE alert |
Company Profile |
SEC
News |
Chart |
Request a new note
C
A
S
I |
UCFC
-
NASDAQ
United Community Finl Cp
BANKING - Savings and Loans
|
$11.07
|
+0.08
0.73% |
$11.07
|
177,251
99.58% of 50 DAV
50 DAV is 178,000
|
$11.59
-4.49%
|
5/30/2018
|
$10.50
|
PP = $10.80
|
|
MB = $11.34
|
Most Recent Note - 6/28/2018 12:36:22 PM
Y - Consolidating and still well above the prior high ($10.70 on 4/19/18) and its 50 DMA line ($10.64) defining near-term support to watch.
>>> FEATURED STOCK ARTICLE : Small Savings & Loan Perched Near High - 5/30/2018 |
View all notes |
Set NEW NOTE alert |
Company Profile |
SEC
News |
Chart |
Request a new note
C
A
S
I |
EPAM
-
NYSE
Epam Systems Inc
COMPUTER SOFTWARE and SERVICES - Information Technology Service
|
$124.29
|
-0.04
-0.03% |
$124.93
|
466,521
111.08% of 50 DAV
50 DAV is 420,000
|
$131.75
-5.66%
|
5/9/2018
|
$120.34
|
PP = $125.98
|
|
MB = $132.28
|
Most Recent Note - 6/27/2018 6:23:54 PM
G - Color code is changed to green while sputtering below its 50 DMA line ($121.89) after recent weakness negated the prior breakout. More damaging losses would raise serious concerns. See the latest FSU analysis for more details and a new annotated graph.
>>> FEATURED STOCK ARTICLE : Sputtering Below 50-Day Average After Negating Prior Breakout - 6/27/2018 |
View all notes |
Set NEW NOTE alert |
Company Profile |
SEC
News |
Chart |
Request a new note
C
A
S
I |
Symbol/Exchange
Company Name
Industry Group |
PRICE |
CHANGE
(%Change) |
Day High |
Volume
(% DAV)
(% 50 day avg vol) |
52 Wk Hi
% From Hi |
Featured
Date |
Price
Featured |
Pivot Featured |
|
Max Buy |
FLT
-
NYSE
Fleetcor Technologies
DIVERSIFIED SERVICES - Business/Management Services
|
$212.56
|
+1.91
0.91% |
$212.71
|
441,382
34.75% of 50 DAV
50 DAV is 1,270,000
|
$222.92
-4.65%
|
6/18/2018
|
$219.31
|
PP = $213.84
|
|
MB = $224.53
|
Most Recent Note - 6/27/2018 3:35:44 PM
Y - Undercut prior highs and slumped back into the prior base with a streak of 5 consecutive losses raising some concerns. Its 50 DMA line ($206) and prior lows define the next important support areas to watch.
>>> FEATURED STOCK ARTICLE : Breakaway Gap With Heavy Volume - 6/18/2018 |
View all notes |
Set NEW NOTE alert |
Company Profile |
SEC
News |
Chart |
Request a new note
C
A
S
I |
MA
-
NYSE
Mastercard Inc Cl A
Finance-CrdtCard/PmtPr
|
$197.67
|
+1.15
0.59% |
$197.97
|
3,017,960
84.75% of 50 DAV
50 DAV is 3,561,000
|
$204.00
-3.10%
|
5/2/2018
|
$184.96
|
PP = $183.83
|
|
MB = $193.02
|
Most Recent Note - 6/27/2018 3:38:14 PM
G - Pulling back from its all-time high toward its 50 DMA line (191). Below that short-term average the prior low ($186.60 on 5/29/18) defines the next important support to watch.
>>> FEATURED STOCK ARTICLE : Extended From Prior Base and Perched at All-Time High - 6/20/2018 |
View all notes |
Set NEW NOTE alert |
Company Profile |
SEC
News |
Chart |
Request a new note
C
A
S
I |
V
-
NYSE
Visa Inc Cl A
Finance-CrdtCard/PmtPr
|
$132.50
|
+0.05
0.04% |
$133.05
|
7,546,527
103.43% of 50 DAV
50 DAV is 7,296,000
|
$136.69
-3.07%
|
4/26/2018
|
$126.68
|
PP = $126.98
|
|
MB = $133.33
|
Most Recent Note - 7/2/2018 6:29:00 PM
Y - Color code is changed to yellow while consolidating below its "max buy" level. Finding support above its 50 DMA line ($131) and above prior highs in the $126 area.
>>> FEATURED STOCK ARTICLE : Encountered Distributional Pressure at All-Time High - 6/11/2018 |
View all notes |
Set NEW NOTE alert |
Company Profile |
SEC
News |
Chart |
Request a new note
C
A
S
I |
BRKS
-
NASDAQ
Brooks Automation
ELECTRONICS - Semiconductor Equipment and Mate
|
$33.28
|
+0.66
2.02% |
$33.30
|
457,415
66.48% of 50 DAV
50 DAV is 688,000
|
$36.45
-8.70%
|
6/15/2018
|
$35.44
|
PP = $34.87
|
|
MB = $36.61
|
Most Recent Note - 7/2/2018 6:15:00 PM
Y - Posted a gain today with light volume. Stalled after featured in the 6/15/18 mid-day report as it clinched a technical buy signal. Disciplined investors always limit losses by selling any stock that falls more than -7% from their purchase price.
>>> FEATURED STOCK ARTICLE : Volume Was Heavy Behind Big Breakout Gain - 6/15/2018 |
View all notes |
Set NEW NOTE alert |
Company Profile |
SEC
News |
Chart |
Request a new note
C
A
S
I |
ENV
-
NYSE
Envestnet Inc
FINANCIAL SERVICES - Diversified Investments
|
$55.80
|
+0.85
1.55% |
$55.85
|
210,097
57.59% of 50 DAV
50 DAV is 364,800
|
$60.28
-7.42%
|
6/15/2018
|
$57.85
|
PP = $60.37
|
|
MB = $63.39
|
Most Recent Note - 6/28/2018 12:28:13 PM
G - Color code is changed to green after slumping below its 50 DMA line ($55.86) and testing its 200 DMA line ($53.75). A prompt rebound above the 50 DMA line is needed for its outlook to improve.
>>> FEATURED STOCK ARTICLE : Gain With Above Average Volume Challenged Prior High - 6/19/2018 |
View all notes |
Set NEW NOTE alert |
Company Profile |
SEC
News |
Chart |
Request a new note
C
A
S
I |
Symbol/Exchange
Company Name
Industry Group |
PRICE |
CHANGE
(%Change) |
Day High |
Volume
(% DAV)
(% 50 day avg vol) |
52 Wk Hi
% From Hi |
Featured
Date |
Price
Featured |
Pivot Featured |
|
Max Buy |
TPL
-
NYSE
Texas Pacific Land Trust
Real Estate Dvlpmt/Ops
|
$694.95
|
-0.40
-0.06% |
$708.12
|
9,814
49.07% of 50 DAV
50 DAV is 20,000
|
$739.89
-6.07%
|
4/13/2018
|
$547.85
|
PP = $552.10
|
|
MB = $579.71
|
Most Recent Note - 6/28/2018 12:34:52 PM
G - Volume totals have still been cooling while stubbornly holding its ground perched near its all-time high. Its 50 DMA line ($657) defines important support to watch above the prior highs in the $569-552 area.
>>> FEATURED STOCK ARTICLE : Negative Reversal on Higher Volume After Hitting New All-Time High - 6/4/2018 |
View all notes |
Set NEW NOTE alert |
Company Profile |
SEC
News |
Chart |
Request a new note
C
A
S
I |
STMP
-
NASDAQ
Stamps.com Inc
Retail-Internet
|
$256.30
|
+3.25
1.28% |
$256.90
|
177,595
57.66% of 50 DAV
50 DAV is 308,000
|
$285.75
-10.30%
|
5/4/2018
|
$234.15
|
PP = $233.23
|
|
MB = $244.89
|
Most Recent Note - 6/28/2018 6:18:03 PM
G - Halted its slide at its 50 DMA line ($248) after a damaging loss last week. Below that important short-term average prior highs in the $233 area which define support to watch on pullbacks.
>>> FEATURED STOCK ARTICLE : Big Loss on Heavy Volume Tests 50-Day Moving Average - 6/21/2018 |
View all notes |
Set NEW NOTE alert |
Company Profile |
SEC
News |
Chart |
Request a new note
C
A
S
I |
CHDN
-
NASDAQ
Churchill Downs Inc
LEISURE - Gaming Activities
|
$291.75
|
-4.75
-1.60% |
$294.20
|
51,669
50.16% of 50 DAV
50 DAV is 103,000
|
$314.60
-7.26%
|
6/20/2018
|
$285.80
|
PP = $314.70
|
|
MB = $330.44
|
Most Recent Note - 6/29/2018 5:41:17 PM
Y - Quietly consolidating near its 50 DMA line ($291.83) Below that important short-term average the prior high ($285.70 on 4/26/18) defines the next important support to watch. A new pivot point was cited based on its 5/16/18 high plus 10 cents. Subsequent volume-driven gains for a new high are needed to trigger a new (or add-on) technical buy signal. See the latest FSU analysis for more details and a new annotated graph.
>>> FEATURED STOCK ARTICLE : Consolidating Near 50-Day Moving Average - 6/29/2018 |
View all notes |
Set NEW NOTE alert |
Company Profile |
SEC
News |
Chart |
Request a new note
C
A
S
I |
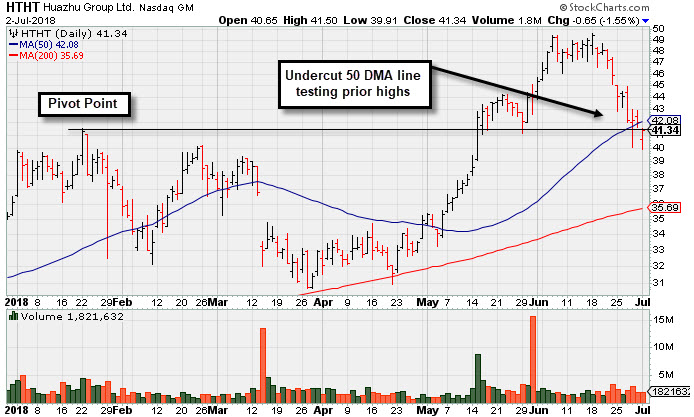
HTHT
-
NASDAQ
Huazhu Group Ads
LEISURE - Lodging
|
$41.34
|
-0.65
-1.55% |
$41.50
|
1,821,632
78.62% of 50 DAV
50 DAV is 2,317,000
|
$49.60
-16.65%
|
5/15/2018
|
$34.52
|
PP = $41.57
|
|
MB = $43.65
|
Most Recent Note - 7/2/2018 6:20:40 PM
G - Undercut its 50 DMA line ($42.08) today while testing prior highs in the $40-41 area. Recently changed its name from China Lodging Group, Ltd to Huazhu Group Ltd. See the latest FSU analysis for more details and a new annotated graph.
>>> FEATURED STOCK ARTICLE : At Prior High and Slumping Below 50-Day Average After 4:1 Split - 7/2/2018 |
View all notes |
Set NEW NOTE alert |
Company Profile |
SEC
News |
Chart |
Request a new note
C
A
S
I |
NFLX
-
NASDAQ
Netflix Inc
SPECIALTY RETAIL - Music and Video Stores
|
$398.18
|
+6.75
1.72% |
$398.38
|
8,121,040
89.16% of 50 DAV
50 DAV is 9,108,000
|
$423.21
-5.91%
|
5/24/2018
|
$348.85
|
PP = $338.92
|
|
MB = $355.87
|
Most Recent Note - 6/29/2018 12:15:50 PM
G - Extended from any sound base and recently enduring distributional pressure. Its 50 DMA line ($351) defines near-term support to watch above the prior high ($338.82 on 4/18/18).
>>> FEATURED STOCK ARTICLE : Rally From Advanced Ascending Base With Volume +50% - 5/24/2018 |
View all notes |
Set NEW NOTE alert |
Company Profile |
SEC
News |
Chart |
Request a new note
C
A
S
I |
Symbol/Exchange
Company Name
Industry Group |
PRICE |
CHANGE
(%Change) |
Day High |
Volume
(% DAV)
(% 50 day avg vol) |
52 Wk Hi
% From Hi |
Featured
Date |
Price
Featured |
Pivot Featured |
|
Max Buy |
DPZ
-
NYSE
Dominos Pizza Inc
Retail-Restaurants
|
$281.00
|
-1.17
-0.41% |
$281.38
|
496,071
80.66% of 50 DAV
50 DAV is 615,000
|
$293.81
-4.36%
|
5/21/2018
|
$248.13
|
PP = $255.10
|
|
MB = $267.86
|
Most Recent Note - 7/2/2018 6:31:07 PM
G - Volume totals have been cooling. It is still very extended from the latest base. Its 50 DMA line ($259.83) and prior high ($255 on 4/26/18) define near-term support to watch.
>>> FEATURED STOCK ARTICLE : New High With Gain Backed by Above Average Volume - 6/5/2018 |
View all notes |
Set NEW NOTE alert |
Company Profile |
SEC
News |
Chart |
Request a new note
C
A
S
I |
FIVE
-
NASDAQ
Five Below Inc
Retail-DiscountandVariety
|
$97.77
|
+0.06
0.06% |
$98.12
|
831,352
57.22% of 50 DAV
50 DAV is 1,453,000
|
$103.99
-5.98%
|
6/4/2018
|
$75.96
|
PP = $78.38
|
|
MB = $82.30
|
Most Recent Note - 6/28/2018 3:57:23 PM
G - Volume totals have still been cooling while stubbornly holding its ground near its all-time high. Reported earnings +133% on +27% sales revenues for the Apr '18 quarter.
>>> FEATURED STOCK ARTICLE : Hovering Near Record High After Big Gap Up and Volume-Driven Gain - 6/25/2018 |
View all notes |
Set NEW NOTE alert |
Company Profile |
SEC
News |
Chart |
Request a new note
C
A
S
I |
NOW
-
NYSE
Servicenow Inc
Computer Sftwr-Enterprse
|
$177.60
|
+5.13
2.97% |
$177.69
|
1,672,099
90.24% of 50 DAV
50 DAV is 1,853,000
|
$188.59
-5.83%
|
5/8/2018
|
$174.63
|
PP = $176.66
|
|
MB = $185.49
|
Most Recent Note - 7/2/2018 6:24:30 PM
Y - Color code is changed to yellow after a rebound above the 50 DMA line ($175) helped its outlook improve. The recent low ($167) defines important near-term support.
>>> FEATURED STOCK ARTICLE : Recent Slump Below 50-Day Average Hurt Outlook - 6/26/2018 |
View all notes |
Set NEW NOTE alert |
Company Profile |
SEC
News |
Chart |
Request a new note
C
A
S
I |
NVEE
-
NASDAQ
N V 5 Global Inc
Comml Svcs-Consulting
|
$69.40
|
+0.10
0.14% |
$70.60
|
104,464
139.29% of 50 DAV
50 DAV is 75,000
|
$71.90
-3.48%
|
6/15/2018
|
$7,070.00
|
PP = $72.00
|
|
MB = $75.60
|
Most Recent Note - 6/28/2018 6:16:18 PM
Y - Volume totals have been cooling while stubbornly holding its ground in a tight range perched near its all-time high. Confirming gains above the pivot point backed by at least +40% above average volume may trigger a technical buy signal. Its 50 DMA line ($63.07) defines near-term support above the prior low ($56.65 on 5/15/18). See the latest FSU analysis for more details and a new annotated graph.
>>> FEATURED STOCK ARTICLE : Holding its Ground in Tight Range Near All-Time High - 6/28/2018 |
View all notes |
Set NEW NOTE alert |
Company Profile |
SEC
News |
Chart |
Request a new note
C
A
S
I |
PANW
-
NYSE
Palo Alto Networks
Computer Sftwr-Security
|
$209.44
|
+3.97
1.93% |
$209.73
|
884,631
65.58% of 50 DAV
50 DAV is 1,349,000
|
$217.40
-3.66%
|
6/12/2018
|
$206.55
|
PP = $214.69
|
|
MB = $225.42
|
Most Recent Note - 6/27/2018 3:41:03 PM
Y - Quietly sputtering below its 50 DMA line ($202.55) today raising some concerns. The prior low ($195.78 on 6/07/18) defines the next important support level.
>>> FEATURED STOCK ARTICLE : New High Close After 2 Consecutive Volume Driven Gains - 6/13/2018 |
View all notes |
Set NEW NOTE alert |
Company Profile |
SEC
News |
Chart |
Request a new note
C
A
S
I |
Symbol/Exchange
Company Name
Industry Group |
PRICE |
CHANGE
(%Change) |
Day High |
Volume
(% DAV)
(% 50 day avg vol) |
52 Wk Hi
% From Hi |
Featured
Date |
Price
Featured |
Pivot Featured |
|
Max Buy |
QLYS
-
NASDAQ
Qualys Inc
Computer Sftwr-Security
|
$85.90
|
+1.60
1.90% |
$85.95
|
232,711
64.28% of 50 DAV
50 DAV is 362,000
|
$97.75
-12.12%
|
4/17/2018
|
$82.85
|
PP = $79.50
|
|
MB = $83.48
|
Most Recent Note - 6/27/2018 3:21:06 PM
G - Pulling back today near the prior high ($85.00 on 4/18/18) which defines initial support above its 50 DMA line ($81.26).
>>> FEATURED STOCK ARTICLE : Rebounded Above 50-Day Average Yet Still Faces Overhead Supply - 5/29/2018 |
View all notes |
Set NEW NOTE alert |
Company Profile |
SEC
News |
Chart |
Request a new note
C
A
S
I |
SPLK
-
NASDAQ
Splunk Inc
Computer Sftwr-Database
|
$100.71
|
+1.60
1.61% |
$101.09
|
1,370,797
73.42% of 50 DAV
50 DAV is 1,867,000
|
$121.64
-17.21%
|
5/8/2018
|
$113.14
|
PP = $112.76
|
|
MB = $118.40
|
Most Recent Note - 6/27/2018 3:13:20 PM
G - Slumping near prior lows in the $96-97 area which define near-term support above its 200 DMA line ($90.77). Damaging losses triggered technical sell signals. Only a prompt rebound above the 50 DMA line (110.88) would help its outlook improve.
>>> FEATURED STOCK ARTICLE : Consolidating Near High Following Latest Financial Report - 5/31/2018 |
View all notes |
Set NEW NOTE alert |
Company Profile |
SEC
News |
Chart |
Request a new note
C
A
S
I |
SUPN
-
NASDAQ
Supernus Pharmaceuticals
Medical-Biomed/Biotech
|
$56.55
|
-3.30
-5.51% |
$59.75
|
941,894
113.21% of 50 DAV
50 DAV is 832,000
|
$61.25
-7.67%
|
6/20/2018
|
$58.05
|
PP = $59.15
|
|
MB = $62.11
|
Most Recent Note - 7/2/2018 6:33:08 PM
Y - Abruptly retreated from its all-time high with a big loss today on average volume. A gain and strong close above the pivot point backed by at least +40% above average volume may trigger a new (or add-on) technical buy signal. Its 50 DMA line ($53.65) and prior low in the $53 area define near-term support to watch on pullbacks.
>>> FEATURED STOCK ARTICLE : Extended From Prior Base After Spiking Higher - 6/6/2018 |
View all notes |
Set NEW NOTE alert |
Company Profile |
SEC
News |
Chart |
Request a new note
C
A
S
I |
PAYC
-
NYSE
Paycom Software Inc
COMPUTER SOFTWARE and SERVICES - Application Software
|
$101.24
|
+2.41
2.44% |
$101.35
|
630,950
70.97% of 50 DAV
50 DAV is 889,000
|
$118.45
-14.53%
|
6/19/2018
|
$113.68
|
PP = $118.55
|
|
MB = $124.48
|
Most Recent Note - 6/27/2018 3:44:12 PM
G - Today's big loss is undercutting the prior low ($98.01 on 5/23/18) triggering a technical sell signal. A prompt rebound above the 50 DMA line ($107.81) is needed for its outlook to improve. Its 200 DMA line ($93.24) is the next important support level.
>>> FEATURED STOCK ARTICLE : Slumped Below 50-Day Moving Average With Heavy Volume - 6/22/2018 |
View all notes |
Set NEW NOTE alert |
Company Profile |
SEC
News |
Chart |
Request a new note
C
A
S
I |
GRUB
-
NYSE
Grubhub Inc
INTERNET - Content
|
$106.60
|
+1.69
1.61% |
$107.21
|
1,384,020
79.31% of 50 DAV
50 DAV is 1,745,000
|
$120.07
-11.22%
|
5/30/2018
|
$107.56
|
PP = $105.68
|
|
MB = $110.96
|
Most Recent Note - 7/2/2018 6:18:25 PM
Y - Color code is changed to yellow as it posted a gain today with light volume and finished above its 50 DMA line ($104.81). Recent lows in the $101 area define important near-term support to watch.
>>> FEATURED STOCK ARTICLE : Gain With +25% Above Average Volume for Best Ever Close - 6/12/2018 |
View all notes |
Set NEW NOTE alert |
Company Profile |
SEC
News |
Chart |
Request a new note
C
A
S
I |
Symbol/Exchange
Company Name
Industry Group |
PRICE |
CHANGE
(%Change) |
Day High |
Volume
(% DAV)
(% 50 day avg vol) |
52 Wk Hi
% From Hi |
Featured
Date |
Price
Featured |
Pivot Featured |
|
Max Buy |
HQY
-
NASDAQ
Healthequity Inc
COMPUTER SOFTWARE and SERVICES - Healthcare Information Service
|
$77.07
|
+1.97
2.62% |
$77.13
|
635,328
117.65% of 50 DAV
50 DAV is 540,000
|
$82.04
-6.06%
|
5/2/2018
|
$66.31
|
PP = $68.85
|
|
MB = $72.29
|
Most Recent Note - 6/28/2018 3:47:27 PM
G - Undercut its 50 DMA line ($73.89) with today's early loss but found prompt support and managed a "positive reversal". More damaging losses would raise greater concerns and the prior high ($68.75 on 3/22/18) defines near term support to watch on pullbacks.
>>> FEATURED STOCK ARTICLE : Pullback After Volume-Driven Gains For New Highs - 6/7/2018 |
View all notes |
Set NEW NOTE alert |
Company Profile |
SEC
News |
Chart |
Request a new note
C
A
S
I |
LOB
-
NASDAQ
Live Oak Bancshares Inc
Banks-Southeast
|
$31.15
|
+0.50
1.63% |
$31.25
|
194,889
155.91% of 50 DAV
50 DAV is 125,000
|
$31.65
-1.58%
|
5/21/2018
|
$29.35
|
PP = $30.15
|
|
MB = $31.66
|
Most Recent Note - 6/28/2018 12:30:35 PM
Y - Still holding its ground near the previously cited pivot point. Near term support to watch is at its 50 DMA line ($29.50).
>>> FEATURED STOCK ARTICLE : Bank Perched Near High After Orderly Base - 5/23/2018 |
View all notes |
Set NEW NOTE alert |
Company Profile |
SEC
News |
Chart |
Request a new note
C
A
S
I |
PYPL
-
NASDAQ
Paypal Holdings Inc
Finance-CrdtCard/PmtPr
|
$83.89
|
+0.62
0.74% |
$83.96
|
4,925,757
59.47% of 50 DAV
50 DAV is 8,283,000
|
$87.55
-4.18%
|
5/18/2018
|
$81.63
|
PP = $80.89
|
|
MB = $84.93
|
Most Recent Note - 6/28/2018 12:41:49 PM
Y - Pulled back from its all-time high testing its 50 DMA line ($80.39). Since first featured on 5/18/18 it has not flashed confirming gains above the pivot point backed by at least +40% above average volume to confirm a proper technical buy signal.
>>> FEATURED STOCK ARTICLE : Gains Have Lacked Volume While Approaching All-Time High - 6/8/2018 |
View all notes |
Set NEW NOTE alert |
Company Profile |
SEC
News |
Chart |
Request a new note
C
A
S
I |
OLLI
-
NASDAQ
Ollie's Bargain Outlet
Retail-DiscountandVariety
|
$70.65
|
-1.85
-2.55% |
$72.25
|
1,188,139
137.20% of 50 DAV
50 DAV is 866,000
|
$77.50
-8.84%
|
4/10/2018
|
$62.05
|
PP = $62.15
|
|
MB = $65.26
|
Most Recent Note - 6/28/2018 12:39:10 PM
G - Very extended from any sound base. Its 50 DMA line ($69.18) defines important near-term support to watch on pullbacks.
>>> FEATURED STOCK ARTICLE : Extended From Prior Base After 8 Consecutive Gains - 5/17/2018 |
View all notes |
Set NEW NOTE alert |
Company Profile |
SEC
News |
Chart |
Request a new note
C
A
S
I |
MOMO
-
NASDAQ
Momo Inc Ads Cl A
INTERNET - Content
|
$44.72
|
+1.22
2.80% |
$44.93
|
4,814,927
99.61% of 50 DAV
50 DAV is 4,834,000
|
$54.24
-17.55%
|
6/1/2018
|
$48.62
|
PP = $46.79
|
|
MB = $49.13
|
Most Recent Note - 6/27/2018 3:08:58 PM
Y - Testing its 50 DMA line ($42.70) today. Slumped below prior the high ($46.69 on 8/08/17) and back into the prior base with damaging volume-driven losses this week raising concerns.
>>> FEATURED STOCK ARTICLE : Volume-Driven Gain for New All-Time High - 6/1/2018 |
View all notes |
Set NEW NOTE alert |
Company Profile |
SEC
News |
Chart |
Request a new note
C
A
S
I |
Symbol/Exchange
Company Name
Industry Group |
PRICE |
CHANGE
(%Change) |
Day High |
Volume
(% DAV)
(% 50 day avg vol) |
52 Wk Hi
% From Hi |
Featured
Date |
Price
Featured |
Pivot Featured |
|
Max Buy |
NOVT
-
NASDAQ
Novanta Inc
Elec-Scientific/Msrng
|
$63.10
|
+0.80
1.28% |
$63.15
|
104,907
48.57% of 50 DAV
50 DAV is 216,000
|
$68.00
-7.21%
|
4/17/2018
|
$60.55
|
PP = $60.40
|
|
MB = $63.42
|
Most Recent Note - 7/2/2018 6:22:58 PM
Y - Color code is changed to yellow after a gain on light volume rebounding above the 50 DMA line ($62.85) helped its outlook improve. The recent low ($59.25) defines important near-term support.
>>> FEATURED STOCK ARTICLE : Quietly Hovering Near All-Time High - 5/25/2018 |
View all notes |
Set NEW NOTE alert |
Company Profile |
SEC
News |
Chart |
Request a new note
C
A
S
I |
BZUN
-
NASDAQ
Baozun Inc Cl A Ads
Computer Sftwr-Enterprse
|
$55.75
|
+1.05
1.92% |
$55.98
|
1,732,168
67.48% of 50 DAV
50 DAV is 2,567,000
|
$67.41
-17.30%
|
5/15/2018
|
$45.38
|
PP = $52.43
|
|
MB = $55.05
|
Most Recent Note - 6/27/2018 3:05:41 PM
G - Violating its 50 DMA line ($54.39) today with another damaging volume-driven loss triggering a technical sell signal. Testing prior highs in the $52 area previously noted as the next important support to watch. A prompt rebound above its 50 DMA line is needed for its outlook to improve.
>>> FEATURED STOCK ARTICLE : Earnings News Due; Formed a Base-on-Base Pattern - 5/16/2018 |
View all notes |
Set NEW NOTE alert |
Company Profile |
SEC
News |
Chart |
Request a new note
C
A
S
I |
SEND
-
NYSE
Sendgrid Inc
INTERNET - Content
|
$26.48
|
-0.04
-0.15% |
$27.17
|
355,374
61.38% of 50 DAV
50 DAV is 579,000
|
$32.03
-17.32%
|
6/20/2018
|
$30.72
|
PP = $32.13
|
|
MB = $33.74
|
Most Recent Note - 6/27/2018 3:24:20 PM
G - Color code is changed to green while slumping below its 50 DMA line ($27.34) with today's loss on light volume. A prompt rebound above the 50 DMA line is needed for its outlook to improve. Abruptly retreated after challenging its 52-week high this week with impressive volume-driven gains. New pivot point cited was based on its 3/12/18 high plus 10 cents. Subsequent gains above the pivot point backed by at least +40% above average volume are still needed to trigger a proper new (or add-on) technical buy signal. Recent lows in the $23-24 area define important support to watch. Showed resilience since it completed a new Public Offering and Secondary Offering on 4/05/18.
>>> FEATURED STOCK ARTICLE : Volume-Driven Gains Above 50-Day Average Help Outlook Improve - 6/14/2018 |
View all notes |
Set NEW NOTE alert |
Company Profile |
SEC
News |
Chart |
Request a new note
C
A
S
I |