***Last / Change / Volume data in this table is the closing quote data***
Symbol/Exchange
Company Name
Industry Group |
PRICE |
CHANGE
(%Change) |
Day High |
Volume
(% DAV)
(% 50 day avg vol) |
52 Wk Hi
% From Hi |
Featured
Date |
Price
Featured |
Pivot Featured |
|
Max Buy |
THO
-
NYSE
Thor Industries Inc
AUTOMOTIVE - Recreational Vehicles
|
$104.01
|
-11.41
-9.89% |
$111.00
|
4,022,224
819.19% of 50 DAV
50 DAV is 491,000
|
$115.74
-10.13%
|
1/24/2017
|
$100.52
|
PP = $108.45
|
|
MB = $113.87
|
 Most Recent Note - 3/7/2017 12:40:39 PM
G - Reported earnings +27% on +63% sales revenues for the Jan '17 quarter, continuing its strong earnings track record. Color code is changed to green after gapping down and violating prior highs in the $108 area and also undercutting its 50 DMA line ($105.67). Only a prompt rebound above the 50 DMA line would help its outlook improve.
>>> FEATURED STOCK ARTICLE : Rose From Support at 50-Day Moving Average Line - 1/24/2017 |
View all notes |
Set NEW NOTE alert |
Company Profile |
SEC
News |
Chart |
Request a new note
C
A
S
I |
SBCF
-
NASDAQ
Seacoast Banking Corp Fl
BANKING - Regional - Mid-Atlantic Banks
|
$23.70
|
-0.03
-0.13% |
$23.93
|
214,703
57.72% of 50 DAV
50 DAV is 372,000
|
$25.13
-5.69%
|
2/13/2017
|
$24.84
|
PP = $23.10
|
|
MB = $24.26
|
Most Recent Note - 3/6/2017 7:07:31 PM
Y - Still holding its ground above its pivot point, consolidating after its gap up and big volume-driven gain on 2/13/17 clinched a technical buy signal. Completed a new Public Offering on 2/15/17. Prior highs and its 50 DMA line in the $23 area define important near-term support to watch.
>>> FEATURED STOCK ARTICLE : Gap Up Gain and Strong Finish Triggered Technical Buy Signal - 2/13/2017 |
View all notes |
Set NEW NOTE alert |
Company Profile |
SEC
News |
Chart |
Request a new note
C
A
S
I |
CSFL
-
NASDAQ
Centerstate Banks Inc
Banks-Southeast
|
$25.42
|
-0.04
-0.16% |
$25.64
|
250,046
91.93% of 50 DAV
50 DAV is 272,000
|
$26.30
-3.35%
|
10/10/2016
|
$18.20
|
PP = $18.37
|
|
MB = $19.29
|
Most Recent Note - 3/6/2017 6:54:39 PM
G - Consolidating above its 50 DMA line ($25). Recent low ($23.80 on 2/08/17) defines important near-term support where further deterioration would trigger a technical sell signal. Completed a new Public Offering of shares on 1/10/17.
>>> FEATURED STOCK ARTICLE : Found Support Near 50-Day Average Following Offering - 2/6/2017 |
View all notes |
Set NEW NOTE alert |
Company Profile |
SEC
News |
Chart |
Request a new note
C
A
S
I |
IESC
-
NASDAQ
Integrated Electric Svcs
Bldg-Maintenance and Svc
|
$18.85
|
+0.10
0.53% |
$18.95
|
60,958
115.45% of 50 DAV
50 DAV is 52,800
|
$23.00
-18.04%
|
11/23/2016
|
$19.35
|
PP = $18.26
|
|
MB = $19.17
|
Most Recent Note - 3/6/2017 7:01:23 PM
G - Consolidating below its 50 DMA line ($19.55). Its Relative Strength rating of 64 is now below the 80+ minimum guideline for buy candidates. Prior low ($18.05 on 1/18/17) defines important support near prior highs. Recently reported Dec '16 quarterly earnings -33% on +27% sales revenues, below the +25% minimum earnings guideline (C criteria), raising fundamental concerns. See the latest FSU analysis for more details and an annotated graph.
>>> FEATURED STOCK ARTICLE : Recent Low Defines Support Near Prior Highs - 3/3/2017 |
View all notes |
Set NEW NOTE alert |
Company Profile |
SEC
News |
Chart |
Request a new note
C
A
S
I |
NSP
-
NYSE
Insperity Inc
Comml Svcs-Outsourcing
|
$86.90
|
+0.95
1.11% |
$87.05
|
126,467
84.31% of 50 DAV
50 DAV is 150,000
|
$87.10
-0.23%
|
2/14/2017
|
$84.30
|
PP = $82.28
|
|
MB = $86.39
|
Most Recent Note - 3/3/2017 4:09:40 PM
G - Near average volume was behind today's 5th consecutive gain as it wedged above its "max buy" level to a new 52-week high, and its color code is changed to green. The recent low ($79.97 on 2/24/17) defines important near-term support.
>>> FEATURED STOCK ARTICLE : Big Volume-Driven Gains Indicative of Institutional Demand - 2/14/2017 |
View all notes |
Set NEW NOTE alert |
Company Profile |
SEC
News |
Chart |
Request a new note
C
A
S
I |
Symbol/Exchange
Company Name
Industry Group |
PRICE |
CHANGE
(%Change) |
Day High |
Volume
(% DAV)
(% 50 day avg vol) |
52 Wk Hi
% From Hi |
Featured
Date |
Price
Featured |
Pivot Featured |
|
Max Buy |
BERY
-
NYSE
Berry Plastics Group Inc
CONSUMER NON-DURABLES - Packaging and Containers
|
$49.48
|
-0.88
-1.75% |
$50.45
|
1,087,756
94.10% of 50 DAV
50 DAV is 1,156,000
|
$52.97
-6.59%
|
11/30/2016
|
$50.26
|
PP = $46.47
|
|
MB = $48.79
|
Most Recent Note - 3/6/2017 6:53:43 PM
G - Relative Strength Rating is 82, just above the 80+ minimum for buy candidates under the fact-based investment system, and it has been consolidating near its 50 DMA line. Recent lows in the $48.50 area define near-term support. Damaging losses and violations would trigger a more worrisome technical sell signal. Reported earnings +43% on -7% sales revenues for the Dec '16 quarter.
>>> FEATURED STOCK ARTICLE : Recent 50-Day Violation Raised Concerns - 2/7/2017 |
View all notes |
Set NEW NOTE alert |
Company Profile |
SEC
News |
Chart |
Request a new note
C
A
S
I |
EVR
-
NYSE
Evercore Partners Inc
FINANCIAL SERVICES - Investment Banking
|
$81.00
|
-0.35
-0.43% |
$81.90
|
377,855
90.83% of 50 DAV
50 DAV is 416,000
|
$82.29
-1.56%
|
1/5/2017
|
$71.40
|
PP = $72.07
|
|
MB = $75.67
|
Most Recent Note - 3/6/2017 6:56:37 PM
G - Still holding its ground stubbornly, extended from its prior base. Its 50 DMA line and prior low ($74.75 on 2/08/17) define near-term support to watch. Recently reported Dec '16 quarterly earnings +17% on +9% sales revenues, below the +25% minimum earnings guideline (C criteria), raising fundamental concerns.
>>> FEATURED STOCK ARTICLE : Holding Ground After Latest Earnings Were Below +25% Guideline - 2/17/2017 |
View all notes |
Set NEW NOTE alert |
Company Profile |
SEC
News |
Chart |
Request a new note
C
A
S
I |
NTES
-
NASDAQ
Netease Inc Adr
INTERNET - Internet Information Providers
|
$292.08
|
-0.20
-0.07% |
$294.50
|
905,083
79.18% of 50 DAV
50 DAV is 1,143,000
|
$308.66
-5.37%
|
2/10/2017
|
$259.30
|
PP = $272.68
|
|
MB = $286.31
|
Most Recent Note - 3/2/2017 12:14:12 PM
G - Pulling back from all-time highs. It is extended from its prior base following a "breakaway gap" and additional volume-driven gains. Prior highs in the $272 area define initial support to watch on pullbacks.
>>> FEATURED STOCK ARTICLE : Rebounding With Earnings News Due Soon - 2/10/2017 |
View all notes |
Set NEW NOTE alert |
Company Profile |
SEC
News |
Chart |
Request a new note
C
A
S
I |
STMP
-
NASDAQ
Stamps.com Inc
INTERNET - Internet Software and Services
|
$127.55
|
+0.80
0.63% |
$128.65
|
196,496
82.22% of 50 DAV
50 DAV is 239,000
|
$136.00
-6.21%
|
2/16/2017
|
$129.45
|
PP = $123.85
|
|
MB = $130.04
|
Most Recent Note - 3/2/2017 12:18:09 PM
G - Halted its slide at its 50 DMA line ($121.62) after damaging distributional pressure. Its color code was changed to green after undercutting prior highs. Further deterioration would trigger more worrisome technical sell signals.
>>> FEATURED STOCK ARTICLE : Recent Gains Have Lacked Heavy Volume Indicative of Accumulation - 2/16/2017 |
View all notes |
Set NEW NOTE alert |
Company Profile |
SEC
News |
Chart |
Request a new note
C
A
S
I |
HTHT
-
NASDAQ
China Lodging Group Ads
LEISURE - Lodging
|
$58.33
|
+1.00
1.74% |
$59.23
|
66,588
51.62% of 50 DAV
50 DAV is 129,000
|
$60.92
-4.25%
|
9/29/2016
|
$46.12
|
PP = $47.82
|
|
MB = $50.21
|
Most Recent Note - 3/6/2017 6:58:53 PM
G - Pulled back from its all-time high with another loss today backed by above average volume. The recent low ($53.12 on 2/15/17) and its 50 DMA line ($53.12) coincide defining important near-term support to watch. Repeatedly noted with caution in prior reports - "Reported earnings +10% on +6% sales revenues for the Sep '16 quarter, below the +25% minimum earnings guideline (C criteria), raising concerns."
>>> FEATURED STOCK ARTICLE : Mostly Bullish Action Continues Since Latest Earnings Report - 2/9/2017 |
View all notes |
Set NEW NOTE alert |
Company Profile |
SEC
News |
Chart |
Request a new note
C
A
S
I |
Symbol/Exchange
Company Name
Industry Group |
PRICE |
CHANGE
(%Change) |
Day High |
Volume
(% DAV)
(% 50 day avg vol) |
52 Wk Hi
% From Hi |
Featured
Date |
Price
Featured |
Pivot Featured |
|
Max Buy |
BEAT
-
NASDAQ
BioTelemetry Inc
Medical-Services
|
$25.55
|
-0.20
-0.78% |
$25.80
|
189,477
61.92% of 50 DAV
50 DAV is 306,000
|
$27.30
-6.41%
|
2/14/2017
|
$25.10
|
PP = $24.55
|
|
MB = $25.78
|
Most Recent Note - 3/6/2017 6:52:43 PM
G - Hovering near its "max buy" level with volume totals cooling. Prior highs in the $24 area and its 50 DMA line ($23.58) define important near-term support.
>>> FEATURED STOCK ARTICLE : Perched Near All-Time High With Earnings Report Due - 2/21/2017 |
View all notes |
Set NEW NOTE alert |
Company Profile |
SEC
News |
Chart |
Request a new note
C
A
S
I |
ULTA
-
NASDAQ
Ulta Beauty Inc
SPECIALTY RETAIL - Specialty Retail, Other
|
$269.92
|
-5.67
-2.06% |
$275.16
|
1,620,574
299.00% of 50 DAV
50 DAV is 542,000
|
$281.17
-4.00%
|
3/6/2017
|
$274.96
|
PP = $278.73
|
|
MB = $292.67
|
Most Recent Note - 3/7/2017 4:52:55 PM
Y - Encountering distributional pressure on the past 2 sessions while pulling back near its 50 DMA line ($268.24). Highlighted in yellow in the 3/06/17 mid-day report with new pivot point cited based on its 8/24/16 high plus 10 cents. Perched at its all-time high, it was noted - "A volume-driven gain for new highs may trigger a new technical buy signal. Due to report Jan '17 quarterly earnings on 3/09/17, and volume and volatility often increase near earnings news. Reported earnings +26% on +24% sales revenues for the Oct '16 quarter. Prior earnings history satisfied the C and A criteria." See the latest FSU analysis for more details and an annotated graph.
>>> FEATURED STOCK ARTICLE : Earnings News Due as Good Looking Candidate Hovers Near Highs - 3/6/2017 |
View all notes |
Set NEW NOTE alert |
Company Profile |
SEC
News |
Chart |
Request a new note
C
A
S
I |
PATK
-
NASDAQ
Patrick Industries Inc
WHOLESALE - Building Materials Wholesale
|
$76.60
|
-4.35
-5.37% |
$79.90
|
176,968
152.56% of 50 DAV
50 DAV is 116,000
|
$86.10
-11.03%
|
11/29/2016
|
$72.45
|
PP = $69.63
|
|
MB = $73.11
|
Most Recent Note - 3/7/2017 10:09:11 AM
G - Proposed a new Public Offering and gapped down today undercutting its 50 DMA line ($80). Recent lows in the $76 area define additional support where more damaging losses may trigger a technical sell signal. Reported earnings +14% on +30% sales revenues for the Dec '16 quarter, below the +25% minimum earnings guideline (C criteria) raising fundamental concerns.
>>> FEATURED STOCK ARTICLE : Perched Near All-Time High Extended From Prior Base - 1/31/2017 |
View all notes |
Set NEW NOTE alert |
Company Profile |
SEC
News |
Chart |
Request a new note
C
A
S
I |
ESNT
-
NYSE
Essent Group Ltd
Finance-MrtgandRel Svc
|
$35.04
|
+0.01
0.03% |
$35.25
|
845,546
135.50% of 50 DAV
50 DAV is 624,000
|
$38.10
-8.03%
|
1/25/2017
|
$34.09
|
PP = $34.04
|
|
MB = $35.74
|
Most Recent Note - 3/7/2017 4:46:27 PM
Y - Consolidating below its "max buy" level, staying above its 50 DMA line and prior highs defining important near-term support in the $33-34 area. Subsequent losses leading to violations may trigger technical sell signals.
>>> FEATURED STOCK ARTICLE : Twice Average Volume Behind Big Breakout Gain - 1/25/2017 |
View all notes |
Set NEW NOTE alert |
Company Profile |
SEC
News |
Chart |
Request a new note
C
A
S
I |
ANET
-
NYSE
Arista Networks Inc
TELECOMMUNICATIONS - Communication Equipment
|
$121.08
|
+1.65
1.38% |
$122.60
|
930,135
112.88% of 50 DAV
50 DAV is 824,000
|
$123.12
-1.66%
|
3/6/2017
|
$119.43
|
PP = $123.22
|
|
MB = $129.38
|
Most Recent Note - 3/7/2017 12:09:14 PM
Y - Hovering near its all-time high. Formed an advanced "3-weeks tight" base pattern while holding its ground stubbornly following a big "breakaway gap" on 2/17/17. Color code was changed to yellow with new pivot point cited based on its 2/21/17 high plus 10 cents. Subsequent volume-driven gains for new highs may trigger a new (or add-on) technical buy signal.
>>> FEATURED STOCK ARTICLE : Stubbornly Holding Ground After Breakaway Gap - 3/1/2017 |
View all notes |
Set NEW NOTE alert |
Company Profile |
SEC
News |
Chart |
Request a new note
C
A
S
I |
Symbol/Exchange
Company Name
Industry Group |
PRICE |
CHANGE
(%Change) |
Day High |
Volume
(% DAV)
(% 50 day avg vol) |
52 Wk Hi
% From Hi |
Featured
Date |
Price
Featured |
Pivot Featured |
|
Max Buy |
VBTX
-
NASDAQ
Veritex Holdings Inc
BANKING - Regional - Southwest Banks
|
$28.37
|
-0.23
-0.80% |
$28.70
|
90,898
103.29% of 50 DAV
50 DAV is 88,000
|
$29.43
-3.60%
|
1/23/2017
|
$27.30
|
PP = $27.87
|
|
MB = $29.26
|
Most Recent Note - 3/3/2017 1:39:27 PM
Y - Stubbornly holding its ground and still hovering near its "max buy" level. Prior highs in the $27 area and its 50 DMA line ($27.41) define important near-term support.
>>> FEATURED STOCK ARTICLE : Challenged Highs But Ended in Bottom Third of Intra-day Range - 1/23/2017 |
View all notes |
Set NEW NOTE alert |
Company Profile |
SEC
News |
Chart |
Request a new note
C
A
S
I |
IBP
-
NYSE
Installed Building Prod
DIVERSIFIED SERVICES - Business/Management Services
|
$48.90
|
-0.35
-0.71% |
$49.70
|
139,722
93.77% of 50 DAV
50 DAV is 149,000
|
$50.05
-2.30%
|
2/27/2017
|
$44.83
|
PP = $44.40
|
|
MB = $46.62
|
Most Recent Note - 3/6/2017 7:00:23 PM
G - Stubbornly holding its ground after an impressive streak of volume-driven gains, very extended from its prior base. No resistance remains due to overhead supply. Prior highs in the $44 area define initial support to watch. First highlighted in the 2/27/17 mid-day report with pivot point cited based on its 12/08/16 high plus 10 cents (read here).
>>> FEATURED STOCK ARTICLE : Big Breakout Followed Solid Earnings News - 2/28/2017 |
View all notes |
Set NEW NOTE alert |
Company Profile |
SEC
News |
Chart |
Request a new note
C
A
S
I |
SFBS
-
NASDAQ
Servisfirst Bancshares
BANKING - Regional - Southeast Banks
|
$41.21
|
-0.26
-0.63% |
$41.96
|
178,286
102.46% of 50 DAV
50 DAV is 174,000
|
$42.66
-3.40%
|
7/19/2016
|
$26.64
|
PP = $26.41
|
|
MB = $27.73
|
Most Recent Note - 3/6/2017 7:08:39 PM
G - Still holding its ground stubbornly and perched near all-time highs. Recently reported earnings +8% on +20% sales revenues for the Dec '16 quarter, below the +25% minimum guideline (C criteria), raising fundamental concerns. Its 50 DMA line ($39.45) defines important near-term support where a subsequent violation would trigger a technical sell signal.
>>> FEATURED STOCK ARTICLE : Perched Near All-Time High After Concerns Raised by Latest Earnings - 2/22/2017 |
View all notes |
Set NEW NOTE alert |
Company Profile |
SEC
News |
Chart |
Request a new note
C
A
S
I |
INGN
-
NASDAQ
Inogen Inc
HEALTH SERVICES - Medical Instruments and Supplies
|
$71.27
|
-0.69
-0.96% |
$71.89
|
162,801
112.28% of 50 DAV
50 DAV is 145,000
|
$79.94
-10.85%
|
2/27/2017
|
$68.69
|
PP = $69.94
|
|
MB = $73.44
|
Most Recent Note - 3/3/2017 1:25:19 PM
Y - Consolidating since its gap up for new all-time highs on 3/01/17 after reporting earnings +32% on +26% sales revenues for the Dec '16 quarter. Disciplined investors avoid chasing stocks more than +5% above the pivot point. Prior highs in the $69 area define initial support to watch.
>>> FEATURED STOCK ARTICLE : Formed Orderly Base With Earnings News Due After Tuesday's Close - 2/27/2017 |
View all notes |
Set NEW NOTE alert |
Company Profile |
SEC
News |
Chart |
Request a new note
C
A
S
I |
PLAY
-
NASDAQ
Dave & Buster's Ent Inc
Retail-Restaurants
|
$56.64
|
-0.25
-0.44% |
$57.34
|
396,653
70.70% of 50 DAV
50 DAV is 561,000
|
$59.63
-5.01%
|
2/23/2017
|
$55.41
|
PP = $58.35
|
|
MB = $61.27
|
Most Recent Note - 3/7/2017 4:49:30 PM
Y - Consolidating above its 50 DMA line ($55.88) which has recently acted as a support level while encountering distributional pressure. It was highlighted in yellow with pivot point cited based on its 1/04/17 high plus 10 cents in the 2/23/17 mid-day report (read here) and it was noted - "Subsequent gains for new highs with above average volume may trigger a convincing technical buy signal. Recently wedged to new highs with gains lacking great volume. Found support near its 50 DMA line while consolidating since a big 'breakaway gap' on 12/07/16 after reporting better than expected earnings +108% on +19% sales revenues for the Oct '16 quarter. Following its $16 IPO on 10/10/14 it completed Secondary Offerings on 2/05/15, 5/27/15, and 10/01/15. "
>>> FEATURED STOCK ARTICLE : Consolidating Near 50 DMA After Recent Gains Lacked Volume - 2/23/2017 |
View all notes |
Set NEW NOTE alert |
Company Profile |
SEC
News |
Chart |
Request a new note
C
A
S
I |
Symbol/Exchange
Company Name
Industry Group |
PRICE |
CHANGE
(%Change) |
Day High |
Volume
(% DAV)
(% 50 day avg vol) |
52 Wk Hi
% From Hi |
Featured
Date |
Price
Featured |
Pivot Featured |
|
Max Buy |
LITE
-
NASDAQ
Lumentum Holdings Inc
TELECOMMUNICATIONS - Cables / Satalite Equipment
|
$46.50
|
-0.70
-1.48% |
$47.85
|
1,544,306
111.91% of 50 DAV
50 DAV is 1,380,000
|
$53.70
-13.40%
|
2/8/2017
|
$44.60
|
PP = $44.80
|
|
MB = $47.04
|
Most Recent Note - 3/3/2017 1:26:12 PM
Y - Color code was changed to yellow after pulling back below its "max buy" level. Prior highs in the $44-45 area define important support to watch.
>>> FEATURED STOCK ARTICLE : Gap Up Gain and Strong Finish Triggered Technical Buy Signal - 2/8/2017 |
View all notes |
Set NEW NOTE alert |
Company Profile |
SEC
News |
Chart |
Request a new note
C
A
S
I |
LCII
-
NYSE
L C I Industries
MATERIALS and CONSTRUCTION - General Building Materials
|
$110.05
|
-1.65
-1.48% |
$111.00
|
190,695
122.24% of 50 DAV
50 DAV is 156,000
|
$117.15
-6.06%
|
11/29/2016
|
$106.29
|
PP = $101.00
|
|
MB = $106.05
|
Most Recent Note - 3/6/2017 7:03:23 PM
G - Quietly consolidating near its 50 DMA line ($110). Deterioration below the 50 DMA line and below the recent low ($104.10 on 2/14/17) may trigger a more worrisome technical sell signal. Fundamentals through Dec '16 remain strong.
>>> FEATURED STOCK ARTICLE : Distributional Action While Retreating From Highs - 1/30/2017 |
View all notes |
Set NEW NOTE alert |
Company Profile |
SEC
News |
Chart |
Request a new note
C
A
S
I |
MOMO
-
NASDAQ
Momo Inc Ads Cl A
INTERNET - Content
|
$30.00
|
+3.39
12.74% |
$30.22
|
22,307,334
1,258.17% of 50 DAV
50 DAV is 1,773,000
|
$28.44
5.49%
|
3/7/2017
|
$29.71
|
PP = $27.83
|
|
MB = $29.22
|
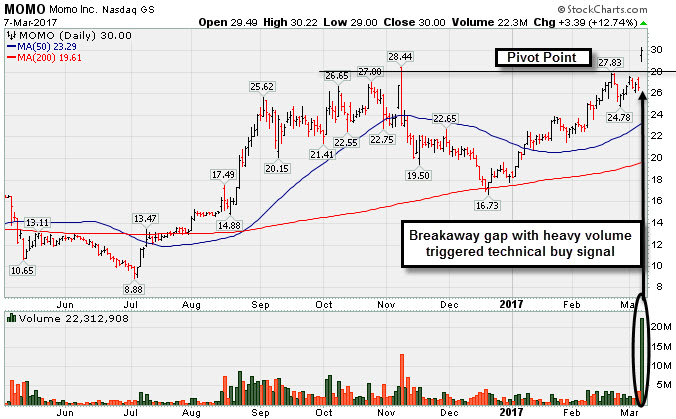
Most Recent Note - 3/7/2017 5:48:29 PM
Y - Finished strong with 11 times average volume behind gain after big breakaway gap. Color code was changed to yellow with pivot point cited based on its 2/21/17 high after a cup-with-handle base when the mid-day report noted - "Hitting new all-time highs with a "breakaway gap" triggering a technical buy signal after reporting greatly improved sales and earnings in the Dec '16 quarterly, its 3rd consecutive comparison with very strong results versus the year ago periods. Limited history remains a concern for this Chinese Internet - Content firm that completed its $14 IPO in Dec '14." See the latest FSU analysis for more details and a new annotated graph.
>>> FEATURED STOCK ARTICLE : Breakaway Gap Followed Very Strong Earnings Report - 3/7/2017 |
View all notes |
Set NEW NOTE alert |
Company Profile |
SEC
News |
Chart |
Request a new note
C
A
S
I |