You are not logged in.
This means you
CAN ONLY VIEW reports that were published prior to Friday, March 28, 2025.
You
MUST UPGRADE YOUR MEMBERSHIP if you want to see any current reports.
AFTER MARKET UPDATE - TUESDAY, FEBRUARY 21ST, 2017
Previous After Market Report Next After Market Report >>>
|
|
|
|
DOW |
+118.95 |
20,743.00 |
+0.58% |
|
Volume |
1,055,625,250 |
-9% |
|
Volume |
1,754,229,840 |
+3% |
|
NASDAQ |
+27.37 |
5,865.95 |
+0.47% |
|
Advancers |
2,130 |
72% |
|
Advancers |
1,670 |
58% |
|
S&P 500 |
+14.22 |
2,365.38 |
+0.60% |
|
Decliners |
827 |
28% |
|
Decliners |
1,207 |
42% |
|
Russell 2000 |
+10.48 |
1,410.34 |
+0.75% |
|
52 Wk Highs |
272 |
|
|
52 Wk Highs |
323 |
|
|
S&P 600 |
+7.11 |
862.21 |
+0.83% |
|
52 Wk Lows |
10 |
|
|
52 Wk Lows |
27 |
|
|
 |
Leadership Expands as Indices Extend Rally
Kenneth J. Gruneisen - Passed the CAN SLIM® Master's Exam
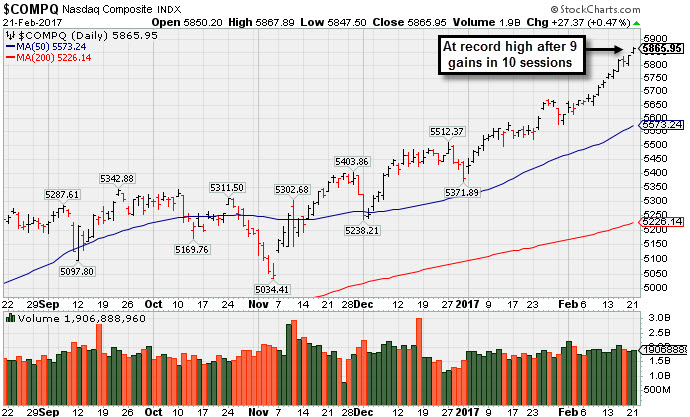
Stocks climbed once again on Tuesday. The Dow gained 118 points to 20743. The S&P 500 added 14 points to 2365 and the Nasdaq Composite gained 27 points to 5865. Volume totals were mixed, lighter than the prior session total on the NYSE and higher on the Nasdaq exchange. Breadth was positive as advancers led decliners by more than 2-1 on the NYSE and 4-3 on the Nasdaq exchange. There were 91 high-ranked companies from the Leaders List that made new 52-week highs and were listed on the BreakOuts Page, more than doubling the total of 44 on the prior session. New 52-week highs totals expanded and solidly outnumbered new 52-week lows on both the NYSE and the Nasdaq exchange.
PICTURED: The Nasdaq Composite Index is perched at a record high after posting 9 gains in 10 sessions, up +9% year-to-date.
Leadership remains healthy as the major averages' (M criteria) have maintained an upward trend. New buying efforts should only be made in candidates with superior fundamental and technical characteristics. The Featured Stocks Page lists noteworthy high-ranked leaders.
The major averages advanced further into uncharted highs amid a busy day of earnings and economic news. On the data front, research firm Markit reported that preliminary manufacturing PMI came in at 54.3 for February, below expectations of 55.4. A reading on the services sector also missed the mark, coming in at 53.9 versus analyst projections of 55.8. Overseas, European markets finished higher after composite updates on the manufacturing and services sectors each soundly exceeded consensus expectations.
All 11 sectors in the S&P 500 finished in positive territory with Real Estate and Utilities shares leading the way. In earnings, Home Depot (HD +1.41%) and Wal-Mart (WMT +3.00%) rose as both posted profits that topped analyst projections. In M&A news, Kraft Heinz (KHC -1.84%) fell after the company withdrew its bid to purchase Unilever (UL -7.54%). Popeye’s Louisiana Kitchen (PLKI +19.07%) hit a new high after agreeing to a takeover offer from Restaurant Brands International (QSR +6.86%).
Treasuries finished modestly lower with the benchmark 10-year note losing 4/32 to yield 2.43%. In commodities, NYMEX WTI crude advanced 1.2% to $54.06/barrel. In FOREX, the Dollar Index gained 0.4% with strength against the yen and euro. |
 Kenneth J. Gruneisen started out as a licensed stockbroker in August 1987, a couple of months prior to the historic stock market crash that took the Dow Jones Industrial Average down -22.6% in a single day. He has published daily fact-based fundamental and technical analysis on high-ranked stocks online for two decades. Through FACTBASEDINVESTING.COM, Kenneth provides educational articles, news, market commentary, and other information regarding proven investment systems that work in good times and bad.
Comments contained in the body of this report are technical opinions only and are not necessarily those of Gruneisen Growth Corp. The material herein has been obtained from sources believed to be reliable and accurate, however, its accuracy and completeness cannot be guaranteed. Our firm, employees, and customers may effect transactions, including transactions contrary to any recommendation herein, or have positions in the securities mentioned herein or options with respect thereto. Any recommendation contained in this report may not be suitable for all investors and it is not to be deemed an offer or solicitation on our part with respect to the purchase or sale of any securities. |
|
 |
Financial, Retail, Energy, and Most Tech Groups Rose
Kenneth J. Gruneisen - Passed the CAN SLIM® Master's Exam
The Broker/Dealer Index ($XBD +0.77%) and the Bank Index ($BKX +0.55%) both ended slightly higher on Tuesday while the Retail Index ($RLX +0.79%) also helped boost the major indices. The Semiconductor Index ($SOX +1.40%) and the Networking Index ($NWX +0.61%) finished with gains, but the Biotechnology Index ($BTK -0.50%) edged lower. Commodity-linked groups were mixed as the Oil Services Index ($OSX +1.00%) and Integrated Oil Index ($XOI +1.14%) both rose, but the Gold & Silver Index ($XAU -0.89%) lost ground. Charts courtesy www.stockcharts.com
 PICTURED: The Integrated Oil Index ($XOI +1.14%) has been sputtering below its 50-day moving average (DMA) line.
| Oil Services |
$OSX |
176.80 |
+1.75 |
+1.00% |
-3.80% |
| Integrated Oil |
$XOI |
1,218.52 |
+13.68 |
+1.14% |
-3.90% |
| Semiconductor |
$SOX |
990.44 |
+13.64 |
+1.40% |
+9.26% |
| Networking |
$NWX |
467.81 |
+2.82 |
+0.61% |
+4.87% |
| Broker/Dealer |
$XBD |
225.73 |
+0.77 |
+0.34% |
+9.96% |
| Retail |
$RLX |
1,440.22 |
+11.34 |
+0.79% |
+7.24% |
| Gold & Silver |
$XAU |
91.73 |
-0.83 |
-0.90% |
+16.32% |
| Bank |
$BKX |
96.79 |
+0.53 |
+0.55% |
+5.45% |
| Biotech |
$BTK |
3,444.99 |
-17.19 |
-0.50% |
+12.03% |
|
|
|
 |
Perched Near All-Time High With Earnings Report Due
Kenneth J. Gruneisen - Passed the CAN SLIM® Master's Exam
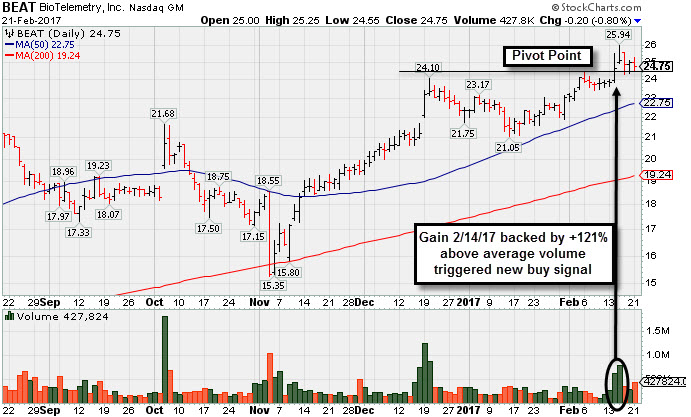
BioTelemetry Inc (BEAT -$0.20 or -0.80% to $24.75) was highlighted in yellow in the 2/14/17 mid-day report with new pivot point cited based on its 2/06/17 high plus 10 cents after a saucer-with-handle base above its prior base (read here). The gain above its pivot point was backed by +121% above average volume triggering a new (or add-on) technical buy signal.
Following the close on Wednesday, February 22nd it is due to report Dec '16 quarter earnings news. Volume and volatility often increase near earnings news. Prior highs in the $24 area and its 50-day moving average (DMA) line ($22.75) define important near-term support. Disciplined investors know to never chase stocks and buy them more than +5% above prior highs, and to preserve capital they always sell any stock that falls more than -8% from their purchase price.
BEAT was last shown in this FSU section on 1/10/17 with an annotated graph under the headline, "Volume Totals Cooling While Consolidating Above Prior Highs". It was first highlighted in yellow with pivot point cited based on its 10/05/16 high plus 10 cents in the 12/19/16 mid-day report (read here). During its consolidation it found prompt support near its 200-day moving average (DMA) line, a reassuring sign that institutional owners stepped up near that long-term average.
It has the highest possible Earnings Per Share Rating of 99, well above the 80+ minimum guideline for buy candidates. Its quarterly and annual earnings history is a good match with the C and A criteria. Earnings per share rose +200%, +233%, +67%, and +62% in the Dec '15, Mar, Jun and Sep '16 quarters, respectively. During that same span the sales revenues increases were +7%, +12%, +18%, and +22%, showing encouraging acceleration.
Its current Up/Down Volume Ratio of 1.6 is an unbiased indication its shares have been under accumulation over the past 50 days. The number of top-rated funds owning its shares rose from 194 in Dec '15 to 267 in Sep '16.Increasing ownership by top-rated funds is a reassuring sign concerning the I criteria, and it has a small supply (S criteria) of only 28.2 million shares outstanding.
|
|
|
Color Codes Explained :
Y - Better candidates highlighted by our
staff of experts.
G - Previously featured
in past reports as yellow but may no longer be buyable under the
guidelines.
***Last / Change / Volume data in this table is the closing quote data***
Symbol/Exchange
Company Name
Industry Group |
PRICE |
CHANGE
(%Change) |
Day High |
Volume
(% DAV)
(% 50 day avg vol) |
52 Wk Hi
% From Hi |
Featured
Date |
Price
Featured |
Pivot Featured |
|
Max Buy |
THO
-
NYSE
Thor Industries Inc
AUTOMOTIVE - Recreational Vehicles
|
$111.20
|
+0.48
0.43% |
$112.30
|
471,872
89.20% of 50 DAV
50 DAV is 529,000
|
$111.81
-0.55%
|
1/24/2017
|
$100.52
|
PP = $108.45
|
|
MB = $113.87
|
 Most Recent Note - 2/21/2017 3:56:37 PM
Y - Still perched at record highs, stubbornly holding its ground with volume totals cooling. Gapped up on 2/08/17 and rallied above its pivot point with a gain backed by very near the +40% above average volume needed to trigger a proper technical buy signal.
>>> FEATURED STOCK ARTICLE : Rose From Support at 50-Day Moving Average Line - 1/24/2017 |
View all notes |
Set NEW NOTE alert |
Company Profile |
SEC
News |
Chart |
Request a new note
C
A
S
I |
SBCF
-
NASDAQ
Seacoast Banking Corp Fl
BANKING - Regional - Mid-Atlantic Banks
|
$24.45
|
+0.75
3.16% |
$24.52
|
728,915
241.36% of 50 DAV
50 DAV is 302,000
|
$25.13
-2.71%
|
2/13/2017
|
$24.84
|
PP = $23.10
|
|
MB = $24.26
|
Most Recent Note - 2/21/2017 12:37:15 PM
Y - Still holding its ground stubbornly since its 2/13/17 gap up was highlighted in yellow with pivot point cited based on its 1/04/17 high plus 10 cents. Its solid volume-driven gain clinched a technical buy signal. Completed a new Public Offering on 2/15/17. Prior highs in the $23 area define initial support to watch. See the latest FSU analysis for more details and an annotated graph.
>>> FEATURED STOCK ARTICLE : Gap Up Gain and Strong Finish Triggered Technical Buy Signal - 2/13/2017 |
View all notes |
Set NEW NOTE alert |
Company Profile |
SEC
News |
Chart |
Request a new note
C
A
S
I |
CSFL
-
NASDAQ
Centerstate Banks Inc
Banks-Southeast
|
$25.29
|
-0.07
-0.28% |
$25.62
|
177,785
62.16% of 50 DAV
50 DAV is 286,000
|
$26.30
-3.84%
|
10/10/2016
|
$18.20
|
PP = $18.37
|
|
MB = $19.29
|
Most Recent Note - 2/21/2017 3:48:38 PM
G - Consolidating above its 50 DMA line ($24.95). Recent low ($23.80 on 2/08/17) defines important near-term support where further deterioration would trigger a technical sell signal. Completed a new Public Offering of shares on 1/10/17.
>>> FEATURED STOCK ARTICLE : Found Support Near 50-Day Average Following Offering - 2/6/2017 |
View all notes |
Set NEW NOTE alert |
Company Profile |
SEC
News |
Chart |
Request a new note
C
A
S
I |
IESC
-
NASDAQ
Integrated Electric Svcs
Bldg-Maintenance and Svc
|
$20.15
|
+0.15
0.75% |
$20.68
|
63,912
99.24% of 50 DAV
50 DAV is 64,400
|
$23.00
-12.39%
|
11/23/2016
|
$19.35
|
PP = $18.26
|
|
MB = $19.17
|
Most Recent Note - 2/21/2017 3:50:06 PM
G - Still consolidating above its 50 DMA line ($19.78). Prior low ($18.05 on 1/18/17) defines important support near prior highs. Recently reported Dec '16 quarterly earnings -33% on +27% sales revenues, below the +25% minimum earnings guideline (C criteria), raising fundamental concerns.
>>> FEATURED STOCK ARTICLE : Violated 50-Day Moving Average Line and Now Testing Prior Highs - 1/19/2017 |
View all notes |
Set NEW NOTE alert |
Company Profile |
SEC
News |
Chart |
Request a new note
C
A
S
I |
NSP
-
NYSE
Insperity Inc
Comml Svcs-Outsourcing
|
$84.00
|
-0.30
-0.36% |
$85.15
|
215,553
150.74% of 50 DAV
50 DAV is 143,000
|
$86.35
-2.72%
|
2/14/2017
|
$84.30
|
PP = $82.28
|
|
MB = $86.39
|
Most Recent Note - 2/21/2017 3:54:33 PM
Y - Holding its ground stubbornly, staying above prior highs but remaining below its "max buy" level since highlighted in yellow with pivot point cited based on its 7/26/16 high plus 10 cents in the 2/14/17 mid-day report (read here).
>>> FEATURED STOCK ARTICLE : Big Volume-Driven Gains Indicative of Institutional Demand - 2/14/2017 |
View all notes |
Set NEW NOTE alert |
Company Profile |
SEC
News |
Chart |
Request a new note
C
A
S
I |
Symbol/Exchange
Company Name
Industry Group |
PRICE |
CHANGE
(%Change) |
Day High |
Volume
(% DAV)
(% 50 day avg vol) |
52 Wk Hi
% From Hi |
Featured
Date |
Price
Featured |
Pivot Featured |
|
Max Buy |
BERY
-
NYSE
Berry Plastics Group Inc
CONSUMER NON-DURABLES - Packaging and Containers
|
$50.53
|
-0.17
-0.34% |
$51.06
|
922,564
74.10% of 50 DAV
50 DAV is 1,245,000
|
$52.97
-4.61%
|
11/30/2016
|
$50.26
|
PP = $46.47
|
|
MB = $48.79
|
Most Recent Note - 2/21/2017 3:47:32 PM
G - Relative Strength Rating is 82, above the 80+ minimum for buy candidates under the fact-based investment system, and it has rebounded above its 50 DMA line. Recent lows in the $48.50 area define near-term support. Damaging losses and violations would trigger a more worrisome technical sell signal. Reported earnings +43% on -7% sales revenues for the Dec '16 quarter.
>>> FEATURED STOCK ARTICLE : Recent 50-Day Violation Raised Concerns - 2/7/2017 |
View all notes |
Set NEW NOTE alert |
Company Profile |
SEC
News |
Chart |
Request a new note
C
A
S
I |
EVR
-
NYSE
Evercore Partners Inc
FINANCIAL SERVICES - Investment Banking
|
$80.35
|
-0.10
-0.12% |
$81.30
|
495,658
117.18% of 50 DAV
50 DAV is 423,000
|
$81.75
-1.71%
|
1/5/2017
|
$71.40
|
PP = $72.07
|
|
MB = $75.67
|
Most Recent Note - 2/17/2017 6:04:47 PM
G - Holding its ground stubbornly while extended from its prior base. Recently reported Dec '16 quarterly earnings +17% on +9% sales revenues, below the +25% minimum earnings guideline (C criteria), raising fundamental concerns. See the latest FSU analysis for more details and a new annotated graph.
>>> FEATURED STOCK ARTICLE : Holding Ground After Latest Earnings Were Below +25% Guideline - 2/17/2017 |
View all notes |
Set NEW NOTE alert |
Company Profile |
SEC
News |
Chart |
Request a new note
C
A
S
I |
NTES
-
NASDAQ
Netease Inc Adr
INTERNET - Internet Information Providers
|
$293.44
|
-3.81
-1.28% |
$297.50
|
1,264,524
123.01% of 50 DAV
50 DAV is 1,028,000
|
$299.68
-2.08%
|
2/10/2017
|
$259.30
|
PP = $272.68
|
|
MB = $286.31
|
Most Recent Note - 2/17/2017 11:59:15 AM
Y - Triggered a technical buy signal with a big "breakaway gap" backed by heavy volume on the prior session. Reported earnings +57% on +43% sales revenues for the Dec '16 quarter, continuing its strong earnings track record. NTES was highlighted in yellow with new pivot point cited based on its 10/14/16 high plus 10 cents in the 2/10/17 mid-day report (read here) when noted - "Subsequent volume driven gains for new highs may trigger a technical buy signal. Due to report Dec '16 earnings on 2/15/17 and volume and volatility often increase near earnings news. Gradually rebounding after dropped from the Featured Stocks list on 12/12/16."
>>> FEATURED STOCK ARTICLE : Rebounding With Earnings News Due Soon - 2/10/2017 |
View all notes |
Set NEW NOTE alert |
Company Profile |
SEC
News |
Chart |
Request a new note
C
A
S
I |
STMP
-
NASDAQ
Stamps.com Inc
INTERNET - Internet Software and Services
|
$135.15
|
+3.65
2.78% |
$135.80
|
489,643
238.85% of 50 DAV
50 DAV is 205,000
|
$132.30
2.15%
|
2/16/2017
|
$129.45
|
PP = $123.85
|
|
MB = $130.04
|
Most Recent Note - 2/21/2017 12:43:38 PM
G - Color code is changed to green after rallying well above its "max buy" level, It was highlighted in yellow with pivot point cited based on its 3/07/16 high plus 10 cents in the 2/16/17 mid-day report while noted - "Subsequent volume-driven gains may help clinch a convincing technical buy signal. Recently it has been wedging to new highs with gains lacking great volume conviction." Due to report Dec'16 earnings on 2/23/17, and volume and volatility often increase near earnings news. See the latest FSU analysis for more details and an annotated graph.
>>> FEATURED STOCK ARTICLE : Recent Gains Have Lacked Heavy Volume Indicative of Accumulation - 2/16/2017 |
View all notes |
Set NEW NOTE alert |
Company Profile |
SEC
News |
Chart |
Request a new note
C
A
S
I |
HTHT
-
NASDAQ
China Lodging Group Ads
LEISURE - Lodging
|
$56.61
|
+0.63
1.13% |
$56.80
|
122,444
83.30% of 50 DAV
50 DAV is 147,000
|
$59.20
-4.38%
|
9/29/2016
|
$46.12
|
PP = $47.82
|
|
MB = $50.21
|
Most Recent Note - 2/16/2017 12:23:34 PM
G - Challenging its 52-week high with today's gain backed by above average volume. Prior highs in the $54 area define near-term support above its 50 DMA line. Repeatedly noted with caution in prior reports - "Reported earnings +10% on +6% sales revenues for the Sep '16 quarter, below the +25% minimum earnings guideline (C criteria), raising concerns." See the latest FSU analysis for more details and a new annotated graph.
>>> FEATURED STOCK ARTICLE : Mostly Bullish Action Continues Since Latest Earnings Report - 2/9/2017 |
View all notes |
Set NEW NOTE alert |
Company Profile |
SEC
News |
Chart |
Request a new note
C
A
S
I |
Symbol/Exchange
Company Name
Industry Group |
PRICE |
CHANGE
(%Change) |
Day High |
Volume
(% DAV)
(% 50 day avg vol) |
52 Wk Hi
% From Hi |
Featured
Date |
Price
Featured |
Pivot Featured |
|
Max Buy |
LMAT
-
NASDAQ
Lemaitre Vascular Inc
Medical-Products
|
$24.61
|
+0.81
3.40% |
$24.90
|
162,449
151.82% of 50 DAV
50 DAV is 107,000
|
$27.04
-8.98%
|
12/22/2016
|
$24.99
|
PP = $25.09
|
|
MB = $26.34
|
Most Recent Note - 2/21/2017 4:01:20 PM
Y - Today's rally above its 50 DMA line ($23.86) with higher volume helped its outlook to improve and its color code is changed to yellow.
>>> FEATURED STOCK ARTICLE : Concerns Increase While Lingering Below 50-Day Moving Average - 1/27/2017 |
View all notes |
Set NEW NOTE alert |
Company Profile |
SEC
News |
Chart |
Request a new note
C
A
S
I |
BEAT
-
NASDAQ
BioTelemetry Inc
Medical-Services
|
$24.75
|
-0.20
-0.80% |
$25.25
|
427,524
143.95% of 50 DAV
50 DAV is 297,000
|
$25.94
-4.60%
|
2/14/2017
|
$25.10
|
PP = $24.55
|
|
MB = $25.78
|
Most Recent Note - 2/21/2017 3:59:35 PM
Y - Highlighted in yellow in the 2/14/17 mid-day report with new pivot point cited based on its 2/06/17 high plus 10 cents after a saucer-with-handle base above its prior base. The volume-driven gain above its pivot point was backed by +121% above average volume triggering a new (or add-on) technical buy signal. Prior highs in the $24 area and its 50 DMA line ($22.75) define important near-term support.
>>> FEATURED STOCK ARTICLE : Perched Near All-Time High With Earnings Report Due - 2/21/2017 |
View all notes |
Set NEW NOTE alert |
Company Profile |
SEC
News |
Chart |
Request a new note
C
A
S
I |
PATK
-
NASDAQ
Patrick Industries Inc
WHOLESALE - Building Materials Wholesale
|
$79.05
|
+0.70
0.89% |
$80.50
|
89,391
72.68% of 50 DAV
50 DAV is 123,000
|
$86.10
-8.19%
|
11/29/2016
|
$72.45
|
PP = $69.63
|
|
MB = $73.11
|
Most Recent Note - 2/16/2017 12:43:55 PM
G - Reported earnings +14% on +30% sales revenues for the Dec '16 quarter, below the +25% minimum earnings guideline (C criteria) raising fundamental concerns. Finding support at its 50 DMA line ($79.05) after it tested recent lows in the $76 area. More damaging losses may trigger a technical sell signal.
>>> FEATURED STOCK ARTICLE : Perched Near All-Time High Extended From Prior Base - 1/31/2017 |
View all notes |
Set NEW NOTE alert |
Company Profile |
SEC
News |
Chart |
Request a new note
C
A
S
I |
ESNT
-
NYSE
Essent Group Ltd
Finance-MrtgandRel Svc
|
$34.71
|
-0.97
-2.72% |
$35.82
|
1,173,162
178.29% of 50 DAV
50 DAV is 658,000
|
$38.10
-8.90%
|
1/25/2017
|
$34.09
|
PP = $34.04
|
|
MB = $35.74
|
Most Recent Note - 2/21/2017 12:14:00 PM
Y - Slumping below its "max buy" level with today's 5th consecutive loss and its color code is changed to yellow. Its 50 DMA line and prior highs define important near-term support in the $33-34 area.
>>> FEATURED STOCK ARTICLE : Twice Average Volume Behind Big Breakout Gain - 1/25/2017 |
View all notes |
Set NEW NOTE alert |
Company Profile |
SEC
News |
Chart |
Request a new note
C
A
S
I |
ANET
-
NYSE
Arista Networks Inc
TELECOMMUNICATIONS - Communication Equipment
|
$122.62
|
+3.56
2.99% |
$123.12
|
1,653,366
198.48% of 50 DAV
50 DAV is 833,000
|
$119.45
2.65%
|
12/30/2016
|
$96.77
|
PP = $99.00
|
|
MB = $103.95
|
Most Recent Note - 2/21/2017 12:04:59 PM
G - Color code is changed to green while getting more extended from prior highs in the $103 area following a big "breakaway gap" on 2/17/17. Reported earnings +30% on +34% sales revenues for the Dec '16 quarter and it was noted - "Recovered impressively and faces no resistance due to overhead supply, but it has not formed a sound base after its gap down on 1/17/17."
>>> FEATURED STOCK ARTICLE : Technical Damages Raised Concern and Triggered Technical Sell Signal - 1/18/2017 |
View all notes |
Set NEW NOTE alert |
Company Profile |
SEC
News |
Chart |
Request a new note
C
A
S
I |
Symbol/Exchange
Company Name
Industry Group |
PRICE |
CHANGE
(%Change) |
Day High |
Volume
(% DAV)
(% 50 day avg vol) |
52 Wk Hi
% From Hi |
Featured
Date |
Price
Featured |
Pivot Featured |
|
Max Buy |
VBTX
-
NASDAQ
Veritex Holdings Inc
BANKING - Regional - Southwest Banks
|
$29.01
|
-0.10
-0.34% |
$29.43
|
65,810
70.01% of 50 DAV
50 DAV is 94,000
|
$29.33
-1.09%
|
1/23/2017
|
$27.30
|
PP = $27.87
|
|
MB = $29.26
|
Most Recent Note - 2/21/2017 3:58:00 PM
Y - Touched a new high and traded above its "max buy" level briefly today then reversed into the red. Prior highs in the $27 area define initial support above its 50 DMA line ($26.69).
>>> FEATURED STOCK ARTICLE : Challenged Highs But Ended in Bottom Third of Intra-day Range - 1/23/2017 |
View all notes |
Set NEW NOTE alert |
Company Profile |
SEC
News |
Chart |
Request a new note
C
A
S
I |
SFBS
-
NASDAQ
Servisfirst Bancshares
BANKING - Regional - Southeast Banks
|
$41.95
|
+0.08
0.19% |
$42.43
|
119,545
52.66% of 50 DAV
50 DAV is 227,000
|
$42.45
-1.18%
|
7/19/2016
|
$26.64
|
PP = $26.41
|
|
MB = $27.73
|
Most Recent Note - 2/21/2017 3:55:55 PM
G - Holding its ground stubbornly and perched at all-time highs. Recently reported earnings +8% on +20% sales revenues for the Dec '16 quarter, below the +25% minimum guideline (C criteria), raising fundamental concerns. Its 50 DMA line ($38.48) defines important near-term support above recent lows in the $36 area. Subsequent violations would trigger technical sell signals.
>>> FEATURED STOCK ARTICLE : Stubbornly Holding Ground Near Highs - 1/12/2017 |
View all notes |
Set NEW NOTE alert |
Company Profile |
SEC
News |
Chart |
Request a new note
C
A
S
I |
LITE
-
NASDAQ
Lumentum Holdings Inc
TELECOMMUNICATIONS - Cables / Satalite Equipment
|
$52.55
|
+1.45
2.84% |
$53.70
|
1,074,327
87.99% of 50 DAV
50 DAV is 1,221,000
|
$52.00
1.06%
|
2/8/2017
|
$44.60
|
PP = $44.80
|
|
MB = $47.04
|
Most Recent Note - 2/16/2017 5:27:08 PM
G - Hit another new high today, getting very extended from its prior base with a spurt of volume-driven gains. Prior highs in the $44-45 area define initial support to watch on pullbacks.
>>> FEATURED STOCK ARTICLE : Gap Up Gain and Strong Finish Triggered Technical Buy Signal - 2/8/2017 |
View all notes |
Set NEW NOTE alert |
Company Profile |
SEC
News |
Chart |
Request a new note
C
A
S
I |
LCII
-
NYSE
L C I Industries
MATERIALS and CONSTRUCTION - General Building Materials
|
$110.15
|
+1.20
1.10% |
$111.20
|
113,595
66.82% of 50 DAV
50 DAV is 170,000
|
$117.15
-5.98%
|
11/29/2016
|
$106.29
|
PP = $101.00
|
|
MB = $106.05
|
Most Recent Note - 2/21/2017 3:51:52 PM
G - Consolidating near its 50 DMA line ($109.94). Further deterioration below recent low ($104.10 on 2/14/17) may trigger a more worrisome technical sell signal. Fundamentals through Dec '16 remain strong.
>>> FEATURED STOCK ARTICLE : Distributional Action While Retreating From Highs - 1/30/2017 |
View all notes |
Set NEW NOTE alert |
Company Profile |
SEC
News |
Chart |
Request a new note
C
A
S
I |
|
|
|
THESE ARE NOT BUY RECOMMENDATIONS!
Comments contained in the body of this report are technical
opinions only. The material herein has been obtained
from sources believed to be reliable and accurate, however,
its accuracy and completeness cannot be guaranteed.
This site is not an investment advisor, hence it does
not endorse or recommend any securities or other investments.
Any recommendation contained in this report may not
be suitable for all investors and it is not to be deemed
an offer or solicitation on our part with respect to
the purchase or sale of any securities. All trademarks,
service marks and trade names appearing in this report
are the property of their respective owners, and are
likewise used for identification purposes only.
This report is a service available
only to active Paid Premium Members.
You may opt-out of receiving report notifications
at any time. Questions or comments may be submitted
by writing to Premium Membership Services 665 S.E. 10 Street, Suite 201 Deerfield Beach, FL 33441-5634 or by calling 1-800-965-8307
or 954-785-1121.
|
|
|