You are not logged in.
This means you
CAN ONLY VIEW reports that were published prior to Wednesday, April 2, 2025.
You
MUST UPGRADE YOUR MEMBERSHIP if you want to see any current reports.
AFTER MARKET UPDATE - MONDAY, JANUARY 30TH, 2017
Previous After Market Report Next After Market Report >>>
|
|
|
|
DOW |
-122.65 |
19,971.13 |
-0.61% |
|
Volume |
1,027,442,080 |
+20% |
|
Volume |
1,611,640,730 |
+5% |
|
NASDAQ |
-47.07 |
5,613.71 |
-0.83% |
|
Advancers |
890 |
30% |
|
Advancers |
683 |
23% |
|
S&P 500 |
-13.79 |
2,280.90 |
-0.60% |
|
Decliners |
2,082 |
70% |
|
Decliners |
2,274 |
77% |
|
Russell 2000 |
-18.37 |
1,352.33 |
-1.34% |
|
52 Wk Highs |
40 |
|
|
52 Wk Highs |
51 |
|
|
S&P 600 |
-11.22 |
827.14 |
-1.34% |
|
52 Wk Lows |
28 |
|
|
52 Wk Lows |
44 |
|
|
 |
Leadership Thins as Major Averages Encounter Distribution
Kenneth J. Gruneisen - Passed the CAN SLIM® Master's Exam
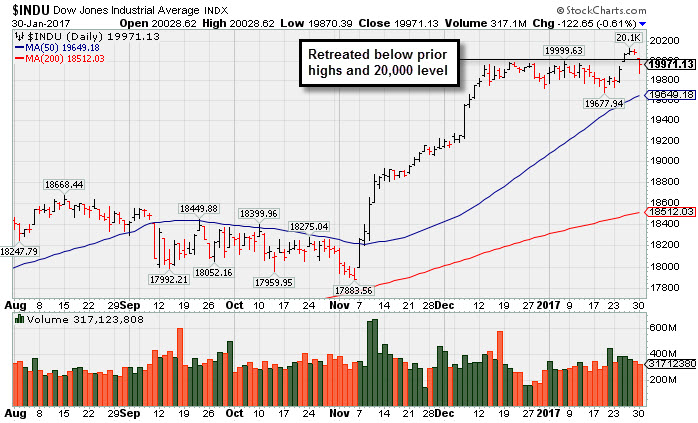
Stocks retreated on Monday. The Dow was down 122 points to 19971. The S&P 500 lost 13 points to 2280 and the Nasdaq Composite fell 47 points to 5613. Volume totals were lighter than the prior session totals on the NYSE and on the Nasdaq exchange. Breadth was negative as decliners led advancers by more than a 2-1 margin on the NYSE and by more than a 3-1 margin on the Nasdaq exchange. There were 9 high-ranked companies from the Leaders List that made new 52-week highs and were listed on the BreakOuts Page, versus the total of 47 on the prior session. New 52-week highs totals still outnumbered new 52-week lows on both the NYSE and the Nasdaq exchange.
PICTURED: The Dow Jones Industrial Average retreated below prior highs and below the 20,000 level. Its 50-day moving average (DMA) line and recent lows define near-term support to watch on pullbacks.
An evaporation of leadership has raised concerns while the major averages' (M criteria) confirmed uptrend has encountered more damaging distributional pressure. New buying efforts should only be made in candidates with superior fundamental and technical characteristics. The Featured Stocks Page lists noteworthy high-ranked leaders.
The major averages finished firmly lower on the session as investors weighed concern over President Donald Trump’s immigration policies. On the data front, personal income increased 0.3% while personal spending rose 0.5% in December. In a separate release, pending home sales rebounded 1.6% last month, above analyst expectations. Finally, the PCE deflator, which is the Fed’s preferred proxy for inflation, ticked up 0.2% in December.
Nine of 11 sectors in the S&P 500 ended in negative territory. Energy stocks led the losses with Chevron (CVX -1.73%). Technology stocks finished lower with Fitbit (FIT -15.95%) amid reports the company will cut 6% of workforce in an effort to reduce expenses. In the consumer space, Rite-Aid (RAD -17.5%) as the drug chain announced an amended merger agreement with Walgreens (WBA -0.02%). Tempur Sealy (TPX -28.01%) fell after terminating its contract with Mattress Firm. In Financials, Affiliated Managers Group (AMG -4.76%) after reporting better-than-expected quarterly profit.
Treasuries fluctuated throughout the session with the benchmark 10-year note down 2/32 to yield 2.49%. In commodities, NYMEX WTI crude lost 0.9% to $52.69/barrel. COMEX gold gained 0.6% to $1194.90/ounce. In FOREX, the Dollar Index fell 0.1% with particular weakness against the yen. |
 Kenneth J. Gruneisen started out as a licensed stockbroker in August 1987, a couple of months prior to the historic stock market crash that took the Dow Jones Industrial Average down -22.6% in a single day. He has published daily fact-based fundamental and technical analysis on high-ranked stocks online for two decades. Through FACTBASEDINVESTING.COM, Kenneth provides educational articles, news, market commentary, and other information regarding proven investment systems that work in good times and bad.
Comments contained in the body of this report are technical opinions only and are not necessarily those of Gruneisen Growth Corp. The material herein has been obtained from sources believed to be reliable and accurate, however, its accuracy and completeness cannot be guaranteed. Our firm, employees, and customers may effect transactions, including transactions contrary to any recommendation herein, or have positions in the securities mentioned herein or options with respect thereto. Any recommendation contained in this report may not be suitable for all investors and it is not to be deemed an offer or solicitation on our part with respect to the purchase or sale of any securities. |
|
 |
Financial, Tech and Commodity-Linked Groups Fell
Kenneth J. Gruneisen - Passed the CAN SLIM® Master's Exam
The Retail Index ($RLX -0.12%) edged lower while the Broker/Dealer Index ($XBD -0.56%) and Bank Index ($BKX -0.92%) both posted losses on Monday. The tech sector had a negative bias as the Semiconductor Index ($SOX -0.56%) and the Biotechnology Index ($BTK -1.62%) fell while the Networking Index ($NWX -0.07%) finished flat. Commodity-linked groups were weaker as the Gold & Silver Index ($XAU -0.62%) edged lower and the Oil Services Index ($OSX -2.81%) and the Integrated Oil Index ($XOI -1.42%) both suffered larger losses. Charts courtesy www.stockcharts.com
 PICTURED: The Retail Index ($RLX -0.12%) is consolidating above its 50-day moving average (DMA) line near its record high.
| Oil Services |
$OSX |
178.43 |
-5.46 |
-2.97% |
-2.92% |
| Integrated Oil |
$XOI |
1,230.48 |
-20.23 |
-1.62% |
-2.96% |
| Semiconductor |
$SOX |
953.51 |
-8.75 |
-0.91% |
+5.19% |
| Networking |
$NWX |
448.15 |
-1.04 |
-0.23% |
+0.46% |
| Broker/Dealer |
$XBD |
214.07 |
-2.72 |
-1.25% |
+4.28% |
| Retail |
$RLX |
1,394.80 |
-1.64 |
-0.12% |
+3.98% |
| Gold & Silver |
$XAU |
89.60 |
+0.02 |
+0.02% |
+13.62% |
| Bank |
$BKX |
91.99 |
-0.85 |
-0.92% |
+1.15% |
| Biotech |
$BTK |
3,137.57 |
-48.12 |
-1.51% |
+2.03% |
|
|
|
 |
Distributional Action While Retreating From Highs
Kenneth J. Gruneisen - Passed the CAN SLIM® Master's Exam
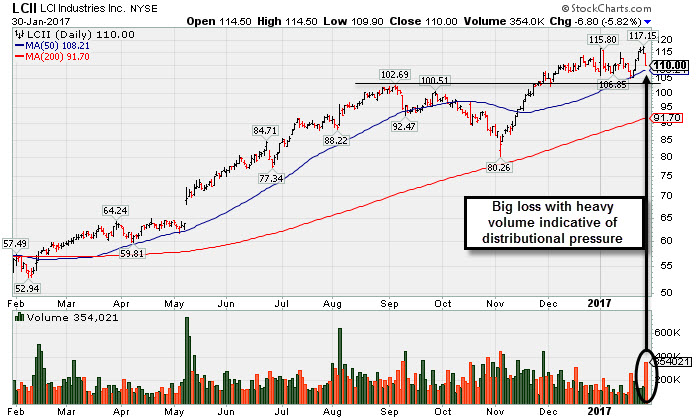
LCI Industries (LCII -$6.80 or -5.82% to $110.00) gapped down and suffered a big loss today with heavy volume indicative of distributional pressure. Its 50-day moving average (DMA) line ($108.21) defines the next important support level. The company, formerly known as Drew Industries (DW), was last shown in this FSU section on 12/30/16 with an annotated graph under the headline, "Consolidating Well Above Prior Highs and 50-Day Moving Average". It remains extended from any sound base. Prior highs in the $102 area define the next support to watch.
The high ranked Building - Mobile/Manufacturing & RV firm was highlighted in yellow with pivot point cited based on its 9/28/16 high in the 11/29/16 mid-day report (read here). It has seen the number of top-rated funds owning its shares rose from 311 in Dec '15 to 406 in Dec '16, a reassuring sign concerning the I criteria. Its current Up/Down Volume Ratio of 1.7 is an unbiased indication its shares have been under accumulation over the past 50 days. It has a Timeliness Rating of A, but a Sponsorship Rating of C at present.
Recently it reported Sep '16 quarterly earnings +70% on +19% sales revenues, marking its 4th consecutive quarterly comparison above the +25% minimum earnings guideline (C criteria). Its strong annual earnings (A criteria) history matches the fact-based investment system's fundamental guidelines.
|
|
|
Color Codes Explained :
Y - Better candidates highlighted by our
staff of experts.
G - Previously featured
in past reports as yellow but may no longer be buyable under the
guidelines.
***Last / Change / Volume data in this table is the closing quote data***
Symbol/Exchange
Company Name
Industry Group |
PRICE |
CHANGE
(%Change) |
Day High |
Volume
(% DAV)
(% 50 day avg vol) |
52 Wk Hi
% From Hi |
Featured
Date |
Price
Featured |
Pivot Featured |
|
Max Buy |
THO
-
NYSE
Thor Industries Inc
AUTOMOTIVE - Recreational Vehicles
|
$104.24
|
-0.95
-0.90% |
$105.19
|
548,824
76.76% of 50 DAV
50 DAV is 715,000
|
$108.45
-3.88%
|
1/24/2017
|
$100.52
|
PP = $108.45
|
|
MB = $113.87
|
 Most Recent Note - 1/30/2017 1:24:56 PM
Y - Rallied recently from support at its 50 DMA line ($100.43). It was highlighted in yellow in the 1/24/17 mid-day report as a new pivot point was cited based on its 12/07/16 high plus 10 cents (read here). Subsequent volume-driven gains for new highs are still needed to trigger a proper technical buy signal.
>>> FEATURED STOCK ARTICLE : Rose From Support at 50-Day Moving Average Line - 1/24/2017 |
View all notes |
Set NEW NOTE alert |
Company Profile |
SEC
News |
Chart |
Request a new note
C
A
S
I |
CSFL
-
NASDAQ
Centerstate Banks Inc
Banks-Southeast
|
$24.54
|
-0.37
-1.49% |
$24.78
|
325,225
109.50% of 50 DAV
50 DAV is 297,000
|
$26.30
-6.69%
|
10/10/2016
|
$18.20
|
PP = $18.37
|
|
MB = $19.29
|
Most Recent Note - 1/27/2017 5:24:44 PM
G - Pulled back today with near average volume after hitting a new high with a volume-driven gain on the prior session. Completed a new Public Offering of shares on 1/10/17 during its orderly consolidation. Its 50 DMA line ($24.28) and recent lows define near-term support to watch.
>>> FEATURED STOCK ARTICLE : Bank Stock Perched Near Record Highs After Considerable Rally - 1/4/2017 |
View all notes |
Set NEW NOTE alert |
Company Profile |
SEC
News |
Chart |
Request a new note
C
A
S
I |
IESC
-
NASDAQ
I E S Holdings Inc
Bldg-Maintenance and Svc
|
$19.55
|
-0.30
-1.51% |
$19.70
|
23,895
27.78% of 50 DAV
50 DAV is 86,000
|
$23.00
-15.00%
|
11/23/2016
|
$19.35
|
PP = $18.26
|
|
MB = $19.17
|
Most Recent Note - 1/30/2017 1:22:26 PM
G - Slumping back below its 50 DMA line raising concerns with below average volume behind today's 3rd consecutive loss. Recently found support near prior highs in the $18 area.
>>> FEATURED STOCK ARTICLE : Violated 50-Day Moving Average Line and Now Testing Prior Highs - 1/19/2017 |
View all notes |
Set NEW NOTE alert |
Company Profile |
SEC
News |
Chart |
Request a new note
C
A
S
I |
BERY
-
NYSE
Berry Plastics Group Inc
CONSUMER NON-DURABLES - Packaging and Containers
|
$50.71
|
-0.82
-1.59% |
$51.34
|
1,490,176
114.01% of 50 DAV
50 DAV is 1,307,000
|
$52.97
-4.27%
|
11/30/2016
|
$50.26
|
PP = $46.47
|
|
MB = $48.79
|
Most Recent Note - 1/30/2017 1:29:03 PM
G - Pulling back from all-time highs with today's 4th consecutive loss. Insider buying reported in recent weeks is a reassuring sign. Its 50 DMA line ($49.72) defines support to watch above recent lows in the $48.50 area.
>>> FEATURED STOCK ARTICLE : Orderly Consolidation Continues Well Above Support - 1/3/2017 |
View all notes |
Set NEW NOTE alert |
Company Profile |
SEC
News |
Chart |
Request a new note
C
A
S
I |
EVR
-
NYSE
Evercore Partners Inc
FINANCIAL SERVICES - Investment Banking
|
$76.90
|
-0.60
-0.77% |
$77.40
|
336,017
83.38% of 50 DAV
50 DAV is 403,000
|
$77.60
-0.90%
|
1/5/2017
|
$71.40
|
PP = $72.07
|
|
MB = $75.67
|
Most Recent Note - 1/30/2017 12:56:53 PM
Y - Wedged higher with today's gain lacking great volume conviction. Its 50 DMA line ($68.95) defines support above prior highs. Concerns remain because volume behind all gains has been light since a new pivot point was cited based on its 12/08/16 high plus 10 cents - "Gains above a pivot point must have a minimum of +40% above average volume to trigger a proper new (or add-on) technical buy signal.)
>>> FEATURED STOCK ARTICLE : Perched Near All-Time High Building New Flat Base - 1/5/2017 |
View all notes |
Set NEW NOTE alert |
Company Profile |
SEC
News |
Chart |
Request a new note
C
A
S
I |
Symbol/Exchange
Company Name
Industry Group |
PRICE |
CHANGE
(%Change) |
Day High |
Volume
(% DAV)
(% 50 day avg vol) |
52 Wk Hi
% From Hi |
Featured
Date |
Price
Featured |
Pivot Featured |
|
Max Buy |
HTHT
-
NASDAQ
China Lodging Group Ads
LEISURE - Lodging
|
$53.93
|
+0.02
0.04% |
$54.34
|
194,070
115.52% of 50 DAV
50 DAV is 168,000
|
$55.00
-1.95%
|
9/29/2016
|
$46.12
|
PP = $47.82
|
|
MB = $50.21
|
Most Recent Note - 1/26/2017 1:08:35 PM
G - Hitting new all-time highs with today's 5th consecutive gain. Recently found support at its 50 DMA line ($49.56). Repeatedly noted with caution in prior reports - "Reported earnings +10% on +6% sales revenues for the Sep '16 quarter, below the +25% minimum earnings guideline (C criteria), raising concerns."
>>> FEATURED STOCK ARTICLE : Slump Below "Max Buy" Level But Fundamental Concerns Were Raised - 1/6/2017 |
View all notes |
Set NEW NOTE alert |
Company Profile |
SEC
News |
Chart |
Request a new note
C
A
S
I |
DW
-
NYSE
LCI Industries
MATERIALS and CONSTRUCTION - General Building Materials
|
$110.00
|
-6.80
-5.82% |
$114.50
|
354,021
196.46% of 50 DAV
50 DAV is 180,200
|
$117.15
-6.10%
|
11/29/2016
|
$106.29
|
PP = $101.00
|
|
MB = $106.05
|
Most Recent Note - 1/30/2017 1:00:06 PM
Gapped down today. Its 50 DMA line ($108.28) defines the next important support level. Drew Industries (DW) coverage continues under its new name LCI Industries LCII) .
>>> FEATURED STOCK ARTICLE : Consolidating Well Above Prior Highs and 50-Day Moving Average - 12/30/2016 |
View all notes |
Set NEW NOTE alert |
Company Profile |
SEC
News |
Chart |
Request a new note
C
A
S
I |
LMAT
-
NASDAQ
Lemaitre Vascular Inc
Medical-Products
|
$22.69
|
-0.73
-3.12% |
$23.33
|
58,268
45.88% of 50 DAV
50 DAV is 127,000
|
$27.04
-16.08%
|
12/22/2016
|
$24.99
|
PP = $25.09
|
|
MB = $26.34
|
Most Recent Note - 1/30/2017 1:26:40 PM
G - Quietly slumping further below its 50 DMA line today. A rebound above its 50 DMA line ($23.97) is needed for its outlook to improve. See the latest FSU analysis for more details and an annotated graph.
>>> FEATURED STOCK ARTICLE : Concerns Increase While Lingering Below 50-Day Moving Average - 1/27/2017 |
View all notes |
Set NEW NOTE alert |
Company Profile |
SEC
News |
Chart |
Request a new note
C
A
S
I |
BEAT
-
NASDAQ
BioTelemetry Inc
Medical-Services
|
$22.25
|
-0.40
-1.77% |
$22.70
|
229,925
83.91% of 50 DAV
50 DAV is 274,000
|
$24.10
-7.68%
|
12/19/2016
|
$22.91
|
PP = $21.78
|
|
MB = $22.87
|
Most Recent Note - 1/26/2017 1:06:31 PM
Y - Consolidating above prior highs in the $21-22 area and above its 50 DMA line defining important near-term support to watch. Damaging losses leading to violations may trigger technical sell signals.
>>> FEATURED STOCK ARTICLE : Volume Totals Cooling While Consolidating Above Prior Highs - 1/10/2017 |
View all notes |
Set NEW NOTE alert |
Company Profile |
SEC
News |
Chart |
Request a new note
C
A
S
I |
PATK
-
NASDAQ
Patrick Industries Inc
WHOLESALE - Building Materials Wholesale
|
$81.55
|
-1.85
-2.22% |
$83.13
|
98,795
82.33% of 50 DAV
50 DAV is 120,000
|
$83.50
-2.34%
|
11/29/2016
|
$72.45
|
PP = $69.63
|
|
MB = $73.11
|
Most Recent Note - 1/30/2017 1:27:28 PM
G - Pulling back from all-time highs, extended from its prior base. Its 50 DMA line ($75.60) defines support to watch on pullbacks.
>>> FEATURED STOCK ARTICLE : Stubbornly Held Ground and Rose Since Featured Again - 12/28/2016 |
View all notes |
Set NEW NOTE alert |
Company Profile |
SEC
News |
Chart |
Request a new note
C
A
S
I |
Symbol/Exchange
Company Name
Industry Group |
PRICE |
CHANGE
(%Change) |
Day High |
Volume
(% DAV)
(% 50 day avg vol) |
52 Wk Hi
% From Hi |
Featured
Date |
Price
Featured |
Pivot Featured |
|
Max Buy |
ESNT
-
NYSE
Essent Group Ltd
Finance-MrtgandRel Svc
|
$34.43
|
+0.12
0.35% |
$35.00
|
950,753
138.59% of 50 DAV
50 DAV is 686,000
|
$34.78
-1.01%
|
1/25/2017
|
$34.09
|
PP = $34.04
|
|
MB = $35.74
|
Most Recent Note - 1/30/2017 1:21:05 PM
Y - Touched a new high with today's early gain approaching its "max buy" level. Gain with +107% above average volume on 1/25/17 triggered a technical buy signal. Its 50 DMA line and recent lows define important near-term support to watch.
>>> FEATURED STOCK ARTICLE : Twice Average Volume Behind Big Breakout Gain - 1/25/2017 |
View all notes |
Set NEW NOTE alert |
Company Profile |
SEC
News |
Chart |
Request a new note
C
A
S
I |
ANET
-
NYSE
Arista Networks Inc
TELECOMMUNICATIONS - Communication Equipment
|
$93.67
|
-0.11
-0.12% |
$94.06
|
367,927
47.23% of 50 DAV
50 DAV is 779,000
|
$103.00
-9.06%
|
12/30/2016
|
$96.77
|
PP = $99.00
|
|
MB = $103.95
|
Most Recent Note - 1/30/2017 1:16:51 PM
G - Met resistance at its 50 DMA line when rebounding after a damaging gap down on 1/17/17 triggering a technical sell signal. A rebound above its 50 DMA line ($95.18) is needed for its outlook to improve.
>>> FEATURED STOCK ARTICLE : Technical Damages Raised Concern and Triggered Technical Sell Signal - 1/18/2017 |
View all notes |
Set NEW NOTE alert |
Company Profile |
SEC
News |
Chart |
Request a new note
C
A
S
I |
VBTX
-
NASDAQ
Veritex Holdings Inc
BANKING - Regional - Southwest Banks
|
$26.75
|
-0.34
-1.26% |
$27.11
|
119,401
157.11% of 50 DAV
50 DAV is 76,000
|
$28.61
-6.50%
|
1/23/2017
|
$27.30
|
PP = $27.87
|
|
MB = $29.26
|
Most Recent Note - 1/27/2017 5:27:31 PM
Y - Met mild distributional pressure this week after its 1/25/17 gain was backed by +38% above average volume while trying to break out from a short flat base. Members were previously reminded - "A gain above the pivot point backed by at least +40% above average volume is needed to trigger a proper technical buy signal. Reported Dec '16 quarterly earnings +17% on +26% sales revenues, below the +25% minimum guideline (C criteria) for buy candidates, raising fundamental concerns. Completed a new Public Offering on 12/15/16 See the latest FSU analysis for more details and an annotated graph."
>>> FEATURED STOCK ARTICLE : Challenged Highs But Ended in Bottom Third of Intra-day Range - 1/23/2017 |
View all notes |
Set NEW NOTE alert |
Company Profile |
SEC
News |
Chart |
Request a new note
C
A
S
I |
SFBS
-
NASDAQ
Servisfirst Bancshares
BANKING - Regional - Southeast Banks
|
$38.06
|
-0.87
-2.23% |
$38.71
|
182,872
68.24% of 50 DAV
50 DAV is 268,000
|
$39.26
-3.06%
|
7/19/2016
|
$26.64
|
PP = $26.41
|
|
MB = $27.73
|
Most Recent Note - 1/30/2017 1:23:26 PM
G - Quietly pulling back today after challenging prior highs. Recent low and its 50 DMA line define important near-term support in the $35-36 area where subsequent violations would raise concerns.
>>> FEATURED STOCK ARTICLE : Stubbornly Holding Ground Near Highs - 1/12/2017 |
View all notes |
Set NEW NOTE alert |
Company Profile |
SEC
News |
Chart |
Request a new note
C
A
S
I |
LCII
-
NYSE
L C I Industries
MATERIALS and CONSTRUCTION - General Building Materials
|
$110.00
|
-6.80
-5.82% |
$114.50
|
354,021
196.68% of 50 DAV
50 DAV is 180,000
|
$117.15
-6.10%
|
11/29/2016
|
$106.29
|
PP = $101.00
|
|
MB = $106.05
|
Most Recent Note - 1/30/2017 5:44:54 PM
G - Encountering distributional pressure. Subsequent losses violating its 50 DMA line ($108) and prior lows may trigger technical sell signals. Mostly bullish action has followed since Drew Industries (DW) announced a new name LCI Industries (LCII). See the latest FSU analysis for more details and a new annotated graph.
>>> FEATURED STOCK ARTICLE : Distributional Action While Retreating From Highs - 1/30/2017 |
View all notes |
Set NEW NOTE alert |
Company Profile |
SEC
News |
Chart |
Request a new note
C
A
S
I |
Symbol/Exchange
Company Name
Industry Group |
PRICE |
CHANGE
(%Change) |
Day High |
Volume
(% DAV)
(% 50 day avg vol) |
52 Wk Hi
% From Hi |
Featured
Date |
Price
Featured |
Pivot Featured |
|
Max Buy |
|
|
|
THESE ARE NOT BUY RECOMMENDATIONS!
Comments contained in the body of this report are technical
opinions only. The material herein has been obtained
from sources believed to be reliable and accurate, however,
its accuracy and completeness cannot be guaranteed.
This site is not an investment advisor, hence it does
not endorse or recommend any securities or other investments.
Any recommendation contained in this report may not
be suitable for all investors and it is not to be deemed
an offer or solicitation on our part with respect to
the purchase or sale of any securities. All trademarks,
service marks and trade names appearing in this report
are the property of their respective owners, and are
likewise used for identification purposes only.
This report is a service available
only to active Paid Premium Members.
You may opt-out of receiving report notifications
at any time. Questions or comments may be submitted
by writing to Premium Membership Services 665 S.E. 10 Street, Suite 201 Deerfield Beach, FL 33441-5634 or by calling 1-800-965-8307
or 954-785-1121.
|
|
|