You are not logged in.
This means you
CAN ONLY VIEW reports that were published prior to Wednesday, April 2, 2025.
You
MUST UPGRADE YOUR MEMBERSHIP if you want to see any current reports.
AFTER MARKET UPDATE - MONDAY, FEBRUARY 6TH, 2017
Previous After Market Report Next After Market Report >>>
|
|
|
|
DOW |
-19.04 |
20,052.42 |
-0.09% |
|
Volume |
935,588,470 |
-7% |
|
Volume |
1,572,788,330 |
-3% |
|
NASDAQ |
-3.22 |
5,663.55 |
-0.06% |
|
Advancers |
1,116 |
38% |
|
Advancers |
1,049 |
37% |
|
S&P 500 |
-4.86 |
2,292.56 |
-0.21% |
|
Decliners |
1,810 |
62% |
|
Decliners |
1,813 |
63% |
|
Russell 2000 |
-11.18 |
1,366.66 |
-0.81% |
|
52 Wk Highs |
134 |
|
|
52 Wk Highs |
121 |
|
|
S&P 600 |
-7.58 |
833.76 |
-0.90% |
|
52 Wk Lows |
10 |
|
|
52 Wk Lows |
25 |
|
|
 |
Major Indices Fell Slightly With Lighter Volume
Kenneth J. Gruneisen - Passed the CAN SLIM® Master's Exam
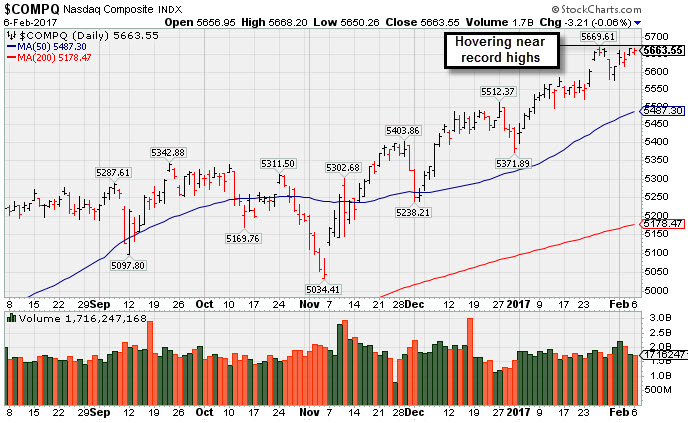
Stocks finished lower on Monday. The Dow was down 19 points to 20052. The S&P 500 lost 4 points to 2292 and the Nasdaq Composite fell 3 points to 5663. Volume totals were lighter than the prior session totals on the NYSE and on the Nasdaq exchange. Breadth was negative as decliners led advancers by a 3-2 margin the NYSE and on the Nasdaq exchange. There were 32 high-ranked companies from the Leaders List that made new 52-week highs and were listed on the BreakOuts Page, versus the total of 43 on the prior session. New 52-week highs totals contracted yet still solidly outnumbered new 52-week lows on both the NYSE and the Nasdaq exchange.
PICTURED: The Nasdaq Composite Index is hovering near record highs, well above its 50-day moving average (DMA) line.
Leadership remains healthy as the major averages' (M criteria) have maintained an upward trend. New buying efforts should only be made in candidates with superior fundamental and technical characteristics. The Featured Stocks Page lists noteworthy high-ranked leaders.
The major averages declined on the session Monday as Energy shares retreated and investors digested mixed corporate earnings releases. So far this earnings season, 75% of companies in the S&P 500 have topped analyst profit expectations. Overseas, European Central Bank President Mario Draghi told members of the European Parliament that its monetary stimulus efforts are still very much needed to support the continent’s economic recovery.
Nine of 11 sectors in the S&P 500 ended in negative territory. Energy shares led the losses with Marathon Oil (MRO -4.12%) falling. However, shares of Cabot Oil & Gas (COG +10.73%) advanced after being the subject of positive analyst commentary. In earnings, Newell Brands (NWL -5.67%) fell as the company posted weaker-than-expected quarterly revenue. Tyson Foods (TSN -3.46%) fell amid reports the SEC is investigating the meat producer on the manipulation of chicken prices. In the consumer space, Sysco Corp (SYY -2.55%) fell despite quarterly sales matching Wall Street forecasts. Hasbro (HAS +14.14%) posted a "breakaway gap" to record highs after the toy maker beat profit expectations by a wide margin.
Treasuries advanced with the benchmark 10-year note up 14/32 to yield 2.41%. In commodities, NYMEX WTI crude lost 1.4% to $53.10/barrel. COMEX gold added 0.9% to $1230.00/ounce. |
 Kenneth J. Gruneisen started out as a licensed stockbroker in August 1987, a couple of months prior to the historic stock market crash that took the Dow Jones Industrial Average down -22.6% in a single day. He has published daily fact-based fundamental and technical analysis on high-ranked stocks online for two decades. Through FACTBASEDINVESTING.COM, Kenneth provides educational articles, news, market commentary, and other information regarding proven investment systems that work in good times and bad.
Comments contained in the body of this report are technical opinions only and are not necessarily those of Gruneisen Growth Corp. The material herein has been obtained from sources believed to be reliable and accurate, however, its accuracy and completeness cannot be guaranteed. Our firm, employees, and customers may effect transactions, including transactions contrary to any recommendation herein, or have positions in the securities mentioned herein or options with respect thereto. Any recommendation contained in this report may not be suitable for all investors and it is not to be deemed an offer or solicitation on our part with respect to the purchase or sale of any securities. |
|
 |
Gold & Silver Index Outpaced Semiconductors and Biotechs
Kenneth J. Gruneisen - Passed the CAN SLIM® Master's Exam
The Broker/Dealer Index ($XBD -0.20%) and Bank Index ($BKX -0.40%) both edged lower on Monday and the Retail Index ($RLX -0.55%) also fell. The tech sector was led higher by the Biotechnology Index ($BTK +0.33%) and Semiconductor Index ($SOX +0.35%) but the Networking Index ($NWX -0.35%) edged lower. The Oil Services Index ($OSX -1.96%) and the Integrated Oil Index ($XOI -0.96%) but lost ground, meanwhile the Gold & Silver Index ($XAU +3.51%) was a standout gainer. Charts courtesy www.stockcharts.com
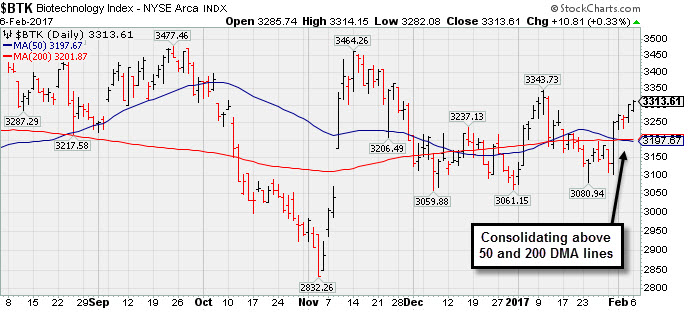 PICTURED: The Biotechnology Index ($BTK +0.33%) is consolidating above its 50-day and 200-day moving average (DMA) lines.
| Oil Services |
$OSX |
179.53 |
-3.59 |
-1.96% |
-2.32% |
| Integrated Oil |
$XOI |
1,226.39 |
-11.89 |
-0.96% |
-3.28% |
| Semiconductor |
$SOX |
967.39 |
+3.37 |
+0.35% |
+6.72% |
| Networking |
$NWX |
454.13 |
-1.59 |
-0.35% |
+1.80% |
| Broker/Dealer |
$XBD |
219.92 |
-0.45 |
-0.20% |
+7.13% |
| Retail |
$RLX |
1,377.40 |
-7.55 |
-0.55% |
+2.56% |
| Gold & Silver |
$XAU |
96.19 |
+3.27 |
+3.52% |
+21.98% |
| Bank |
$BKX |
92.76 |
-0.37 |
-0.40% |
+1.06% |
| Biotech |
$BTK |
3,313.61 |
+10.81 |
+0.33% |
+7.76% |
|
|
|
 |
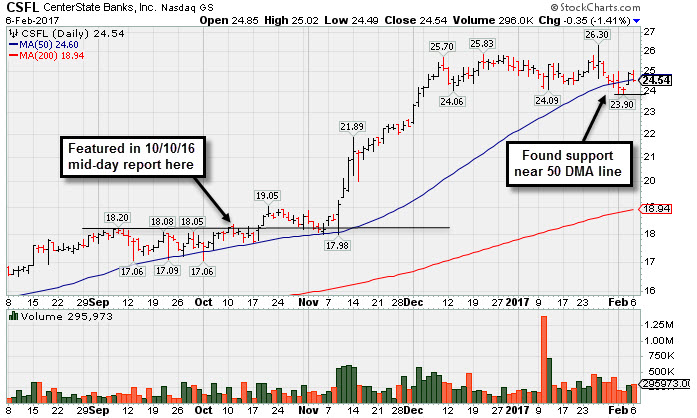
Found Support Near 50-Day Average Following Offering
Kenneth J. Gruneisen - Passed the CAN SLIM® Master's Exam
Centerstate Banks Inc (CSFL -$0.35 or -1.41% to $24.54) pulled back today. It gapped up for a big gain on the prior session and rebounded above its 50-day moving average (DMA) line helping its outlook improve. Subsequent losses leading to deterioration below the 50 DMA line or damaging losses below the recent low ($23.90 last week) would raise concerns and trigger a technical sell signal.
It completed a new Public Offering of shares on 1/10/17, shortly after it was last shown in this FSU section on 1/04/16 with an annotated graph under the headline, "Bank Stock Perched Near Record Highs After Considerable Rally". Such offerings often help companies to attract greater institutional ownership interest, although they can also hinder upward price progress for a while. The number of top-rated funds owning its shares rose from 180 in Jun '15 to 266 in Dec '16, a reassuring sign. Its current Up/Down Volume ratio of 1.2 is an unbiased indication its shares have been under only slight accumulation over the past 50 days (I criteria). It currently has a Timeliness Rating of A and a Sponsorship rating of B.
The Dec '16 quarter marked its 9th consecutive earnings increase above the +25% minimum guideline (C criteria), and its annual earnings (A criteria) history has been good. Its small supply of only 48.4 millions shares (S criteria) in the public float can contribute to greater price volatility in the event of institutional buying or selling. It remains up +34.8% since highlighted in yellow at $18.20 in the 10/10/16 mid-day report (read here). CSFL was first featured at $15.80 in the 5/27/16 mid-day report (read here). |
|
|
Color Codes Explained :
Y - Better candidates highlighted by our
staff of experts.
G - Previously featured
in past reports as yellow but may no longer be buyable under the
guidelines.
***Last / Change / Volume data in this table is the closing quote data***
Symbol/Exchange
Company Name
Industry Group |
PRICE |
CHANGE
(%Change) |
Day High |
Volume
(% DAV)
(% 50 day avg vol) |
52 Wk Hi
% From Hi |
Featured
Date |
Price
Featured |
Pivot Featured |
|
Max Buy |
THO
-
NYSE
Thor Industries Inc
AUTOMOTIVE - Recreational Vehicles
|
$104.47
|
-0.31
-0.30% |
$105.25
|
314,050
44.29% of 50 DAV
50 DAV is 709,000
|
$108.45
-3.67%
|
1/24/2017
|
$100.52
|
PP = $108.45
|
|
MB = $113.87
|
 Most Recent Note - 2/6/2017 6:12:43 PM
Y - Consolidating in an orderly fashion above support at its 50 DMA line ($102.13). It was highlighted in yellow in the 1/24/17 mid-day report as a new pivot point was cited based on its 12/07/16 high plus 10 cents (read here). Subsequent volume-driven gains for new highs are still needed to trigger a proper technical buy signal.
>>> FEATURED STOCK ARTICLE : Rose From Support at 50-Day Moving Average Line - 1/24/2017 |
View all notes |
Set NEW NOTE alert |
Company Profile |
SEC
News |
Chart |
Request a new note
C
A
S
I |
CSFL
-
NASDAQ
Centerstate Banks Inc
Banks-Southeast
|
$24.54
|
-0.35
-1.41% |
$25.02
|
295,973
98.33% of 50 DAV
50 DAV is 301,000
|
$26.30
-6.69%
|
10/10/2016
|
$18.20
|
PP = $18.37
|
|
MB = $19.29
|
Most Recent Note - 2/6/2017 5:54:12 PM
G - Consolidating after gapping up on the prior session finding support near its 50 DMA line. Completed a new Public Offering of shares on 1/10/17. See the latest FSU analysis for more details and a new annotated graph.
>>> FEATURED STOCK ARTICLE : Found Support Near 50-Day Average Following Offering - 2/6/2017 |
View all notes |
Set NEW NOTE alert |
Company Profile |
SEC
News |
Chart |
Request a new note
C
A
S
I |
IESC
-
NASDAQ
I E S Holdings Inc
Bldg-Maintenance and Svc
|
$19.60
|
-0.15
-0.76% |
$19.80
|
31,342
39.18% of 50 DAV
50 DAV is 80,000
|
$23.00
-14.78%
|
11/23/2016
|
$19.35
|
PP = $18.26
|
|
MB = $19.17
|
Most Recent Note - 2/2/2017 5:56:17 PM
G - Slumped back below its 50 DMA line again today raising concerns. Prior low ($18.05 on 1/18/17) defines important support near prior highs.
>>> FEATURED STOCK ARTICLE : Violated 50-Day Moving Average Line and Now Testing Prior Highs - 1/19/2017 |
View all notes |
Set NEW NOTE alert |
Company Profile |
SEC
News |
Chart |
Request a new note
C
A
S
I |
BERY
-
NYSE
Berry Plastics Group Inc
CONSUMER NON-DURABLES - Packaging and Containers
|
$49.41
|
-1.08
-2.14% |
$50.15
|
2,250,866
164.42% of 50 DAV
50 DAV is 1,369,000
|
$52.97
-6.72%
|
11/30/2016
|
$50.26
|
PP = $46.47
|
|
MB = $48.79
|
Most Recent Note - 2/6/2017 6:15:41 PM
G - Slumping below its 50 DMA line ($50.20) with volume-driven losses raising concerns. Recent lows in the $48.50 area define near-term support where a violation would trigger a technical sell signal. Reported earnings +43% on -7% sales revenues for the Dec '16 quarter.
>>> FEATURED STOCK ARTICLE : Orderly Consolidation Continues Well Above Support - 1/3/2017 |
View all notes |
Set NEW NOTE alert |
Company Profile |
SEC
News |
Chart |
Request a new note
C
A
S
I |
EVR
-
NYSE
Evercore Partners Inc
FINANCIAL SERVICES - Investment Banking
|
$81.15
|
+1.15
1.44% |
$81.75
|
703,595
166.73% of 50 DAV
50 DAV is 422,000
|
$80.20
1.18%
|
1/5/2017
|
$71.40
|
PP = $72.07
|
|
MB = $75.67
|
Most Recent Note - 2/6/2017 12:23:29 PM
G - Technically strong, hitting new highs with today's 5th consecutive volume-driven gain, getting very extended from its prior base. Recently reported Dec '16 quarterly earnings +17% on +9% sales revenues, below the +25% minimum earnings guideline (C criteria), raising fundamental concerns.
>>> FEATURED STOCK ARTICLE : Perched Near All-Time High Building New Flat Base - 1/5/2017 |
View all notes |
Set NEW NOTE alert |
Company Profile |
SEC
News |
Chart |
Request a new note
C
A
S
I |
Symbol/Exchange
Company Name
Industry Group |
PRICE |
CHANGE
(%Change) |
Day High |
Volume
(% DAV)
(% 50 day avg vol) |
52 Wk Hi
% From Hi |
Featured
Date |
Price
Featured |
Pivot Featured |
|
Max Buy |
HTHT
-
NASDAQ
China Lodging Group Ads
LEISURE - Lodging
|
$55.10
|
-2.45
-4.26% |
$57.96
|
126,724
75.88% of 50 DAV
50 DAV is 167,000
|
$59.20
-6.93%
|
9/29/2016
|
$46.12
|
PP = $47.82
|
|
MB = $50.21
|
Most Recent Note - 2/3/2017 5:03:10 PM
G - Gapped up today and hit a new all-time high. Prior highs in the $54 area define near-term support above its 50 DMA line ($50.62). Repeatedly noted with caution in prior reports - "Reported earnings +10% on +6% sales revenues for the Sep '16 quarter, below the +25% minimum earnings guideline (C criteria), raising concerns."
>>> FEATURED STOCK ARTICLE : Slump Below "Max Buy" Level But Fundamental Concerns Were Raised - 1/6/2017 |
View all notes |
Set NEW NOTE alert |
Company Profile |
SEC
News |
Chart |
Request a new note
C
A
S
I |
LMAT
-
NASDAQ
Lemaitre Vascular Inc
Medical-Products
|
$22.49
|
-0.53
-2.30% |
$22.90
|
143,711
123.89% of 50 DAV
50 DAV is 116,000
|
$27.04
-16.82%
|
12/22/2016
|
$24.99
|
PP = $25.09
|
|
MB = $26.34
|
Most Recent Note - 2/6/2017 6:08:17 PM
G - Sank further below its 50 DMA line with above average volume behind today's loss. Its Relative Strength Rating has fallen to 79, below the 80+ minimum guideline for buy candidates.A rebound above its 50 DMA line ($23.82) is needed for its outlook to improve.
>>> FEATURED STOCK ARTICLE : Concerns Increase While Lingering Below 50-Day Moving Average - 1/27/2017 |
View all notes |
Set NEW NOTE alert |
Company Profile |
SEC
News |
Chart |
Request a new note
C
A
S
I |
BEAT
-
NASDAQ
BioTelemetry Inc
Medical-Services
|
$23.90
|
-0.25
-1.04% |
$24.45
|
247,743
88.48% of 50 DAV
50 DAV is 280,000
|
$24.15
-1.04%
|
12/19/2016
|
$22.91
|
PP = $21.78
|
|
MB = $22.87
|
Most Recent Note - 2/3/2017 5:08:20 PM
G - Hit a new high with today's 4th consecutive gain backed by near average volume. Prior highs in the $21-22 area and its 50 DMA line define important near-term support to watch.
>>> FEATURED STOCK ARTICLE : Volume Totals Cooling While Consolidating Above Prior Highs - 1/10/2017 |
View all notes |
Set NEW NOTE alert |
Company Profile |
SEC
News |
Chart |
Request a new note
C
A
S
I |
PATK
-
NASDAQ
Patrick Industries Inc
WHOLESALE - Building Materials Wholesale
|
$81.00
|
-0.20
-0.25% |
$82.25
|
62,193
51.40% of 50 DAV
50 DAV is 121,000
|
$83.50
-2.99%
|
11/29/2016
|
$72.45
|
PP = $69.63
|
|
MB = $73.11
|
Most Recent Note - 2/6/2017 6:09:54 PM
G - Still quietly perched near all-time highs, extended from its prior base. Its 50 DMA line ($77.02) defines support to watch above prior highs.
>>> FEATURED STOCK ARTICLE : Perched Near All-Time High Extended From Prior Base - 1/31/2017 |
View all notes |
Set NEW NOTE alert |
Company Profile |
SEC
News |
Chart |
Request a new note
C
A
S
I |
ESNT
-
NYSE
Essent Group Ltd
Finance-MrtgandRel Svc
|
$35.72
|
-0.19
-0.53% |
$36.28
|
565,620
84.93% of 50 DAV
50 DAV is 666,000
|
$36.07
-0.97%
|
1/25/2017
|
$34.09
|
PP = $34.04
|
|
MB = $35.74
|
Most Recent Note - 2/3/2017 5:00:25 PM
G - Posted a gain with light volume today rising above its "max buy" level and its color code is changed to green. Its 50 DMA line ($32.53) defines important near-term support above prior lows in the $31.50 area.
>>> FEATURED STOCK ARTICLE : Twice Average Volume Behind Big Breakout Gain - 1/25/2017 |
View all notes |
Set NEW NOTE alert |
Company Profile |
SEC
News |
Chart |
Request a new note
C
A
S
I |
Symbol/Exchange
Company Name
Industry Group |
PRICE |
CHANGE
(%Change) |
Day High |
Volume
(% DAV)
(% 50 day avg vol) |
52 Wk Hi
% From Hi |
Featured
Date |
Price
Featured |
Pivot Featured |
|
Max Buy |
ANET
-
NYSE
Arista Networks Inc
TELECOMMUNICATIONS - Communication Equipment
|
$95.51
|
-0.01
-0.01% |
$96.12
|
358,550
49.12% of 50 DAV
50 DAV is 730,000
|
$103.00
-7.27%
|
12/30/2016
|
$96.77
|
PP = $99.00
|
|
MB = $103.95
|
Most Recent Note - 2/6/2017 5:58:26 PM
G - Consolidating near its 50 DMA line ($95.60) with volume totals cooling while rebounding after a damaging gap down on 1/17/17. Subsequent losses on above average volume would raise greater concerns.
>>> FEATURED STOCK ARTICLE : Technical Damages Raised Concern and Triggered Technical Sell Signal - 1/18/2017 |
View all notes |
Set NEW NOTE alert |
Company Profile |
SEC
News |
Chart |
Request a new note
C
A
S
I |
VBTX
-
NASDAQ
Veritex Holdings Inc
BANKING - Regional - Southwest Banks
|
$28.64
|
-0.61
-2.09% |
$29.26
|
76,619
86.09% of 50 DAV
50 DAV is 89,000
|
$29.33
-2.35%
|
1/23/2017
|
$27.30
|
PP = $27.87
|
|
MB = $29.26
|
Most Recent Note - 2/3/2017 5:06:40 PM
Y - Hit a new high with today's big gain backed by +51% above average volume clinching a technical buy signal, however it closed near the previously cited "max buy" level.
>>> FEATURED STOCK ARTICLE : Challenged Highs But Ended in Bottom Third of Intra-day Range - 1/23/2017 |
View all notes |
Set NEW NOTE alert |
Company Profile |
SEC
News |
Chart |
Request a new note
C
A
S
I |
SFBS
-
NASDAQ
Servisfirst Bancshares
BANKING - Regional - Southeast Banks
|
$40.05
|
-0.51
-1.26% |
$40.84
|
125,641
48.14% of 50 DAV
50 DAV is 261,000
|
$41.16
-2.70%
|
7/19/2016
|
$26.64
|
PP = $26.41
|
|
MB = $27.73
|
Most Recent Note - 2/6/2017 6:11:41 PM
G - Holding its ground near all-time highs. Recently reported earnings +8% on +20% sales revenues for the Dec '16 quarter, below the +25% minimum guideline (C criteria), raising fundamental concerns. Its 50 DMA line ($37.52) defines important near-term support above recent lows in the $36 area. Subsequent violations would trigger technical sell signals.
>>> FEATURED STOCK ARTICLE : Stubbornly Holding Ground Near Highs - 1/12/2017 |
View all notes |
Set NEW NOTE alert |
Company Profile |
SEC
News |
Chart |
Request a new note
C
A
S
I |
LCII
-
NYSE
L C I Industries
MATERIALS and CONSTRUCTION - General Building Materials
|
$108.10
|
-0.15
-0.14% |
$108.85
|
90,727
51.55% of 50 DAV
50 DAV is 176,000
|
$117.15
-7.73%
|
11/29/2016
|
$106.29
|
PP = $101.00
|
|
MB = $106.05
|
Most Recent Note - 2/6/2017 6:04:54 PM
G - Sputtering just below its 50 DMA line ($109.10). Losses leading to deterioration below prior lows ($105.05 on 1/20/17) may trigger technical sell signals. Recently, Drew Industries (DW) announced a new name LCI Industries (LCII).
>>> FEATURED STOCK ARTICLE : Distributional Action While Retreating From Highs - 1/30/2017 |
View all notes |
Set NEW NOTE alert |
Company Profile |
SEC
News |
Chart |
Request a new note
C
A
S
I |
|
|
|
THESE ARE NOT BUY RECOMMENDATIONS!
Comments contained in the body of this report are technical
opinions only. The material herein has been obtained
from sources believed to be reliable and accurate, however,
its accuracy and completeness cannot be guaranteed.
This site is not an investment advisor, hence it does
not endorse or recommend any securities or other investments.
Any recommendation contained in this report may not
be suitable for all investors and it is not to be deemed
an offer or solicitation on our part with respect to
the purchase or sale of any securities. All trademarks,
service marks and trade names appearing in this report
are the property of their respective owners, and are
likewise used for identification purposes only.
This report is a service available
only to active Paid Premium Members.
You may opt-out of receiving report notifications
at any time. Questions or comments may be submitted
by writing to Premium Membership Services 665 S.E. 10 Street, Suite 201 Deerfield Beach, FL 33441-5634 or by calling 1-800-965-8307
or 954-785-1121.
|
|
|