You are not logged in.
This means you
CAN ONLY VIEW reports that were published prior to Wednesday, April 2, 2025.
You
MUST UPGRADE YOUR MEMBERSHIP if you want to see any current reports.
AFTER MARKET UPDATE - TUESDAY, FEBRUARY 7TH, 2017
Previous After Market Report Next After Market Report >>>
|
|
|
|
DOW |
+37.87 |
20,090.29 |
+0.19% |
|
Volume |
977,465,490 |
+4% |
|
Volume |
1,742,249,990 |
+11% |
|
NASDAQ |
+10.67 |
5,674.22 |
+0.19% |
|
Advancers |
1,331 |
45% |
|
Advancers |
1,186 |
42% |
|
S&P 500 |
+0.52 |
2,293.08 |
+0.02% |
|
Decliners |
1,595 |
54% |
|
Decliners |
1,651 |
58% |
|
Russell 2000 |
-5.60 |
1,361.06 |
-0.41% |
|
52 Wk Highs |
142 |
|
|
52 Wk Highs |
129 |
|
|
S&P 600 |
-3.30 |
830.46 |
-0.40% |
|
52 Wk Lows |
19 |
|
|
52 Wk Lows |
39 |
|
|
 |
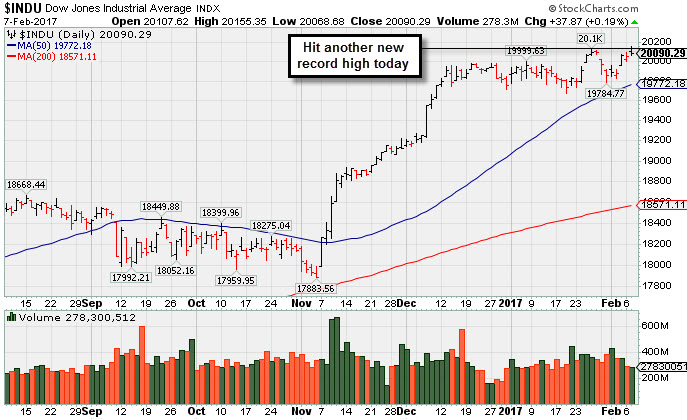
Nasdaq Composite and Dow Industrials Hit New Record Highs
Kenneth J. Gruneisen - Passed the CAN SLIM® Master's Exam
Stocks finished mostly higher on Tuesday. The Dow gained 37 points to 20090. The S&P 500 was flat at 2293 and the Nasdaq Composite advanced 10 points to 5674. Volume totals were higher than the prior session totals on the NYSE and on the Nasdaq exchange. Breadth was slightly negative as decliners led advancers by an 8-7 margin the NYSE and 4-3 on the Nasdaq exchange. There were 36 high-ranked companies from the Leaders List that made new 52-week highs and were listed on the BreakOuts Page, versus the total of 42 on the prior session. New 52-week highs totals still solidly outnumbered new 52-week lows on both the NYSE and the Nasdaq exchange.
PICTURED: The Dow Jones Industrial Average touched a new record high. It stayed well above its 50-day moving average (DMA) line during the recent consolidation.
Leadership remains healthy as the major averages' (M criteria) have maintained an upward trend. New buying efforts should only be made in candidates with superior fundamental and technical characteristics. The Featured Stocks Page lists noteworthy high-ranked leaders.
The major averages pared gains late in the session as investors digested a flurry of corporate earnings releases. Centene Corp (CNC +5.30%) rose amid strong quarterly results helped by more members and the acquisition of Health Net. The new General Motors Company (GM -4.7%) fell despite posting a record pre-tax profit in North America. On the data front, the Commerce Department reported the trade deficit narrowed to $44.3 billion in December from $45.2 billion the previous month.
Six of 11 sectors in the S&P 500 finished higher on the session with Consumer Staples and Tech stocks outperforming. Energy stocks led the losses in sympathy with a 1.6% decline for West Texas Intermediate crude to $52.19/barrel. Retail stocks underperformed as well with Michael Kors (KORS -10.8%) tumbling as quarterly revenue came in below Street forecasts. In Health Care, Teva Pharmaceuticals (TEVA -6.29%) fell amid reports the firm’s CEO is set to step down. Emerson Electric (EMR +4.55%) rose as the company raised full-year organic sales and earnings guidance.
Treasuries finished mixed with the yield curve flattening. Benchmark 10-year notes were up 3/32 to yield 2.40% after an up-and-down session. In FOREX, the Dollar Index added 0.4% on the session. |
 Kenneth J. Gruneisen started out as a licensed stockbroker in August 1987, a couple of months prior to the historic stock market crash that took the Dow Jones Industrial Average down -22.6% in a single day. He has published daily fact-based fundamental and technical analysis on high-ranked stocks online for two decades. Through FACTBASEDINVESTING.COM, Kenneth provides educational articles, news, market commentary, and other information regarding proven investment systems that work in good times and bad.
Comments contained in the body of this report are technical opinions only and are not necessarily those of Gruneisen Growth Corp. The material herein has been obtained from sources believed to be reliable and accurate, however, its accuracy and completeness cannot be guaranteed. Our firm, employees, and customers may effect transactions, including transactions contrary to any recommendation herein, or have positions in the securities mentioned herein or options with respect thereto. Any recommendation contained in this report may not be suitable for all investors and it is not to be deemed an offer or solicitation on our part with respect to the purchase or sale of any securities. |
|
 |
Retail and Semiconductor Indexes Rose Amid Broader Group Weakness
Kenneth J. Gruneisen - Passed the CAN SLIM® Master's Exam
The Retail Index ($RLX +0.29%) edged higher and the Broker/Dealer Index ($XBD +0.05%) held its ground but the Bank Index ($BKX -0.41%) edged lower on Tuesday. The tech sector was mixed as the Biotechnology Index ($BTK -0.60%) fell and the Semiconductor Index ($SOX +0.33%) rose but the Networking Index ($NWX -0.01) finished flat. The Oil Services Index ($OSX -1.02%) and the Integrated Oil Index ($XOI -1.57%) both lost ground, and the Gold & Silver Index ($XAU -0.93%) also fell. Charts courtesy www.stockcharts.com
 PICTURED: The Integrated Oil Index ($XOI -1.57%) has been slumping toward prior highs after violating its 50-day moving average (DMA) line.
| Oil Services |
$OSX |
177.69 |
-1.84 |
-1.02% |
-3.32% |
| Integrated Oil |
$XOI |
1,207.17 |
-19.22 |
-1.57% |
-4.80% |
| Semiconductor |
$SOX |
970.59 |
+3.20 |
+0.33% |
+7.07% |
| Networking |
$NWX |
454.07 |
-0.06 |
-0.01% |
+1.79% |
| Broker/Dealer |
$XBD |
220.04 |
+0.12 |
+0.05% |
+7.19% |
| Retail |
$RLX |
1,381.45 |
+4.05 |
+0.29% |
+2.86% |
| Gold & Silver |
$XAU |
95.29 |
-0.90 |
-0.94% |
+20.83% |
| Bank |
$BKX |
92.39 |
-0.38 |
-0.41% |
+0.65% |
| Biotech |
$BTK |
3,293.77 |
-19.84 |
-0.60% |
+7.11% |
|
|
|
 |
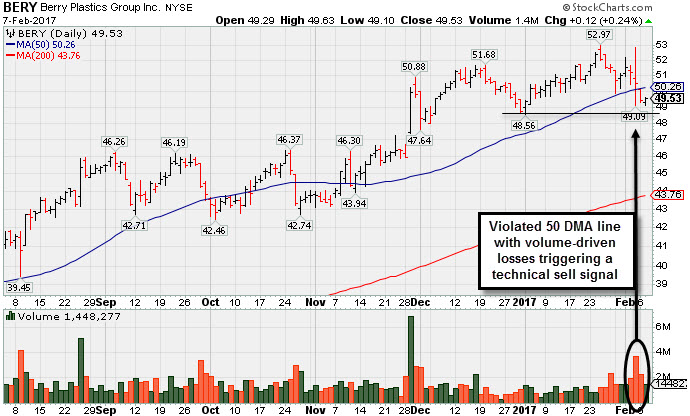
Recent 50-Day Violation Raised Concerns
Kenneth J. Gruneisen - Passed the CAN SLIM® Master's Exam
Berry Plastics Group Inc (BERY +$0.12 or +0.24% to $49.53) recently slumped below its 50-day moving average (DMA) line with volume-driven losses raising concerns and triggering a technical sell signal. Recent lows in the $48.50 area define the next near-term support where a violation would trigger a more worrisome technical sell signal.
Recently it reported earnings +43% on -7% sales revenues for the Dec '16 quarter. The lower sales revenues are noted as a cause for concern, especially after the 4 prior quarterly comparisons showed strong sales revenues increases in the +32-35% range. BERY was last shown in this FSU section on 1/03/17 with an annotated graph under the headline, "Orderly Consolidation Continues Well Above Support", as it was consolidating above its "max buy" level with volume totals generally cooling since its breakout. The high-ranked Containers/Packaging firm was highlighted in yellow with pivot point cited based on its 10/25/16 high plus 10 cents in the 11/30/16 mid-day report (read here). There was a "breakaway gap" on 11/29/16 powering to new 52-week highs with considerable volume-driven gains. A breakaway gap is one noted exception to the rule that investors should not chase a stock more than +5% above prior highs, however, risk increases the further above the pivot point one buys any stock.
Its annual earnings (A criteria) history has been strong. The number of top-rated funds owning its shares rose from 473 in Dec '15 to 588 in Dec '16, a reassuring sign concerning the I criteria. Its current Up/Down Volume Ratio of 0.9 is an unbiased indication its shares have been under accumulation over the past 50 days. It currently has a Timeliness Rating of A and a Sponsorship rating of C.
|
|
|
Color Codes Explained :
Y - Better candidates highlighted by our
staff of experts.
G - Previously featured
in past reports as yellow but may no longer be buyable under the
guidelines.
***Last / Change / Volume data in this table is the closing quote data***
Symbol/Exchange
Company Name
Industry Group |
PRICE |
CHANGE
(%Change) |
Day High |
Volume
(% DAV)
(% 50 day avg vol) |
52 Wk Hi
% From Hi |
Featured
Date |
Price
Featured |
Pivot Featured |
|
Max Buy |
THO
-
NYSE
Thor Industries Inc
AUTOMOTIVE - Recreational Vehicles
|
$104.51
|
+0.04
0.04% |
$104.67
|
429,717
61.13% of 50 DAV
50 DAV is 703,000
|
$108.45
-3.63%
|
1/24/2017
|
$100.52
|
PP = $108.45
|
|
MB = $113.87
|
Most Recent Note - 2/6/2017 6:12:43 PM
Y - Consolidating in an orderly fashion above support at its 50 DMA line ($102.13). It was highlighted in yellow in the 1/24/17 mid-day report as a new pivot point was cited based on its 12/07/16 high plus 10 cents (read here). Subsequent volume-driven gains for new highs are still needed to trigger a proper technical buy signal.
>>> FEATURED STOCK ARTICLE : Rose From Support at 50-Day Moving Average Line - 1/24/2017 |
View all notes |
Set NEW NOTE alert |
Company Profile |
SEC
News |
Chart |
Request a new note
C
A
S
I |
CSFL
-
NASDAQ
Centerstate Banks Inc
Banks-Southeast
|
$24.42
|
-0.12
-0.49% |
$24.65
|
192,453
63.31% of 50 DAV
50 DAV is 304,000
|
$26.30
-7.15%
|
10/10/2016
|
$18.20
|
PP = $18.37
|
|
MB = $19.29
|
Most Recent Note - 2/6/2017 5:54:12 PM
G - Consolidating after gapping up on the prior session finding support near its 50 DMA line. Completed a new Public Offering of shares on 1/10/17. See the latest FSU analysis for more details and a new annotated graph.
>>> FEATURED STOCK ARTICLE : Found Support Near 50-Day Average Following Offering - 2/6/2017 |
View all notes |
Set NEW NOTE alert |
Company Profile |
SEC
News |
Chart |
Request a new note
C
A
S
I |
IESC
-
NASDAQ
I E S Holdings Inc
Bldg-Maintenance and Svc
|
$18.95
|
-0.65
-3.32% |
$19.56
|
52,378
68.92% of 50 DAV
50 DAV is 76,000
|
$23.00
-17.61%
|
11/23/2016
|
$19.35
|
PP = $18.26
|
|
MB = $19.17
|
 Most Recent Note - 2/7/2017 5:40:30 PM
G - Slumping below its 50 DMA line recently raising concerns. Prior low ($18.05 on 1/18/17) defines important support near prior highs. Due to report Dec '16 quarterly results, and volume and volatility often increase near earnings news.
>>> FEATURED STOCK ARTICLE : Violated 50-Day Moving Average Line and Now Testing Prior Highs - 1/19/2017 |
View all notes |
Set NEW NOTE alert |
Company Profile |
SEC
News |
Chart |
Request a new note
C
A
S
I |
BERY
-
NYSE
Berry Plastics Group Inc
CONSUMER NON-DURABLES - Packaging and Containers
|
$49.53
|
+0.12
0.24% |
$49.63
|
1,448,277
104.12% of 50 DAV
50 DAV is 1,391,000
|
$52.97
-6.49%
|
11/30/2016
|
$50.26
|
PP = $46.47
|
|
MB = $48.79
|
Most Recent Note - 2/7/2017 5:38:04 PM
G - Slumped below its 50 DMA line with damaging volume-driven losses raising concerns. Recent lows in the $48.50 area define near-term support where a violation would trigger a more worrisome technical sell signal. Reported earnings +43% on -7% sales revenues for the Dec '16 quarter. See the latest FSU analysis for more details and a new annotated graph.
>>> FEATURED STOCK ARTICLE : Recent 50-Day Violation Raised Concerns - 2/7/2017 |
View all notes |
Set NEW NOTE alert |
Company Profile |
SEC
News |
Chart |
Request a new note
C
A
S
I |
EVR
-
NYSE
Evercore Partners Inc
FINANCIAL SERVICES - Investment Banking
|
$78.90
|
-2.25
-2.77% |
$80.00
|
903,901
211.69% of 50 DAV
50 DAV is 427,000
|
$81.75
-3.49%
|
1/5/2017
|
$71.40
|
PP = $72.07
|
|
MB = $75.67
|
Most Recent Note - 2/7/2017 12:21:50 PM
G - Pulling back today after 5 consecutive volume-driven gains, getting very extended from its prior base. Recently reported Dec '16 quarterly earnings +17% on +9% sales revenues, below the +25% minimum earnings guideline (C criteria), raising fundamental concerns.
>>> FEATURED STOCK ARTICLE : Perched Near All-Time High Building New Flat Base - 1/5/2017 |
View all notes |
Set NEW NOTE alert |
Company Profile |
SEC
News |
Chart |
Request a new note
C
A
S
I |
Symbol/Exchange
Company Name
Industry Group |
PRICE |
CHANGE
(%Change) |
Day High |
Volume
(% DAV)
(% 50 day avg vol) |
52 Wk Hi
% From Hi |
Featured
Date |
Price
Featured |
Pivot Featured |
|
Max Buy |
HTHT
-
NASDAQ
China Lodging Group Ads
LEISURE - Lodging
|
$55.15
|
+0.05
0.09% |
$55.49
|
35,669
21.11% of 50 DAV
50 DAV is 169,000
|
$59.20
-6.84%
|
9/29/2016
|
$46.12
|
PP = $47.82
|
|
MB = $50.21
|
Most Recent Note - 2/3/2017 5:03:10 PM
G - Gapped up today and hit a new all-time high. Prior highs in the $54 area define near-term support above its 50 DMA line ($50.62). Repeatedly noted with caution in prior reports - "Reported earnings +10% on +6% sales revenues for the Sep '16 quarter, below the +25% minimum earnings guideline (C criteria), raising concerns."
>>> FEATURED STOCK ARTICLE : Slump Below "Max Buy" Level But Fundamental Concerns Were Raised - 1/6/2017 |
View all notes |
Set NEW NOTE alert |
Company Profile |
SEC
News |
Chart |
Request a new note
C
A
S
I |
LMAT
-
NASDAQ
Lemaitre Vascular Inc
Medical-Products
|
$22.73
|
+0.24
1.07% |
$22.90
|
80,009
68.44% of 50 DAV
50 DAV is 116,900
|
$27.04
-15.93%
|
12/22/2016
|
$24.99
|
PP = $25.09
|
|
MB = $26.34
|
Most Recent Note - 2/6/2017 6:08:17 PM
G - Sank further below its 50 DMA line with above average volume behind today's loss. Its Relative Strength Rating has fallen to 79, below the 80+ minimum guideline for buy candidates.A rebound above its 50 DMA line ($23.82) is needed for its outlook to improve.
>>> FEATURED STOCK ARTICLE : Concerns Increase While Lingering Below 50-Day Moving Average - 1/27/2017 |
View all notes |
Set NEW NOTE alert |
Company Profile |
SEC
News |
Chart |
Request a new note
C
A
S
I |
BEAT
-
NASDAQ
BioTelemetry Inc
Medical-Services
|
$23.85
|
-0.05
-0.21% |
$24.20
|
190,545
67.57% of 50 DAV
50 DAV is 282,000
|
$24.45
-2.45%
|
12/19/2016
|
$22.91
|
PP = $21.78
|
|
MB = $22.87
|
Most Recent Note - 2/3/2017 5:08:20 PM
G - Hit a new high with today's 4th consecutive gain backed by near average volume. Prior highs in the $21-22 area and its 50 DMA line define important near-term support to watch.
>>> FEATURED STOCK ARTICLE : Volume Totals Cooling While Consolidating Above Prior Highs - 1/10/2017 |
View all notes |
Set NEW NOTE alert |
Company Profile |
SEC
News |
Chart |
Request a new note
C
A
S
I |
PATK
-
NASDAQ
Patrick Industries Inc
WHOLESALE - Building Materials Wholesale
|
$81.20
|
+0.20
0.25% |
$82.07
|
106,873
89.06% of 50 DAV
50 DAV is 120,000
|
$83.50
-2.75%
|
11/29/2016
|
$72.45
|
PP = $69.63
|
|
MB = $73.11
|
Most Recent Note - 2/6/2017 6:09:54 PM
G - Still quietly perched near all-time highs, extended from its prior base. Its 50 DMA line ($77.02) defines support to watch above prior highs.
>>> FEATURED STOCK ARTICLE : Perched Near All-Time High Extended From Prior Base - 1/31/2017 |
View all notes |
Set NEW NOTE alert |
Company Profile |
SEC
News |
Chart |
Request a new note
C
A
S
I |
ESNT
-
NYSE
Essent Group Ltd
Finance-MrtgandRel Svc
|
$36.04
|
+0.32
0.90% |
$36.48
|
606,255
92.28% of 50 DAV
50 DAV is 657,000
|
$36.28
-0.66%
|
1/25/2017
|
$34.09
|
PP = $34.04
|
|
MB = $35.74
|
Most Recent Note - 2/3/2017 5:00:25 PM
G - Posted a gain with light volume today rising above its "max buy" level and its color code is changed to green. Its 50 DMA line ($32.53) defines important near-term support above prior lows in the $31.50 area.
>>> FEATURED STOCK ARTICLE : Twice Average Volume Behind Big Breakout Gain - 1/25/2017 |
View all notes |
Set NEW NOTE alert |
Company Profile |
SEC
News |
Chart |
Request a new note
C
A
S
I |
Symbol/Exchange
Company Name
Industry Group |
PRICE |
CHANGE
(%Change) |
Day High |
Volume
(% DAV)
(% 50 day avg vol) |
52 Wk Hi
% From Hi |
Featured
Date |
Price
Featured |
Pivot Featured |
|
Max Buy |
ANET
-
NYSE
Arista Networks Inc
TELECOMMUNICATIONS - Communication Equipment
|
$95.99
|
+0.48
0.50% |
$96.49
|
280,302
38.88% of 50 DAV
50 DAV is 721,000
|
$103.00
-6.81%
|
12/30/2016
|
$96.77
|
PP = $99.00
|
|
MB = $103.95
|
Most Recent Note - 2/6/2017 5:58:26 PM
G - Consolidating near its 50 DMA line ($95.60) with volume totals cooling while rebounding after a damaging gap down on 1/17/17. Subsequent losses on above average volume would raise greater concerns.
>>> FEATURED STOCK ARTICLE : Technical Damages Raised Concern and Triggered Technical Sell Signal - 1/18/2017 |
View all notes |
Set NEW NOTE alert |
Company Profile |
SEC
News |
Chart |
Request a new note
C
A
S
I |
VBTX
-
NASDAQ
Veritex Holdings Inc
BANKING - Regional - Southwest Banks
|
$28.19
|
-0.45
-1.57% |
$29.06
|
46,640
51.82% of 50 DAV
50 DAV is 90,000
|
$29.33
-3.89%
|
1/23/2017
|
$27.30
|
PP = $27.87
|
|
MB = $29.26
|
Most Recent Note - 2/3/2017 5:06:40 PM
Y - Hit a new high with today's big gain backed by +51% above average volume clinching a technical buy signal, however it closed near the previously cited "max buy" level.
>>> FEATURED STOCK ARTICLE : Challenged Highs But Ended in Bottom Third of Intra-day Range - 1/23/2017 |
View all notes |
Set NEW NOTE alert |
Company Profile |
SEC
News |
Chart |
Request a new note
C
A
S
I |
SFBS
-
NASDAQ
Servisfirst Bancshares
BANKING - Regional - Southeast Banks
|
$39.89
|
-0.16
-0.40% |
$40.43
|
58,665
22.74% of 50 DAV
50 DAV is 258,000
|
$41.16
-3.09%
|
7/19/2016
|
$26.64
|
PP = $26.41
|
|
MB = $27.73
|
Most Recent Note - 2/6/2017 6:11:41 PM
G - Holding its ground near all-time highs. Recently reported earnings +8% on +20% sales revenues for the Dec '16 quarter, below the +25% minimum guideline (C criteria), raising fundamental concerns. Its 50 DMA line ($37.52) defines important near-term support above recent lows in the $36 area. Subsequent violations would trigger technical sell signals.
>>> FEATURED STOCK ARTICLE : Stubbornly Holding Ground Near Highs - 1/12/2017 |
View all notes |
Set NEW NOTE alert |
Company Profile |
SEC
News |
Chart |
Request a new note
C
A
S
I |
LCII
-
NYSE
L C I Industries
MATERIALS and CONSTRUCTION - General Building Materials
|
$108.05
|
-0.05
-0.05% |
$108.40
|
180,789
105.11% of 50 DAV
50 DAV is 172,000
|
$117.15
-7.77%
|
11/29/2016
|
$106.29
|
PP = $101.00
|
|
MB = $106.05
|
Most Recent Note - 2/6/2017 6:04:54 PM
G - Sputtering just below its 50 DMA line ($109.10). Losses leading to deterioration below prior lows ($105.05 on 1/20/17) may trigger technical sell signals. Recently, Drew Industries (DW) announced a new name LCI Industries (LCII).
>>> FEATURED STOCK ARTICLE : Distributional Action While Retreating From Highs - 1/30/2017 |
View all notes |
Set NEW NOTE alert |
Company Profile |
SEC
News |
Chart |
Request a new note
C
A
S
I |
|
|
|
THESE ARE NOT BUY RECOMMENDATIONS!
Comments contained in the body of this report are technical
opinions only. The material herein has been obtained
from sources believed to be reliable and accurate, however,
its accuracy and completeness cannot be guaranteed.
This site is not an investment advisor, hence it does
not endorse or recommend any securities or other investments.
Any recommendation contained in this report may not
be suitable for all investors and it is not to be deemed
an offer or solicitation on our part with respect to
the purchase or sale of any securities. All trademarks,
service marks and trade names appearing in this report
are the property of their respective owners, and are
likewise used for identification purposes only.
This report is a service available
only to active Paid Premium Members.
You may opt-out of receiving report notifications
at any time. Questions or comments may be submitted
by writing to Premium Membership Services 665 S.E. 10 Street, Suite 201 Deerfield Beach, FL 33441-5634 or by calling 1-800-965-8307
or 954-785-1121.
|
|
|