You are not logged in.
This means you
CAN ONLY VIEW reports that were published prior to Thursday, March 20, 2025.
You
MUST UPGRADE YOUR MEMBERSHIP if you want to see any current reports.
AFTER MARKET UPDATE - TUESDAY, JANUARY 24TH, 2017
Previous After Market Report Next After Market Report >>>
|
|
|
|
DOW |
+112.86 |
19,912.71 |
+0.57% |
|
Volume |
1,005,597,010 |
+11% |
|
Volume |
1,644,128,770 |
+9% |
|
NASDAQ |
+48.02 |
5,600.96 |
+0.86% |
|
Advancers |
2,198 |
74% |
|
Advancers |
2,231 |
73% |
|
S&P 500 |
+14.87 |
2,280.07 |
+0.66% |
|
Decliners |
771 |
26% |
|
Decliners |
817 |
27% |
|
Russell 2000 |
+21.37 |
1,369.21 |
+1.59% |
|
52 Wk Highs |
209 |
|
|
52 Wk Highs |
166 |
|
|
S&P 600 |
+12.91 |
838.01 |
+1.56% |
|
52 Wk Lows |
12 |
|
|
52 Wk Lows |
33 |
|
|
 |
Major Indices Rose With a Healthy Expansion in Leadership
Kenneth J. Gruneisen - Passed the CAN SLIM® Master's Exam
Stocks advanced on Tuesday. The Dow was up 112 points to 19912. The S&P 500 added 14 points to 2280 and the Nasdaq Composite gained 48 points to 5600. Volume totals were higher than the prior session totals on the NYSE and on the Nasdaq exchange. Breadth was solidly positive as advancers led decliners by a 3-1 margin on the NYSE and nearly 3-1 on the Nasdaq exchange. There were 38 high-ranked companies from the Leaders List that made new 52-week highs and were listed on the BreakOuts Page, versus the total of 18 on the prior session. New 52-week highs totals expanded and solidly outnumbered new 52-week lows on both the NYSE and the Nasdaq exchange.
PICTURED: The Nasdaq Composite Index rallied with higher volume for a new record high. Its 50-day moving average (DMA) line and recent lows defining near-term support to watch on pullbacks.
The major averages (M criteria) are in a confirmed uptrend. New buying efforts should only be made in candidates with superior fundamental and technical characteristics. The Featured Stocks Page lists noteworthy high-ranked leaders.
The major averages finished higher on the session as Materials rallied and investors digested corporate earnings releases. Yahoo! Inc (YHOO +3.54%) rose as the company posted better-than-expected quarterly profit. Kimberly-Clark (KMB +4.11%) rose after the household products maker increased its quarterly dividend. On the data front, existing home sales fell 2.8% last month. In a separate release, Markit’s survey of U.S. manufacturing expanded to 55.1 in January.
Seven of 11 sectors in the S&P 500 ended in positive territory. Materials shares led the advance with DuPont (DD +4.49%) rising. Consumer Discretionary stocks outperformed with Alibaba (BABA +3.07%) rising after the Chinese e-commerce company raised its full-year sales forecast. In Industrials, 3M (MMM -1.42%) was lower as quarterly sales were little changed in the period. Johnson & Johnson (JNJ -1.89%) led the losses in Health Care. In Telecom, stocks retreated on the session with Verizon (VZ -4.37%) sliding after revenue fell 5.6% year-over-year amid fewer wireless subscribers.
Treasuries finished lower with the benchmark 10-year note down 16/32 to yield 2.45%. In commodities, NYMEX WTI crude added 0.6% to $53.08/barrel. COMEX gold lost 0.6% to $1208.60/ounce. In FOREX, the Dollar Index gained 0.1% with particular strength against the yen. |
 Kenneth J. Gruneisen started out as a licensed stockbroker in August 1987, a couple of months prior to the historic stock market crash that took the Dow Jones Industrial Average down -22.6% in a single day. He has published daily fact-based fundamental and technical analysis on high-ranked stocks online for two decades. Through FACTBASEDINVESTING.COM, Kenneth provides educational articles, news, market commentary, and other information regarding proven investment systems that work in good times and bad.
Comments contained in the body of this report are technical opinions only and are not necessarily those of Gruneisen Growth Corp. The material herein has been obtained from sources believed to be reliable and accurate, however, its accuracy and completeness cannot be guaranteed. Our firm, employees, and customers may effect transactions, including transactions contrary to any recommendation herein, or have positions in the securities mentioned herein or options with respect thereto. Any recommendation contained in this report may not be suitable for all investors and it is not to be deemed an offer or solicitation on our part with respect to the purchase or sale of any securities. |
|
 |
Financial, Retail, Semiconductor, Networking and Commodity-Linked Groups Rose
Kenneth J. Gruneisen - Passed the CAN SLIM® Master's Exam
The Retail Index ($RLX +0.74%), Broker/Dealer Index ($XBD +1.48%) and the Bank Index ($BKX +1.54%) unanimously rose and helped boost the major indices on Tuesday. The tech sector had a positive bias as the Semiconductor Index ($SOX +2.02%) and the Networking Index ($NWX +1.67%) both posted solid gains, meanwhile the Biotechnology Index ($BTK +0.01%) was unchanged. The Gold & Silver Index ($XAU +0.72) posted a modest gain that lagged behind energy-linked groups as the Integrated Oil Index ($XOI +1.06%) and Oil Services Index ($OSX +2.12%) both ended higher. Charts courtesy www.stockcharts.com
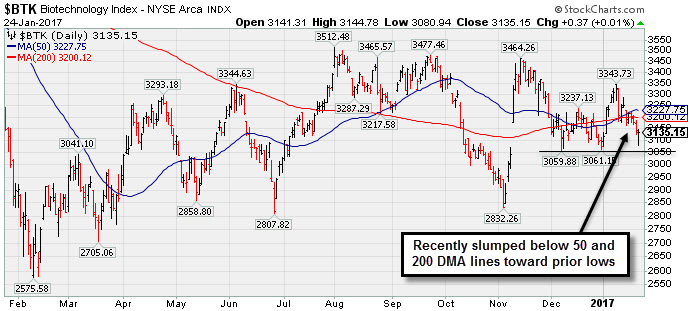 PICTURED: The Biotechnology Index ($BTK +0.01%) recently slumped below its 50-day and 200-day moving average (DMA) lines toward prior lows defining near-term support to watch on pullbacks.
| Oil Services |
$OSX |
188.13 |
+3.90 |
+2.12% |
+2.36% |
| Integrated Oil |
$XOI |
1,264.97 |
+13.27 |
+1.06% |
-0.24% |
| Semiconductor |
$SOX |
942.41 |
+18.64 |
+2.02% |
+3.96% |
| Networking |
$NWX |
448.57 |
+7.37 |
+1.67% |
+0.55% |
| Broker/Dealer |
$XBD |
213.90 |
+3.12 |
+1.48% |
+4.20% |
| Retail |
$RLX |
1,393.02 |
+10.17 |
+0.74% |
+3.73% |
| Gold & Silver |
$XAU |
91.91 |
+0.65 |
+0.71% |
+16.55% |
| Bank |
$BKX |
91.47 |
+1.39 |
+1.54% |
-0.35% |
| Biotech |
$BTK |
3,135.15 |
+0.37 |
+0.01% |
+1.96% |
|
|
|
 |
Rose From Support at 50-Day Moving Average Line
Kenneth J. Gruneisen - Passed the CAN SLIM® Master's Exam
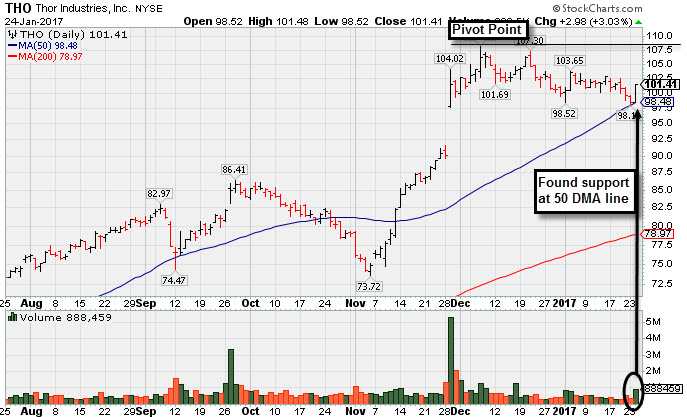
Thor Industries Inc (THO +$2.98 or +3.03% to $101.41) was highlighted in yellow with new pivot point cited based on its 12/07/16 high plus 10 cents in today's earlier mid-day report (read here). Subsequent volume-driven gains for new highs are needed to trigger a technical buy signal. Volume totals have cooled in recent weeks, and today it rallied from support at its 50-day moving average (DMA) line with a solid gain backed by above average volume. It has been consolidating since gapping up on 11/29/16. The high-ranked Building - Mobile/Mfg & RV firm reported earnings +54% on +66% sales revenues for the Oct '16 quarter. Three of the past 4 quarters were above the +25% minimum earnings guideline (C criteria) of the fact-based investment system. Its annual earnings history (A criteria) has been good. Return on Equity is reported at 23%, well above the 17% guideline. It has earned a current Timeliness rating of A and a Sponsorship rating of B. The number of top-rated funds owning its shares rose from 489 in Mar '16 to 554 in Dec '16. Its current Up/Down Volume Ratio of 2.0 is an unbiased indication its shares have been under accumulation over the past 50 days (I criteria). Its small supply of only 48.9 million shares (S criteria) in the public float can contribute to greater volatility in the event of institutional buying or selling. Charts courtesy www.stockcharts.com
 |
|
|
Color Codes Explained :
Y - Better candidates highlighted by our
staff of experts.
G - Previously featured
in past reports as yellow but may no longer be buyable under the
guidelines.
***Last / Change / Volume data in this table is the closing quote data***
Symbol/Exchange
Company Name
Industry Group |
PRICE |
CHANGE
(%Change) |
Day High |
Volume
(% DAV)
(% 50 day avg vol) |
52 Wk Hi
% From Hi |
Featured
Date |
Price
Featured |
Pivot Featured |
|
Max Buy |
THO
-
NYSE
Thor Industries Inc
AUTOMOTIVE - Recreational Vehicles
|
$101.41
|
+2.98
3.03% |
$101.48
|
889,311
122.16% of 50 DAV
50 DAV is 728,000
|
$108.45
-6.49%
|
1/24/2017
|
$100.52
|
PP = $108.45
|
|
MB = $113.87
|
 Most Recent Note - 1/24/2017 5:33:28 PM
Y - Posted a big gain with higher volume today while rallying from support at its 50 DMA line ($98.67). It was highlighted in yellow in the earlier mid-day report as a new pivot point was cited based on its 12/07/16 high plus 10 cents. Subsequent volume-driven gains for new highs are needed to trigger a technical buy signal. Reported earnings +54% on +66% sales revenues for the Oct '16 quarter. Three of the past 4 quarters were above the +25% minimum earnings guideline (C criteria) of the fact-based investment system. See the latest FSU analysis for more details and a new annotated graph.
>>> FEATURED STOCK ARTICLE : Rose From Support at 50-Day Moving Average Line - 1/24/2017 |
View all notes |
Set NEW NOTE alert |
Company Profile |
SEC
News |
Chart |
Request a new note
C
A
S
I |
CSFL
-
NASDAQ
Centerstate Banks Inc
Banks-Southeast
|
$25.43
|
+0.50
2.01% |
$25.52
|
270,972
86.30% of 50 DAV
50 DAV is 314,000
|
$25.83
-1.56%
|
10/10/2016
|
$18.20
|
PP = $18.37
|
|
MB = $19.29
|
Most Recent Note - 1/24/2017 5:40:43 PM
G - Challenged prior highs with today's 3rd consecutive gain. Completed a new Public Offering of shares on 1/10/17 during its orderly consolidation perched near all-time highs. Its 50 DMA line ($24) defines near-term support along with recent lows.
>>> FEATURED STOCK ARTICLE : Bank Stock Perched Near Record Highs After Considerable Rally - 1/4/2017 |
View all notes |
Set NEW NOTE alert |
Company Profile |
SEC
News |
Chart |
Request a new note
C
A
S
I |
IESC
-
NASDAQ
I E S Holdings Inc
Bldg-Maintenance and Svc
|
$19.95
|
+1.05
5.56% |
$20.08
|
63,601
70.67% of 50 DAV
50 DAV is 90,000
|
$23.00
-13.26%
|
11/23/2016
|
$19.35
|
PP = $18.26
|
|
MB = $19.17
|
Most Recent Note - 1/24/2017 5:38:43 PM
G - Finished near the session highs with higher (still below average) volume behind today's 5th consecutive gain. The rebound above its 50 DMA line ($19.44) helped its outlook improve.
>>> FEATURED STOCK ARTICLE : Violated 50-Day Moving Average Line and Now Testing Prior Highs - 1/19/2017 |
View all notes |
Set NEW NOTE alert |
Company Profile |
SEC
News |
Chart |
Request a new note
C
A
S
I |
BERY
-
NYSE
Berry Plastics Group Inc
CONSUMER NON-DURABLES - Packaging and Containers
|
$52.38
|
+0.71
1.37% |
$52.51
|
803,189
61.93% of 50 DAV
50 DAV is 1,297,000
|
$51.75
1.22%
|
11/30/2016
|
$50.26
|
PP = $46.47
|
|
MB = $48.79
|
Most Recent Note - 1/24/2017 5:46:36 PM
G - Posted another gain with below average volume today for its best-ever close. Insider buying reported in recent weeks is a reassuring sign. Its 50 DMA line ($49.22) defines support to watch above recent lows in the $48.50 area.
>>> FEATURED STOCK ARTICLE : Orderly Consolidation Continues Well Above Support - 1/3/2017 |
View all notes |
Set NEW NOTE alert |
Company Profile |
SEC
News |
Chart |
Request a new note
C
A
S
I |
EVR
-
NYSE
Evercore Partners Inc
FINANCIAL SERVICES - Investment Banking
|
$75.30
|
+1.25
1.69% |
$75.73
|
317,593
71.21% of 50 DAV
50 DAV is 446,000
|
$74.10
1.62%
|
1/5/2017
|
$71.40
|
PP = $72.07
|
|
MB = $75.67
|
Most Recent Note - 1/23/2017 5:48:01 PM
Y - Wedged higher with today's gain lacking great volume conviction. Its 50 DMA line ($68.95) defines support above prior highs. Concerns remain because volume behind all gains has been light since a new pivot point was cited based on its 12/08/16 high plus 10 cents - "Gains above a pivot point must have a minimum of +40% above average volume to trigger a proper new (or add-on) technical buy signal.)
>>> FEATURED STOCK ARTICLE : Perched Near All-Time High Building New Flat Base - 1/5/2017 |
View all notes |
Set NEW NOTE alert |
Company Profile |
SEC
News |
Chart |
Request a new note
C
A
S
I |
Symbol/Exchange
Company Name
Industry Group |
PRICE |
CHANGE
(%Change) |
Day High |
Volume
(% DAV)
(% 50 day avg vol) |
52 Wk Hi
% From Hi |
Featured
Date |
Price
Featured |
Pivot Featured |
|
Max Buy |
HTHT
-
NASDAQ
China Lodging Group Ads
LEISURE - Lodging
|
$51.56
|
+1.14
2.26% |
$51.64
|
63,648
36.58% of 50 DAV
50 DAV is 174,000
|
$54.23
-4.92%
|
9/29/2016
|
$46.12
|
PP = $47.82
|
|
MB = $50.21
|
Most Recent Note - 1/24/2017 5:47:59 PM
G - Still quietly consolidating above support at its 50 DMA line ($49.24) with volume totals cooling. The prior low ($45.61 on 12/20/16) defines the next important near-term support level. Repeatedly noted with caution in prior reports - "Reported earnings +10% on +6% sales revenues for the Sep '16 quarter, below the +25% minimum earnings guideline (C criteria), raising concerns."
>>> FEATURED STOCK ARTICLE : Slump Below "Max Buy" Level But Fundamental Concerns Were Raised - 1/6/2017 |
View all notes |
Set NEW NOTE alert |
Company Profile |
SEC
News |
Chart |
Request a new note
C
A
S
I |
DW
-
NYSE
LCI Industries
MATERIALS and CONSTRUCTION - General Building Materials
|
$111.80
|
+3.85
3.57% |
$112.15
|
130,133
68.31% of 50 DAV
50 DAV is 190,500
|
$116.50
-4.03%
|
11/29/2016
|
$106.29
|
PP = $101.00
|
|
MB = $106.05
|
Most Recent Note - 1/23/2017 5:43:17 PM
G - Found support at its 50 DMA line ($106.10) and posted a gain today with average volume. Prior highs in the $103 area define the next important support level below its 50 DMA line. Subsequent violations may trigger technical sell signals. Drew Industries (DW) announced a new name LCI Industries (LCII) and new trading symbol effective as of the market open on January 3, 2017.
>>> FEATURED STOCK ARTICLE : Consolidating Well Above Prior Highs and 50-Day Moving Average - 12/30/2016 |
View all notes |
Set NEW NOTE alert |
Company Profile |
SEC
News |
Chart |
Request a new note
C
A
S
I |
LMAT
-
NASDAQ
Lemaitre Vascular Inc
Medical-Products
|
$23.32
|
+0.06
0.26% |
$23.40
|
77,828
54.43% of 50 DAV
50 DAV is 143,000
|
$27.04
-13.75%
|
12/22/2016
|
$24.99
|
PP = $25.09
|
|
MB = $26.34
|
Most Recent Note - 1/19/2017 5:41:08 PM
G - Slumped below its 50 DMA line with a 6th consecutive loss today raising concerns and triggering a technical sell signal. Color code is changed to green. Only a prompt rebound above its 50 DMA line ($23.93) would help its outlook improve.
>>> FEATURED STOCK ARTICLE : Built an Orderly Base-On-Base Pattern - 12/23/2016 |
View all notes |
Set NEW NOTE alert |
Company Profile |
SEC
News |
Chart |
Request a new note
C
A
S
I |
BEAT
-
NASDAQ
BioTelemetry Inc
Medical-Services
|
$22.25
|
+0.20
0.91% |
$22.35
|
210,890
73.48% of 50 DAV
50 DAV is 287,000
|
$24.10
-7.68%
|
12/19/2016
|
$22.91
|
PP = $21.78
|
|
MB = $22.87
|
Most Recent Note - 1/20/2017 5:25:33 PM
Y - Quietly consolidating near prior highs in the $21-22 area which define initial support to watch above its 50 DMA line ($20.84). More damaging losses leading to violations may trigger technical sell signals.
>>> FEATURED STOCK ARTICLE : Volume Totals Cooling While Consolidating Above Prior Highs - 1/10/2017 |
View all notes |
Set NEW NOTE alert |
Company Profile |
SEC
News |
Chart |
Request a new note
C
A
S
I |
PATK
-
NASDAQ
Patrick Industries Inc
WHOLESALE - Building Materials Wholesale
|
$80.80
|
+2.55
3.26% |
$80.95
|
89,484
71.59% of 50 DAV
50 DAV is 125,000
|
$81.65
-1.04%
|
11/29/2016
|
$72.45
|
PP = $69.63
|
|
MB = $73.11
|
Most Recent Note - 1/19/2017 5:38:37 PM
G - Pulling back from all-time highs after getting extended from its prior base. Prior highs in the $69 area and its 50 DMA line ($72.60) define support to watch on pullbacks.
>>> FEATURED STOCK ARTICLE : Stubbornly Held Ground and Rose Since Featured Again - 12/28/2016 |
View all notes |
Set NEW NOTE alert |
Company Profile |
SEC
News |
Chart |
Request a new note
C
A
S
I |
Symbol/Exchange
Company Name
Industry Group |
PRICE |
CHANGE
(%Change) |
Day High |
Volume
(% DAV)
(% 50 day avg vol) |
52 Wk Hi
% From Hi |
Featured
Date |
Price
Featured |
Pivot Featured |
|
Max Buy |
ANET
-
NYSE
Arista Networks Inc
TELECOMMUNICATIONS - Communication Equipment
|
$92.47
|
+2.80
3.12% |
$92.60
|
694,925
84.85% of 50 DAV
50 DAV is 819,000
|
$103.00
-10.22%
|
12/30/2016
|
$96.77
|
PP = $99.00
|
|
MB = $103.95
|
Most Recent Note - 1/24/2017 5:43:57 PM
G - Rose today yet remains below its 50 DMA line after a damaging gap down on 1/17/17 triggering a technical sell signal. A rebound above its 50 DMA line ($94.67) is needed for its outlook to improve.
>>> FEATURED STOCK ARTICLE : Technical Damages Raised Concern and Triggered Technical Sell Signal - 1/18/2017 |
View all notes |
Set NEW NOTE alert |
Company Profile |
SEC
News |
Chart |
Request a new note
C
A
S
I |
VBTX
-
NASDAQ
Veritex Holdings Inc
BANKING - Regional - Southwest Banks
|
$27.40
|
+0.90
3.40% |
$27.60
|
69,282
94.91% of 50 DAV
50 DAV is 73,000
|
$27.77
-1.31%
|
1/23/2017
|
$27.30
|
PP = $27.87
|
|
MB = $29.26
|
Most Recent Note - 1/24/2017 5:53:26 PM
Y - Finished at a best-ever close with today's 5th consecutive gain, challenging its all-time high after a short flat base. A gain above the pivot point backed by at least +40% above average volume is needed to trigger a proper technical buy signal. Reported Dec '16 quarterly earnings +17% on +26% sales revenues, below the +25% minimum guideline (C criteria) for buy candidates, raising fundamental concerns. Completed a new Public Offering on 12/15/16 See the latest FSU analysis for more details and an annotated graph.
>>> FEATURED STOCK ARTICLE : Challenged Highs But Ended in Bottom Third of Intra-day Range - 1/23/2017 |
View all notes |
Set NEW NOTE alert |
Company Profile |
SEC
News |
Chart |
Request a new note
C
A
S
I |
SFBS
-
NASDAQ
Servisfirst Bancshares
BANKING - Regional - Southeast Banks
|
$38.20
|
+0.91
2.44% |
$38.42
|
143,001
48.97% of 50 DAV
50 DAV is 292,000
|
$38.65
-1.16%
|
7/19/2016
|
$26.64
|
PP = $26.41
|
|
MB = $27.73
|
Most Recent Note - 1/24/2017 5:49:12 PM
G - Posted a gain on light volume today challenging prior highs. Recent low and its 50 DMA line define important near-term support in the $35-36 area where subsequent violations would raise concerns.
>>> FEATURED STOCK ARTICLE : Stubbornly Holding Ground Near Highs - 1/12/2017 |
View all notes |
Set NEW NOTE alert |
Company Profile |
SEC
News |
Chart |
Request a new note
C
A
S
I |
|
|
|
THESE ARE NOT BUY RECOMMENDATIONS!
Comments contained in the body of this report are technical
opinions only. The material herein has been obtained
from sources believed to be reliable and accurate, however,
its accuracy and completeness cannot be guaranteed.
This site is not an investment advisor, hence it does
not endorse or recommend any securities or other investments.
Any recommendation contained in this report may not
be suitable for all investors and it is not to be deemed
an offer or solicitation on our part with respect to
the purchase or sale of any securities. All trademarks,
service marks and trade names appearing in this report
are the property of their respective owners, and are
likewise used for identification purposes only.
This report is a service available
only to active Paid Premium Members.
You may opt-out of receiving report notifications
at any time. Questions or comments may be submitted
by writing to Premium Membership Services 665 S.E. 10 Street, Suite 201 Deerfield Beach, FL 33441-5634 or by calling 1-800-965-8307
or 954-785-1121.
|
|
|


