***Last / Change / Volume data in this table is the closing quote data***
Symbol/Exchange
Company Name
Industry Group |
PRICE |
CHANGE
(%Change) |
Day High |
Volume
(% DAV)
(% 50 day avg vol) |
52 Wk Hi
% From Hi |
Featured
Date |
Price
Featured |
Pivot Featured |
|
Max Buy |
THO
-
NYSE
Thor Industries Inc
AUTOMOTIVE - Recreational Vehicles
|
$110.82
|
-2.03
-1.80% |
$112.34
|
472,953
96.72% of 50 DAV
50 DAV is 489,000
|
$112.89
-1.83%
|
1/24/2017
|
$100.52
|
PP = $108.45
|
|
MB = $113.87
|
Most Recent Note - 2/27/2017 5:34:14 PM
Y - Posted a gain with average volume approaching its "max buy" level. Prior highs in the $108 area define support to watch above its 50 DMA line on pullbacks.
>>> FEATURED STOCK ARTICLE : Rose From Support at 50-Day Moving Average Line - 1/24/2017 |
View all notes |
Set NEW NOTE alert |
Company Profile |
SEC
News |
Chart |
Request a new note
C
A
S
I |
SBCF
-
NASDAQ
Seacoast Banking Corp Fl
BANKING - Regional - Mid-Atlantic Banks
|
$23.23
|
-0.38
-1.61% |
$23.67
|
928,257
267.51% of 50 DAV
50 DAV is 347,000
|
$25.13
-7.56%
|
2/13/2017
|
$24.84
|
PP = $23.10
|
|
MB = $24.26
|
Most Recent Note - 2/27/2017 5:30:44 PM
Y - Churning above average volume and consolidating since its 2/13/17 gap up was highlighted in yellow with pivot point cited based on its 1/04/17 high plus 10 cents. Its solid volume-driven gain clinched a technical buy signal. Completed a new Public Offering on 2/15/17. Prior highs in the $23 area define initial support to watch.
>>> FEATURED STOCK ARTICLE : Gap Up Gain and Strong Finish Triggered Technical Buy Signal - 2/13/2017 |
View all notes |
Set NEW NOTE alert |
Company Profile |
SEC
News |
Chart |
Request a new note
C
A
S
I |
CSFL
-
NASDAQ
Centerstate Banks Inc
Banks-Southeast
|
$24.71
|
-0.29
-1.16% |
$25.00
|
219,066
80.84% of 50 DAV
50 DAV is 271,000
|
$26.30
-6.05%
|
10/10/2016
|
$18.20
|
PP = $18.37
|
|
MB = $19.29
|
 Most Recent Note - 2/28/2017 4:54:51 PM
G - Consolidating just below its 50 DMA line ($24.98). Recent low ($23.80 on 2/08/17) defines important near-term support where further deterioration would trigger a technical sell signal. Completed a new Public Offering of shares on 1/10/17.
>>> FEATURED STOCK ARTICLE : Found Support Near 50-Day Average Following Offering - 2/6/2017 |
View all notes |
Set NEW NOTE alert |
Company Profile |
SEC
News |
Chart |
Request a new note
C
A
S
I |
IESC
-
NASDAQ
Integrated Electric Svcs
Bldg-Maintenance and Svc
|
$18.75
|
-0.60
-3.10% |
$19.55
|
60,406
103.43% of 50 DAV
50 DAV is 58,400
|
$23.00
-18.48%
|
11/23/2016
|
$19.35
|
PP = $18.26
|
|
MB = $19.17
|
Most Recent Note - 2/28/2017 4:50:53 PM
G - Slumped on average volume, falling further below its 50 DMA line ($19.59) which is now downward sloping. Its Relative Strength rating has slumped to 72, below the 80+ minimum guideline for buy candidates. Prior low ($18.05 on 1/18/17) defines important support near prior highs. Recently reported Dec '16 quarterly earnings -33% on +27% sales revenues, below the +25% minimum earnings guideline (C criteria), raising fundamental concerns.
>>> FEATURED STOCK ARTICLE : Violated 50-Day Moving Average Line and Now Testing Prior Highs - 1/19/2017 |
View all notes |
Set NEW NOTE alert |
Company Profile |
SEC
News |
Chart |
Request a new note
C
A
S
I |
NSP
-
NYSE
Insperity Inc
Comml Svcs-Outsourcing
|
$83.25
|
+1.25
1.52% |
$84.05
|
433,859
307.70% of 50 DAV
50 DAV is 141,000
|
$86.35
-3.59%
|
2/14/2017
|
$84.30
|
PP = $82.28
|
|
MB = $86.39
|
Most Recent Note - 2/28/2017 12:30:50 PM
Y - Recently consolidating near prior highs defining initial support. It stalled soon after highlighted in yellow with pivot point cited based on its 7/26/16 high plus 10 cents in the 2/14/17 mid-day report (read here). More damaging losses below the recent low ($79.97 on 2/24/17) would raise concerns.
>>> FEATURED STOCK ARTICLE : Big Volume-Driven Gains Indicative of Institutional Demand - 2/14/2017 |
View all notes |
Set NEW NOTE alert |
Company Profile |
SEC
News |
Chart |
Request a new note
C
A
S
I |
Symbol/Exchange
Company Name
Industry Group |
PRICE |
CHANGE
(%Change) |
Day High |
Volume
(% DAV)
(% 50 day avg vol) |
52 Wk Hi
% From Hi |
Featured
Date |
Price
Featured |
Pivot Featured |
|
Max Buy |
BERY
-
NYSE
Berry Plastics Group Inc
CONSUMER NON-DURABLES - Packaging and Containers
|
$50.33
|
+0.30
0.60% |
$50.41
|
883,350
73.47% of 50 DAV
50 DAV is 1,202,300
|
$52.97
-4.98%
|
11/30/2016
|
$50.26
|
PP = $46.47
|
|
MB = $48.79
|
Most Recent Note - 2/28/2017 4:54:15 PM
G - Relative Strength Rating is 79, just below the 80+ minimum for buy candidates under the fact-based investment system, and it has been consolidating near its 50 DMA line. Recent lows in the $48.50 area define near-term support. Damaging losses and violations would trigger a more worrisome technical sell signal. Reported earnings +43% on -7% sales revenues for the Dec '16 quarter.
>>> FEATURED STOCK ARTICLE : Recent 50-Day Violation Raised Concerns - 2/7/2017 |
View all notes |
Set NEW NOTE alert |
Company Profile |
SEC
News |
Chart |
Request a new note
C
A
S
I |
EVR
-
NYSE
Evercore Partners Inc
FINANCIAL SERVICES - Investment Banking
|
$79.55
|
-0.25
-0.31% |
$79.65
|
293,546
68.27% of 50 DAV
50 DAV is 430,000
|
$81.75
-2.69%
|
1/5/2017
|
$71.40
|
PP = $72.07
|
|
MB = $75.67
|
Most Recent Note - 2/27/2017 9:57:56 AM
G - Still holding its ground stubbornly, extended from its prior base. Its 50 DMA line and prior low ($74.75 on 2/08/17) define near-term support to watch. Recently reported Dec '16 quarterly earnings +17% on +9% sales revenues, below the +25% minimum earnings guideline (C criteria), raising fundamental concerns.
>>> FEATURED STOCK ARTICLE : Holding Ground After Latest Earnings Were Below +25% Guideline - 2/17/2017 |
View all notes |
Set NEW NOTE alert |
Company Profile |
SEC
News |
Chart |
Request a new note
C
A
S
I |
NTES
-
NASDAQ
Netease Inc Adr
INTERNET - Internet Information Providers
|
$305.06
|
+3.30
1.09% |
$308.50
|
1,157,667
105.72% of 50 DAV
50 DAV is 1,095,000
|
$307.79
-0.89%
|
2/10/2017
|
$259.30
|
PP = $272.68
|
|
MB = $286.31
|
Most Recent Note - 2/24/2017 12:40:25 PM
G - Perched near all-time highs, extended from its prior base following a "breakaway gap" and additional volume-driven gains. Prior highs in the $272 area define initial support to watch on pullbacks.
>>> FEATURED STOCK ARTICLE : Rebounding With Earnings News Due Soon - 2/10/2017 |
View all notes |
Set NEW NOTE alert |
Company Profile |
SEC
News |
Chart |
Request a new note
C
A
S
I |
STMP
-
NASDAQ
Stamps.com Inc
INTERNET - Internet Software and Services
|
$126.10
|
-1.70
-1.33% |
$128.35
|
418,515
182.68% of 50 DAV
50 DAV is 229,100
|
$136.00
-7.28%
|
2/16/2017
|
$129.45
|
PP = $123.85
|
|
MB = $130.04
|
Most Recent Note - 2/27/2017 5:23:52 PM
Y - Encountering distributional pressure with a streak of volume-driven losses, however its color code is changed to yellow after pulling back below its "max buy" level. Prior highs and its 50 DMA line define near term support to watch. Reported earnings +74% on +52% sales revenues for the Dec '16 quarter. It was highlighted in yellow with pivot point cited based on its 3/07/16 high plus 10 cents in the 2/16/17 mid-day report while noted - "Subsequent volume-driven gains may help clinch a convincing technical buy signal. Recently it has been wedging to new highs with gains lacking great volume conviction."
>>> FEATURED STOCK ARTICLE : Recent Gains Have Lacked Heavy Volume Indicative of Accumulation - 2/16/2017 |
View all notes |
Set NEW NOTE alert |
Company Profile |
SEC
News |
Chart |
Request a new note
C
A
S
I |
HTHT
-
NASDAQ
China Lodging Group Ads
LEISURE - Lodging
|
$57.97
|
+0.30
0.52% |
$58.94
|
62,269
43.24% of 50 DAV
50 DAV is 144,000
|
$59.20
-2.08%
|
9/29/2016
|
$46.12
|
PP = $47.82
|
|
MB = $50.21
|
Most Recent Note - 2/28/2017 4:56:22 PM
G - Quietly challenged its 52-week high today but ended near the session low. Prior highs in the $54 area define near-term support above its 50 DMA line ($52.22). Repeatedly noted with caution in prior reports - "Reported earnings +10% on +6% sales revenues for the Sep '16 quarter, below the +25% minimum earnings guideline (C criteria), raising concerns."
>>> FEATURED STOCK ARTICLE : Mostly Bullish Action Continues Since Latest Earnings Report - 2/9/2017 |
View all notes |
Set NEW NOTE alert |
Company Profile |
SEC
News |
Chart |
Request a new note
C
A
S
I |
Symbol/Exchange
Company Name
Industry Group |
PRICE |
CHANGE
(%Change) |
Day High |
Volume
(% DAV)
(% 50 day avg vol) |
52 Wk Hi
% From Hi |
Featured
Date |
Price
Featured |
Pivot Featured |
|
Max Buy |
BEAT
-
NASDAQ
BioTelemetry Inc
Medical-Services
|
$25.45
|
-0.40
-1.55% |
$25.85
|
395,126
115.87% of 50 DAV
50 DAV is 341,000
|
$27.30
-6.78%
|
2/14/2017
|
$25.10
|
PP = $24.55
|
|
MB = $25.78
|
Most Recent Note - 2/27/2017 5:20:04 PM
G - Pulled back with heavy volume today and closed near its "max buy" level. Prior highs in the $24 area and its 50 DMA line ($23.17) define important near-term support.
>>> FEATURED STOCK ARTICLE : Perched Near All-Time High With Earnings Report Due - 2/21/2017 |
View all notes |
Set NEW NOTE alert |
Company Profile |
SEC
News |
Chart |
Request a new note
C
A
S
I |
PATK
-
NASDAQ
Patrick Industries Inc
WHOLESALE - Building Materials Wholesale
|
$79.85
|
-1.95
-2.38% |
$81.60
|
150,060
125.05% of 50 DAV
50 DAV is 120,000
|
$86.10
-7.26%
|
11/29/2016
|
$72.45
|
PP = $69.63
|
|
MB = $73.11
|
Most Recent Note - 2/27/2017 5:37:39 PM
G - Found support recently near its 50 DMA line ($79.77) and posted a gain today with above average volume. Recent lows in the $76 area define support where more damaging losses may trigger a technical sell signal. Reported earnings +14% on +30% sales revenues for the Dec '16 quarter, below the +25% minimum earnings guideline (C criteria) raising fundamental concerns.
>>> FEATURED STOCK ARTICLE : Perched Near All-Time High Extended From Prior Base - 1/31/2017 |
View all notes |
Set NEW NOTE alert |
Company Profile |
SEC
News |
Chart |
Request a new note
C
A
S
I |
ESNT
-
NYSE
Essent Group Ltd
Finance-MrtgandRel Svc
|
$34.81
|
+0.06
0.17% |
$34.89
|
897,742
139.40% of 50 DAV
50 DAV is 644,000
|
$38.10
-8.64%
|
1/25/2017
|
$34.09
|
PP = $34.04
|
|
MB = $35.74
|
Most Recent Note - 2/24/2017 5:43:15 PM
Y - Consolidating above its 50 DMA line and prior highs defining important near-term support in the $33-34 area.
>>> FEATURED STOCK ARTICLE : Twice Average Volume Behind Big Breakout Gain - 1/25/2017 |
View all notes |
Set NEW NOTE alert |
Company Profile |
SEC
News |
Chart |
Request a new note
C
A
S
I |
ANET
-
NYSE
Arista Networks Inc
TELECOMMUNICATIONS - Communication Equipment
|
$118.99
|
-1.40
-1.16% |
$120.95
|
647,241
75.52% of 50 DAV
50 DAV is 857,000
|
$123.12
-3.35%
|
12/30/2016
|
$96.77
|
PP = $99.00
|
|
MB = $103.95
|
Most Recent Note - 2/28/2017 4:53:14 PM
G - Holding its ground stubbornly, extended from prior highs in the $103 area following a big "breakaway gap" on 2/17/17. Reported earnings +30% on +34% sales revenues for the Dec '16 quarter and it was noted - "Recovered impressively and faces no resistance due to overhead supply, but it has not formed a sound base after its gap down on 1/17/17."
>>> FEATURED STOCK ARTICLE : Technical Damages Raised Concern and Triggered Technical Sell Signal - 1/18/2017 |
View all notes |
Set NEW NOTE alert |
Company Profile |
SEC
News |
Chart |
Request a new note
C
A
S
I |
VBTX
-
NASDAQ
Veritex Holdings Inc
BANKING - Regional - Southwest Banks
|
$28.65
|
-0.37
-1.27% |
$29.15
|
61,358
64.59% of 50 DAV
50 DAV is 95,000
|
$29.43
-2.65%
|
1/23/2017
|
$27.30
|
PP = $27.87
|
|
MB = $29.26
|
Most Recent Note - 2/27/2017 5:35:59 PM
Y - Hovering near its "max buy" level. Prior highs in the $27 area and its 50 DMA line define important near-term support.
>>> FEATURED STOCK ARTICLE : Challenged Highs But Ended in Bottom Third of Intra-day Range - 1/23/2017 |
View all notes |
Set NEW NOTE alert |
Company Profile |
SEC
News |
Chart |
Request a new note
C
A
S
I |
Symbol/Exchange
Company Name
Industry Group |
PRICE |
CHANGE
(%Change) |
Day High |
Volume
(% DAV)
(% 50 day avg vol) |
52 Wk Hi
% From Hi |
Featured
Date |
Price
Featured |
Pivot Featured |
|
Max Buy |
IBP
-
NYSE
Installed Building Prod
DIVERSIFIED SERVICES - Business/Management Services
|
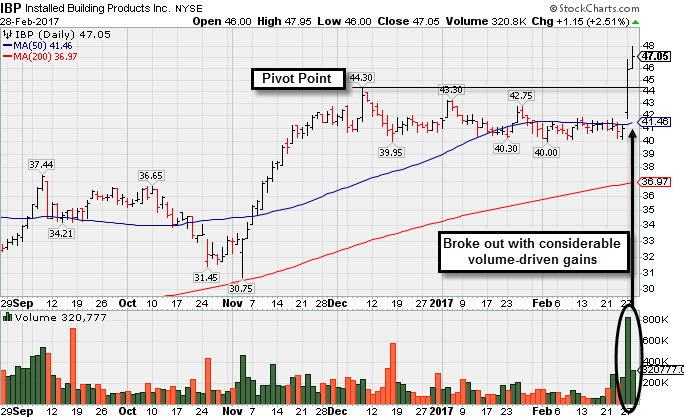
$47.05
|
+1.15
2.51% |
$47.95
|
320,777
205.63% of 50 DAV
50 DAV is 156,000
|
$46.80
0.53%
|
2/27/2017
|
$44.83
|
PP = $44.40
|
|
MB = $46.62
|
Most Recent Note - 2/28/2017 4:47:29 PM
G - Color code was changed to green after rallying above its "max buy" level. Rallying with no resistance remaining due to overhead supply, it was highlighted in the prior mid-day report in yellow with pivot point cited based on its 12/08/16 high plus 10 cents (read here). Reported earnings +29% on +22% sales revenues for the Dec '16 quarter, and 3 of the 4 prior quarterly comparisons had earnings increases well above the +25% minimum guideline (C criteria). Its annual earnings (A criteria) history has been strong since its $11 IPO on 2/13/14. See the latest FSU analysis for more details and a new annotated graph.
>>> FEATURED STOCK ARTICLE : Big Breakout Followed Solid Earnings News - 2/28/2017 |
View all notes |
Set NEW NOTE alert |
Company Profile |
SEC
News |
Chart |
Request a new note
C
A
S
I |
SFBS
-
NASDAQ
Servisfirst Bancshares
BANKING - Regional - Southeast Banks
|
$41.57
|
-0.67
-1.59% |
$42.35
|
175,706
85.29% of 50 DAV
50 DAV is 206,000
|
$42.66
-2.56%
|
7/19/2016
|
$26.64
|
PP = $26.41
|
|
MB = $27.73
|
Most Recent Note - 2/27/2017 5:32:30 PM
G - Still holding its ground stubbornly and perched at all-time highs. Recently reported earnings +8% on +20% sales revenues for the Dec '16 quarter, below the +25% minimum guideline (C criteria), raising fundamental concerns. Its 50 DMA line ($38.92) defines important near-term support where a subsequent violation would trigger a technical sell signal.
>>> FEATURED STOCK ARTICLE : Perched Near All-Time High After Concerns Raised by Latest Earnings - 2/22/2017 |
View all notes |
Set NEW NOTE alert |
Company Profile |
SEC
News |
Chart |
Request a new note
C
A
S
I |
INGN
-
NASDAQ
Inogen Inc
HEALTH SERVICES - Medical Instruments and Supplies
|
$68.62
|
-0.49
-0.71% |
$70.50
|
350,553
280.44% of 50 DAV
50 DAV is 125,000
|
$69.94
-1.89%
|
2/27/2017
|
$68.69
|
PP = $69.94
|
|
MB = $73.44
|
Most Recent Note - 2/28/2017 12:21:23 PM
Y - Touching new all-time highs today. Highlighted in yellow with pivot point cited based on its 2/21/17 high in the 2/27/17 mid-day report (read here) and noted -"Perched near all-time highs after a saucer-with-handle base. Subsequent volume-driven gains for new highs coupled with strong earnings may clinch a technical buy signal. Reported earnings +23% on +33% sales revenues for the Sep '16 quarter, slightly below the +25% minimum guideline. Due to report Dec '16 earnings news on 2/28/17, and volume and volatility often increase near earnings news. Rebounded and made gradual progress since dropped from the Featured Stocks list on 10/27/16." See the latest FSU analysis for more details and a new annotated graph.
>>> FEATURED STOCK ARTICLE : Rebound Above 50-Day Moving Average Line Helped Outlook - 10/20/2016 |
View all notes |
Set NEW NOTE alert |
Company Profile |
SEC
News |
Chart |
Request a new note
C
A
S
I |
PLAY
-
NASDAQ
Dave & Buster's Ent Inc
Retail-Restaurants
|
$57.19
|
+0.13
0.23% |
$57.47
|
724,999
129.93% of 50 DAV
50 DAV is 558,000
|
$59.63
-4.09%
|
2/23/2017
|
$55.41
|
PP = $58.35
|
|
MB = $61.27
|
Most Recent Note - 2/23/2017 5:28:18 PM
Y - Slumped near its 50 DMA line. It was highlighted in yellow with pivot point cited based on its 1/04/17 high plus 10 cents in the earlier mid-day report (read here). Subsequent gains for new highs with above average volume may trigger a convincing technical buy signal. Recently wedged to new highs with gains lacking great volume. Found support near its 50 DMA line while consolidating since a big "breakaway gap" on 12/07/16 after reporting better than expected earnings +108% on +19% sales revenues for the Oct '16 quarter. Following its $16 IPO on 10/10/14 it completed Secondary Offerings on 2/05/15, 5/27/15, and 10/01/15. See the latest FSU analysis for more details and a new annotated graph.
>>> FEATURED STOCK ARTICLE : Consolidating Near 50 DMA After Recent Gains Lacked Volume - 2/23/2017 |
View all notes |
Set NEW NOTE alert |
Company Profile |
SEC
News |
Chart |
Request a new note
C
A
S
I |
LITE
-
NASDAQ
Lumentum Holdings Inc
TELECOMMUNICATIONS - Cables / Satalite Equipment
|
$45.90
|
-0.55
-1.18% |
$47.35
|
1,110,875
87.47% of 50 DAV
50 DAV is 1,270,000
|
$53.70
-14.52%
|
2/8/2017
|
$44.60
|
PP = $44.80
|
|
MB = $47.04
|
Most Recent Note - 2/27/2017 12:38:23 PM
Y - Early lows tested prior highs in the $44-45 area previously noted as support to watch. Retreated from all-time highs with 4 consecutive losses and signs of distributional pressure. Color code was changed to yellow after slumping below its "max buy" level.
>>> FEATURED STOCK ARTICLE : Gap Up Gain and Strong Finish Triggered Technical Buy Signal - 2/8/2017 |
View all notes |
Set NEW NOTE alert |
Company Profile |
SEC
News |
Chart |
Request a new note
C
A
S
I |
Symbol/Exchange
Company Name
Industry Group |
PRICE |
CHANGE
(%Change) |
Day High |
Volume
(% DAV)
(% 50 day avg vol) |
52 Wk Hi
% From Hi |
Featured
Date |
Price
Featured |
Pivot Featured |
|
Max Buy |
LCII
-
NYSE
L C I Industries
MATERIALS and CONSTRUCTION - General Building Materials
|
$107.70
|
-3.65
-3.28% |
$111.75
|
125,811
77.66% of 50 DAV
50 DAV is 162,000
|
$117.15
-8.07%
|
11/29/2016
|
$106.29
|
PP = $101.00
|
|
MB = $106.05
|
Most Recent Note - 2/28/2017 4:52:17 PM
G - Slumped below its 50 DMA line ($110) and closed near the session low. Further deterioration below recent low ($104.10 on 2/14/17) may trigger a more worrisome technical sell signal. Fundamentals through Dec '16 remain strong.
>>> FEATURED STOCK ARTICLE : Distributional Action While Retreating From Highs - 1/30/2017 |
View all notes |
Set NEW NOTE alert |
Company Profile |
SEC
News |
Chart |
Request a new note
C
A
S
I |