You are not logged in.
This means you
CAN ONLY VIEW reports that were published prior to Wednesday, April 2, 2025.
You
MUST UPGRADE YOUR MEMBERSHIP if you want to see any current reports.
AFTER MARKET UPDATE - WEDNESDAY, FEBRUARY 8TH, 2017
Previous After Market Report Next After Market Report >>>
|
|
|
|
DOW |
-35.95 |
20,054.34 |
-0.18% |
|
Volume |
1,009,771,400 |
+3% |
|
Volume |
1,773,580,110 |
+2% |
|
NASDAQ |
+8.23 |
5,682.45 |
+0.15% |
|
Advancers |
1,657 |
56% |
|
Advancers |
1,288 |
45% |
|
S&P 500 |
+1.59 |
2,294.67 |
+0.07% |
|
Decliners |
1,282 |
44% |
|
Decliners |
1,561 |
55% |
|
Russell 2000 |
-2.32 |
1,358.74 |
-0.17% |
|
52 Wk Highs |
81 |
|
|
52 Wk Highs |
119 |
|
|
S&P 600 |
-1.31 |
829.15 |
-0.16% |
|
52 Wk Lows |
28 |
|
|
52 Wk Lows |
44 |
|
|
 |
Major Averages Show Mixed Action
Kenneth J. Gruneisen - Passed the CAN SLIM® Master's Exam
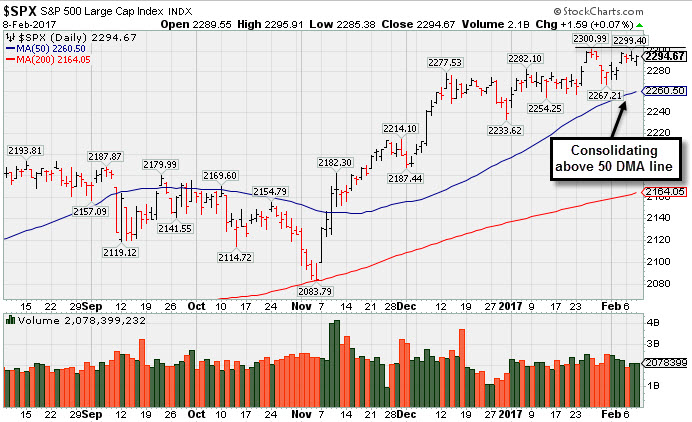
Stocks finished mostly higher on Tuesday. The Dow gained 37 points to 20090. The S&P 500 was flat at 2293 and the Nasdaq Composite advanced 10 points to 5674. Volume totals were higher than the prior session totals on the NYSE and on the Nasdaq exchange. Advancers led decliners by a 4-3 margin the NYSE but decliners led advancers by nearly 4-3 on the Nasdaq exchange. There were 27 high-ranked companies from the Leaders List that made new 52-week highs and were listed on the BreakOuts Page, versus the total of 36 on the prior session. New 52-week highs totals contracted but still solidly outnumbered new 52-week lows on both the NYSE and the Nasdaq exchange.
PICTURED: The S&P 500 Index is consolidating well above its 50-day moving average (DMA) line.
Leadership remains healthy as the major averages' (M criteria) have maintained an upward trend. New buying efforts should only be made in candidates with superior fundamental and technical characteristics. The Featured Stocks Page lists noteworthy high-ranked leaders.
The major averages fluctuated in choppy trading Wednesday as oil prices advanced and investors digested corporate earnings releases. NYMEX WTI crude added 0.5% to $52.43/barrel after government data showed that U.S. gasoline supplies fell 869,000 barrels. In earnings, Coherent jumped 18.2% to 190.65 after reporting revenue increased 82% year-over-year. On the data front, MBA mortgage applications rose 2.3% last week, after declining 3.2% in the previous week.
Seven of 11 sectors in the S&P 500 finished higher on the session with Real Estate and Utilities shares outperforming. In the consumer space, Panera Bread (PNRA +8.69%) rallied as higher prices for the restaurant chain helped boost quarterly results. Technology stocks advanced with Microchip (MCHP +6.00%) rose after being the subject of positive analyst commentary.
In Health Care, Allergan (AGN +3.68%) rose as the drugmaker’s revenue topped Street forecasts on increased sales of therapeutic treatments. Gilead Sciences (GILD -8.61%) fell amid reports its hepatitis C franchise has fewer patients left to treat. Financials finished in negative territory with Morgan Stanley (MS -2.14%) falling.
Treasuries advanced with the benchmark 10-year note up 15/32 to yield 2.33%. In commodities, COMEX gold gained 0.5% to $1239.90/ounce. In FOREX, the Dollar Index was little changed on the session. |
 Kenneth J. Gruneisen started out as a licensed stockbroker in August 1987, a couple of months prior to the historic stock market crash that took the Dow Jones Industrial Average down -22.6% in a single day. He has published daily fact-based fundamental and technical analysis on high-ranked stocks online for two decades. Through FACTBASEDINVESTING.COM, Kenneth provides educational articles, news, market commentary, and other information regarding proven investment systems that work in good times and bad.
Comments contained in the body of this report are technical opinions only and are not necessarily those of Gruneisen Growth Corp. The material herein has been obtained from sources believed to be reliable and accurate, however, its accuracy and completeness cannot be guaranteed. Our firm, employees, and customers may effect transactions, including transactions contrary to any recommendation herein, or have positions in the securities mentioned herein or options with respect thereto. Any recommendation contained in this report may not be suitable for all investors and it is not to be deemed an offer or solicitation on our part with respect to the purchase or sale of any securities. |
|
 |
Gold & Silver and Retail Indexes Led Group Gainers
Kenneth J. Gruneisen - Passed the CAN SLIM® Master's Exam
The Retail Index ($RLX +1.01%) rose but the Broker/Dealer Index ($XBD -0.94%) and the Bank Index ($BKX -0.96%) both created a drag on the major indices on Wednesday. The tech sector was mostly quiet as the Biotechnology Index ($BTK +0.01%) finished flat and the Semiconductor Index ($SOX +0.16%) rose slightly but the Networking Index ($NWX -0.51%) was a laggard as it fell modestly. The Oil Services Index ($OSX -0.11%) inched lower and the Integrated Oil Index ($XOI +0.28%) posted a small gain, meanwhile the Gold & Silver Index ($XAU +1.51%) was a standout gainer. Charts courtesy www.stockcharts.com
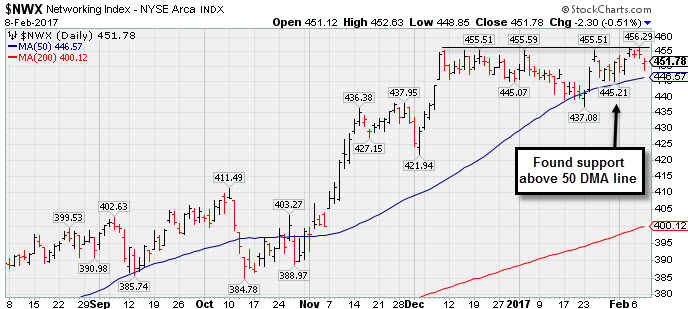 PICTURED: The Networking Index ($NWX -0.51%) found support recently above its 50-day moving average (DMA) line.
| Oil Services |
$OSX |
177.50 |
-0.19 |
-0.11% |
-3.42% |
| Integrated Oil |
$XOI |
1,210.50 |
+3.34 |
+0.28% |
-4.53% |
| Semiconductor |
$SOX |
972.14 |
+1.55 |
+0.16% |
+7.24% |
| Networking |
$NWX |
451.78 |
-2.30 |
-0.51% |
+1.27% |
| Broker/Dealer |
$XBD |
217.97 |
-2.07 |
-0.94% |
+6.18% |
| Retail |
$RLX |
1,395.46 |
+14.01 |
+1.01% |
+3.91% |
| Gold & Silver |
$XAU |
96.72 |
+1.43 |
+1.50% |
+22.65% |
| Bank |
$BKX |
91.50 |
-0.89 |
-0.96% |
-0.32% |
| Biotech |
$BTK |
3,294.10 |
+0.34 |
+0.01% |
+7.12% |
|
|
|
 |
Gap Up Gain and Strong Finish Triggered Technical Buy Signal
Kenneth J. Gruneisen - Passed the CAN SLIM® Master's Exam
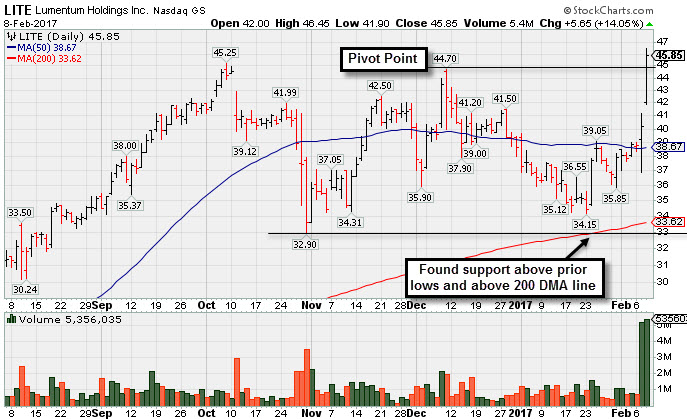
Lumentum Holdings Inc (LITE +$5.65 or +14.05% to $45.85) finished strong after highlighted in yellow with new pivot point cited based on its 12/09/16 high plus 10 cents in the earlier mid-day report (read here). The big gain and strong finish above the pivot point triggered a convincing technical buy signal. It reported earnings +73% on +21% sales revenues for the Dec '16 quarter, continuing its strong earnings track record. It gapped up today hitting a new high. Volume and volatility often increase near earnings news.
A rebound above its 50-day moving average (DMA) line with a volume-driven gain was noted on the prior session as it helped its outlook improve. The stock's Relative Strength rating has improved from 81 to 87 since 1/05/17 when dropped from the Featured Stocks list. It stayed well above prior lows and above its 200 DMA line during its consolidation since last shown in this FSU section with an annotated graph on 12/08/16 under the headline, "Challenging its High With Big Volume-Driven Gain".
This high-ranked leader from the Telecom - Fiber Optics group was previously noted in the 10/28/16 mid-day report - "Reported Sep '16 earnings +96% on +21% sales revenues helping its quarterly sales and earnings history better match with the fact-based investment system's fundamental guidelines." Its annual earnings (A criteria) history has been strong, helping it earn the highest possible Earnings Per Share (EPS) rank of 99, well above the +80 minimum guideline.
The number of top-rated funds owning its shares rose from 266 in Dec '15 to 397 in Dec '16, a reassuring sign concerning the I criteria. It has a Timeliness Rating of B and a Sponsorship Rating of B. |
|
|
Color Codes Explained :
Y - Better candidates highlighted by our
staff of experts.
G - Previously featured
in past reports as yellow but may no longer be buyable under the
guidelines.
***Last / Change / Volume data in this table is the closing quote data***
Symbol/Exchange
Company Name
Industry Group |
PRICE |
CHANGE
(%Change) |
Day High |
Volume
(% DAV)
(% 50 day avg vol) |
52 Wk Hi
% From Hi |
Featured
Date |
Price
Featured |
Pivot Featured |
|
Max Buy |
THO
-
NYSE
Thor Industries Inc
AUTOMOTIVE - Recreational Vehicles
|
$108.75
|
+4.24
4.06% |
$109.85
|
976,445
139.89% of 50 DAV
50 DAV is 698,000
|
$108.45
0.28%
|
1/24/2017
|
$100.52
|
PP = $108.45
|
|
MB = $113.87
|
 Most Recent Note - 2/8/2017 6:57:23 PM
Y - Gapped up and rallied above its pivot point with today's gain backed by very near the +40% above average volume needed to trigger a proper technical buy signal.
>>> FEATURED STOCK ARTICLE : Rose From Support at 50-Day Moving Average Line - 1/24/2017 |
View all notes |
Set NEW NOTE alert |
Company Profile |
SEC
News |
Chart |
Request a new note
C
A
S
I |
CSFL
-
NASDAQ
Centerstate Banks Inc
Banks-Southeast
|
$24.13
|
-0.29
-1.19% |
$24.42
|
245,830
81.13% of 50 DAV
50 DAV is 303,000
|
$26.30
-8.25%
|
10/10/2016
|
$18.20
|
PP = $18.37
|
|
MB = $19.29
|
Most Recent Note - 2/6/2017 5:54:12 PM
G - Consolidating after gapping up on the prior session finding support near its 50 DMA line. Completed a new Public Offering of shares on 1/10/17. See the latest FSU analysis for more details and a new annotated graph.
>>> FEATURED STOCK ARTICLE : Found Support Near 50-Day Average Following Offering - 2/6/2017 |
View all notes |
Set NEW NOTE alert |
Company Profile |
SEC
News |
Chart |
Request a new note
C
A
S
I |
IESC
-
NASDAQ
I E S Holdings Inc
Bldg-Maintenance and Svc
|
$18.60
|
-0.35
-1.85% |
$18.95
|
48,505
64.67% of 50 DAV
50 DAV is 75,000
|
$23.00
-19.13%
|
11/23/2016
|
$19.35
|
PP = $18.26
|
|
MB = $19.17
|
Most Recent Note - 2/7/2017 5:40:30 PM
G - Slumping below its 50 DMA line recently raising concerns. Prior low ($18.05 on 1/18/17) defines important support near prior highs. Due to report Dec '16 quarterly results, and volume and volatility often increase near earnings news.
>>> FEATURED STOCK ARTICLE : Violated 50-Day Moving Average Line and Now Testing Prior Highs - 1/19/2017 |
View all notes |
Set NEW NOTE alert |
Company Profile |
SEC
News |
Chart |
Request a new note
C
A
S
I |
BERY
-
NYSE
Berry Plastics Group Inc
CONSUMER NON-DURABLES - Packaging and Containers
|
$49.42
|
-0.11
-0.22% |
$49.64
|
1,682,033
120.58% of 50 DAV
50 DAV is 1,395,000
|
$52.97
-6.70%
|
11/30/2016
|
$50.26
|
PP = $46.47
|
|
MB = $48.79
|
Most Recent Note - 2/7/2017 5:38:04 PM
G - Slumped below its 50 DMA line with damaging volume-driven losses raising concerns. Recent lows in the $48.50 area define near-term support where a violation would trigger a more worrisome technical sell signal. Reported earnings +43% on -7% sales revenues for the Dec '16 quarter. See the latest FSU analysis for more details and a new annotated graph.
>>> FEATURED STOCK ARTICLE : Recent 50-Day Violation Raised Concerns - 2/7/2017 |
View all notes |
Set NEW NOTE alert |
Company Profile |
SEC
News |
Chart |
Request a new note
C
A
S
I |
EVR
-
NYSE
Evercore Partners Inc
FINANCIAL SERVICES - Investment Banking
|
$77.50
|
-1.40
-1.77% |
$78.45
|
644,072
148.75% of 50 DAV
50 DAV is 433,000
|
$81.75
-5.20%
|
1/5/2017
|
$71.40
|
PP = $72.07
|
|
MB = $75.67
|
Most Recent Note - 2/7/2017 12:21:50 PM
G - Pulling back today after 5 consecutive volume-driven gains, getting very extended from its prior base. Recently reported Dec '16 quarterly earnings +17% on +9% sales revenues, below the +25% minimum earnings guideline (C criteria), raising fundamental concerns.
>>> FEATURED STOCK ARTICLE : Perched Near All-Time High Building New Flat Base - 1/5/2017 |
View all notes |
Set NEW NOTE alert |
Company Profile |
SEC
News |
Chart |
Request a new note
C
A
S
I |
Symbol/Exchange
Company Name
Industry Group |
PRICE |
CHANGE
(%Change) |
Day High |
Volume
(% DAV)
(% 50 day avg vol) |
52 Wk Hi
% From Hi |
Featured
Date |
Price
Featured |
Pivot Featured |
|
Max Buy |
HTHT
-
NASDAQ
China Lodging Group Ads
LEISURE - Lodging
|
$55.38
|
+0.23
0.42% |
$55.68
|
88,977
53.60% of 50 DAV
50 DAV is 166,000
|
$59.20
-6.45%
|
9/29/2016
|
$46.12
|
PP = $47.82
|
|
MB = $50.21
|
Most Recent Note - 2/3/2017 5:03:10 PM
G - Gapped up today and hit a new all-time high. Prior highs in the $54 area define near-term support above its 50 DMA line ($50.62). Repeatedly noted with caution in prior reports - "Reported earnings +10% on +6% sales revenues for the Sep '16 quarter, below the +25% minimum earnings guideline (C criteria), raising concerns."
>>> FEATURED STOCK ARTICLE : Slump Below "Max Buy" Level But Fundamental Concerns Were Raised - 1/6/2017 |
View all notes |
Set NEW NOTE alert |
Company Profile |
SEC
News |
Chart |
Request a new note
C
A
S
I |
LMAT
-
NASDAQ
Lemaitre Vascular Inc
Medical-Products
|
$22.79
|
+0.06
0.26% |
$22.89
|
57,239
49.77% of 50 DAV
50 DAV is 115,000
|
$27.04
-15.71%
|
12/22/2016
|
$24.99
|
PP = $25.09
|
|
MB = $26.34
|
Most Recent Note - 2/6/2017 6:08:17 PM
G - Sank further below its 50 DMA line with above average volume behind today's loss. Its Relative Strength Rating has fallen to 79, below the 80+ minimum guideline for buy candidates.A rebound above its 50 DMA line ($23.82) is needed for its outlook to improve.
>>> FEATURED STOCK ARTICLE : Concerns Increase While Lingering Below 50-Day Moving Average - 1/27/2017 |
View all notes |
Set NEW NOTE alert |
Company Profile |
SEC
News |
Chart |
Request a new note
C
A
S
I |
BEAT
-
NASDAQ
BioTelemetry Inc
Medical-Services
|
$23.75
|
-0.10
-0.42% |
$23.85
|
106,918
38.05% of 50 DAV
50 DAV is 281,000
|
$24.45
-2.86%
|
12/19/2016
|
$22.91
|
PP = $21.78
|
|
MB = $22.87
|
Most Recent Note - 2/3/2017 5:08:20 PM
G - Hit a new high with today's 4th consecutive gain backed by near average volume. Prior highs in the $21-22 area and its 50 DMA line define important near-term support to watch.
>>> FEATURED STOCK ARTICLE : Volume Totals Cooling While Consolidating Above Prior Highs - 1/10/2017 |
View all notes |
Set NEW NOTE alert |
Company Profile |
SEC
News |
Chart |
Request a new note
C
A
S
I |
PATK
-
NASDAQ
Patrick Industries Inc
WHOLESALE - Building Materials Wholesale
|
$82.00
|
+0.80
0.99% |
$82.15
|
82,431
68.12% of 50 DAV
50 DAV is 121,000
|
$83.50
-1.80%
|
11/29/2016
|
$72.45
|
PP = $69.63
|
|
MB = $73.11
|
Most Recent Note - 2/6/2017 6:09:54 PM
G - Still quietly perched near all-time highs, extended from its prior base. Its 50 DMA line ($77.02) defines support to watch above prior highs.
>>> FEATURED STOCK ARTICLE : Perched Near All-Time High Extended From Prior Base - 1/31/2017 |
View all notes |
Set NEW NOTE alert |
Company Profile |
SEC
News |
Chart |
Request a new note
C
A
S
I |
ESNT
-
NYSE
Essent Group Ltd
Finance-MrtgandRel Svc
|
$36.29
|
+0.25
0.69% |
$36.32
|
477,846
73.63% of 50 DAV
50 DAV is 649,000
|
$36.48
-0.51%
|
1/25/2017
|
$34.09
|
PP = $34.04
|
|
MB = $35.74
|
Most Recent Note - 2/3/2017 5:00:25 PM
G - Posted a gain with light volume today rising above its "max buy" level and its color code is changed to green. Its 50 DMA line ($32.53) defines important near-term support above prior lows in the $31.50 area.
>>> FEATURED STOCK ARTICLE : Twice Average Volume Behind Big Breakout Gain - 1/25/2017 |
View all notes |
Set NEW NOTE alert |
Company Profile |
SEC
News |
Chart |
Request a new note
C
A
S
I |
Symbol/Exchange
Company Name
Industry Group |
PRICE |
CHANGE
(%Change) |
Day High |
Volume
(% DAV)
(% 50 day avg vol) |
52 Wk Hi
% From Hi |
Featured
Date |
Price
Featured |
Pivot Featured |
|
Max Buy |
ANET
-
NYSE
Arista Networks Inc
TELECOMMUNICATIONS - Communication Equipment
|
$97.46
|
+1.47
1.53% |
$98.39
|
519,519
72.56% of 50 DAV
50 DAV is 716,000
|
$103.00
-5.38%
|
12/30/2016
|
$96.77
|
PP = $99.00
|
|
MB = $103.95
|
Most Recent Note - 2/6/2017 5:58:26 PM
G - Consolidating near its 50 DMA line ($95.60) with volume totals cooling while rebounding after a damaging gap down on 1/17/17. Subsequent losses on above average volume would raise greater concerns.
>>> FEATURED STOCK ARTICLE : Technical Damages Raised Concern and Triggered Technical Sell Signal - 1/18/2017 |
View all notes |
Set NEW NOTE alert |
Company Profile |
SEC
News |
Chart |
Request a new note
C
A
S
I |
VBTX
-
NASDAQ
Veritex Holdings Inc
BANKING - Regional - Southwest Banks
|
$27.89
|
-0.30
-1.06% |
$28.02
|
63,241
70.27% of 50 DAV
50 DAV is 90,000
|
$29.33
-4.91%
|
1/23/2017
|
$27.30
|
PP = $27.87
|
|
MB = $29.26
|
Most Recent Note - 2/3/2017 5:06:40 PM
Y - Hit a new high with today's big gain backed by +51% above average volume clinching a technical buy signal, however it closed near the previously cited "max buy" level.
>>> FEATURED STOCK ARTICLE : Challenged Highs But Ended in Bottom Third of Intra-day Range - 1/23/2017 |
View all notes |
Set NEW NOTE alert |
Company Profile |
SEC
News |
Chart |
Request a new note
C
A
S
I |
SFBS
-
NASDAQ
Servisfirst Bancshares
BANKING - Regional - Southeast Banks
|
$39.66
|
-0.23
-0.58% |
$40.02
|
133,210
52.65% of 50 DAV
50 DAV is 253,000
|
$41.16
-3.64%
|
7/19/2016
|
$26.64
|
PP = $26.41
|
|
MB = $27.73
|
Most Recent Note - 2/6/2017 6:11:41 PM
G - Holding its ground near all-time highs. Recently reported earnings +8% on +20% sales revenues for the Dec '16 quarter, below the +25% minimum guideline (C criteria), raising fundamental concerns. Its 50 DMA line ($37.52) defines important near-term support above recent lows in the $36 area. Subsequent violations would trigger technical sell signals.
>>> FEATURED STOCK ARTICLE : Stubbornly Holding Ground Near Highs - 1/12/2017 |
View all notes |
Set NEW NOTE alert |
Company Profile |
SEC
News |
Chart |
Request a new note
C
A
S
I |
LITE
-
NASDAQ
Lumentum Holdings Inc
TELECOMMUNICATIONS - Cables / Satalite Equipment
|
$45.85
|
+5.65
14.05% |
$46.45
|
5,356,045
556.76% of 50 DAV
50 DAV is 962,000
|
$45.25
1.33%
|
2/8/2017
|
$44.60
|
PP = $44.80
|
|
MB = $47.04
|
Most Recent Note - 2/8/2017 6:54:25 PM
Y - Finished strong after highlighted in yellow with new pivot point cited based on its 12/09/16 high plus 10 cents. The gain and strong finish above the pivot point triggered a convincing technical buy signal. Reported earnings +73% on +21% sales revenues for the Dec '16 quarter and gapped up today hitting a new high. Volume and volatility often increase near earnings news. Rebound above its 50 DMA line with a volume-driven gain on the prior session helping its outlook improve. Relative Strength rating has improved from 81 to 87 since 1/05/17 when dropped from the Featured Stocks list, and it stayed well above its 200 DMA line. See the latest FSU analysis for more details and a new annotated graph.
>>> FEATURED STOCK ARTICLE : Gap Up Gain and Strong Finish Triggered Technical Buy Signal - 2/8/2017 |
View all notes |
Set NEW NOTE alert |
Company Profile |
SEC
News |
Chart |
Request a new note
C
A
S
I |
LCII
-
NYSE
L C I Industries
MATERIALS and CONSTRUCTION - General Building Materials
|
$110.40
|
+2.35
2.17% |
$110.40
|
246,114
143.93% of 50 DAV
50 DAV is 171,000
|
$117.15
-5.76%
|
11/29/2016
|
$106.29
|
PP = $101.00
|
|
MB = $106.05
|
Most Recent Note - 2/6/2017 6:04:54 PM
G - Sputtering just below its 50 DMA line ($109.10). Losses leading to deterioration below prior lows ($105.05 on 1/20/17) may trigger technical sell signals. Recently, Drew Industries (DW) announced a new name LCI Industries (LCII).
>>> FEATURED STOCK ARTICLE : Distributional Action While Retreating From Highs - 1/30/2017 |
View all notes |
Set NEW NOTE alert |
Company Profile |
SEC
News |
Chart |
Request a new note
C
A
S
I |
Symbol/Exchange
Company Name
Industry Group |
PRICE |
CHANGE
(%Change) |
Day High |
Volume
(% DAV)
(% 50 day avg vol) |
52 Wk Hi
% From Hi |
Featured
Date |
Price
Featured |
Pivot Featured |
|
Max Buy |
|
|
|
THESE ARE NOT BUY RECOMMENDATIONS!
Comments contained in the body of this report are technical
opinions only. The material herein has been obtained
from sources believed to be reliable and accurate, however,
its accuracy and completeness cannot be guaranteed.
This site is not an investment advisor, hence it does
not endorse or recommend any securities or other investments.
Any recommendation contained in this report may not
be suitable for all investors and it is not to be deemed
an offer or solicitation on our part with respect to
the purchase or sale of any securities. All trademarks,
service marks and trade names appearing in this report
are the property of their respective owners, and are
likewise used for identification purposes only.
This report is a service available
only to active Paid Premium Members.
You may opt-out of receiving report notifications
at any time. Questions or comments may be submitted
by writing to Premium Membership Services 665 S.E. 10 Street, Suite 201 Deerfield Beach, FL 33441-5634 or by calling 1-800-965-8307
or 954-785-1121.
|
|
|