***Last / Change / Volume data in this table is the closing quote data***
Symbol/Exchange
Company Name
Industry Group |
PRICE |
CHANGE
(%Change) |
Day High |
Volume
(% DAV)
(% 50 day avg vol) |
52 Wk Hi
% From Hi |
Featured
Date |
Price
Featured |
Pivot Featured |
|
Max Buy |
THO
-
NYSE
Thor Industries Inc
AUTOMOTIVE - Recreational Vehicles
|
$113.55
|
+2.73
2.46% |
$114.51
|
578,308
118.02% of 50 DAV
50 DAV is 490,000
|
$112.89
0.58%
|
1/24/2017
|
$100.52
|
PP = $108.45
|
|
MB = $113.87
|
 Most Recent Note - 3/1/2017 5:41:17 PM
Y - Posted a gain with above average volume approaching its "max buy" level. Prior highs in the $108 area define support to watch above its 50 DMA line on pullbacks.
>>> FEATURED STOCK ARTICLE : Rose From Support at 50-Day Moving Average Line - 1/24/2017 |
View all notes |
Set NEW NOTE alert |
Company Profile |
SEC
News |
Chart |
Request a new note
C
A
S
I |
SBCF
-
NASDAQ
Seacoast Banking Corp Fl
BANKING - Regional - Mid-Atlantic Banks
|
$24.00
|
+0.77
3.31% |
$24.02
|
430,737
118.66% of 50 DAV
50 DAV is 363,000
|
$25.13
-4.50%
|
2/13/2017
|
$24.84
|
PP = $23.10
|
|
MB = $24.26
|
Most Recent Note - 2/27/2017 5:30:44 PM
Y - Churning above average volume and consolidating since its 2/13/17 gap up was highlighted in yellow with pivot point cited based on its 1/04/17 high plus 10 cents. Its solid volume-driven gain clinched a technical buy signal. Completed a new Public Offering on 2/15/17. Prior highs in the $23 area define initial support to watch.
>>> FEATURED STOCK ARTICLE : Gap Up Gain and Strong Finish Triggered Technical Buy Signal - 2/13/2017 |
View all notes |
Set NEW NOTE alert |
Company Profile |
SEC
News |
Chart |
Request a new note
C
A
S
I |
CSFL
-
NASDAQ
Centerstate Banks Inc
Banks-Southeast
|
$25.33
|
+0.62
2.51% |
$25.42
|
249,919
92.22% of 50 DAV
50 DAV is 271,000
|
$26.30
-3.69%
|
10/10/2016
|
$18.20
|
PP = $18.37
|
|
MB = $19.29
|
Most Recent Note - 2/28/2017 4:54:51 PM
G - Consolidating just below its 50 DMA line ($24.98). Recent low ($23.80 on 2/08/17) defines important near-term support where further deterioration would trigger a technical sell signal. Completed a new Public Offering of shares on 1/10/17.
>>> FEATURED STOCK ARTICLE : Found Support Near 50-Day Average Following Offering - 2/6/2017 |
View all notes |
Set NEW NOTE alert |
Company Profile |
SEC
News |
Chart |
Request a new note
C
A
S
I |
IESC
-
NASDAQ
Integrated Electric Svcs
Bldg-Maintenance and Svc
|
$19.95
|
+1.20
6.40% |
$20.25
|
75,443
132.36% of 50 DAV
50 DAV is 57,000
|
$23.00
-13.26%
|
11/23/2016
|
$19.35
|
PP = $18.26
|
|
MB = $19.17
|
Most Recent Note - 3/1/2017 5:30:22 PM
G - Gapped up today and rallied above its 50 DMA line helping its outlook improve. Its Relative Strength rating at 77 remains below the 80+ minimum guideline for buy candidates. Prior low ($18.05 on 1/18/17) defines important support near prior highs. Recently reported Dec '16 quarterly earnings -33% on +27% sales revenues, below the +25% minimum earnings guideline (C criteria), raising fundamental concerns.
>>> FEATURED STOCK ARTICLE : Violated 50-Day Moving Average Line and Now Testing Prior Highs - 1/19/2017 |
View all notes |
Set NEW NOTE alert |
Company Profile |
SEC
News |
Chart |
Request a new note
C
A
S
I |
NSP
-
NYSE
Insperity Inc
Comml Svcs-Outsourcing
|
$83.85
|
+0.60
0.72% |
$85.05
|
273,066
184.50% of 50 DAV
50 DAV is 148,000
|
$86.35
-2.90%
|
2/14/2017
|
$84.30
|
PP = $82.28
|
|
MB = $86.39
|
Most Recent Note - 2/28/2017 12:30:50 PM
Y - Recently consolidating near prior highs defining initial support. It stalled soon after highlighted in yellow with pivot point cited based on its 7/26/16 high plus 10 cents in the 2/14/17 mid-day report (read here). More damaging losses below the recent low ($79.97 on 2/24/17) would raise concerns.
>>> FEATURED STOCK ARTICLE : Big Volume-Driven Gains Indicative of Institutional Demand - 2/14/2017 |
View all notes |
Set NEW NOTE alert |
Company Profile |
SEC
News |
Chart |
Request a new note
C
A
S
I |
Symbol/Exchange
Company Name
Industry Group |
PRICE |
CHANGE
(%Change) |
Day High |
Volume
(% DAV)
(% 50 day avg vol) |
52 Wk Hi
% From Hi |
Featured
Date |
Price
Featured |
Pivot Featured |
|
Max Buy |
BERY
-
NYSE
Berry Plastics Group Inc
CONSUMER NON-DURABLES - Packaging and Containers
|
$50.96
|
+0.63
1.25% |
$51.25
|
921,535
77.26% of 50 DAV
50 DAV is 1,192,800
|
$52.97
-3.79%
|
11/30/2016
|
$50.26
|
PP = $46.47
|
|
MB = $48.79
|
Most Recent Note - 2/28/2017 4:54:15 PM
G - Relative Strength Rating is 79, just below the 80+ minimum for buy candidates under the fact-based investment system, and it has been consolidating near its 50 DMA line. Recent lows in the $48.50 area define near-term support. Damaging losses and violations would trigger a more worrisome technical sell signal. Reported earnings +43% on -7% sales revenues for the Dec '16 quarter.
>>> FEATURED STOCK ARTICLE : Recent 50-Day Violation Raised Concerns - 2/7/2017 |
View all notes |
Set NEW NOTE alert |
Company Profile |
SEC
News |
Chart |
Request a new note
C
A
S
I |
EVR
-
NYSE
Evercore Partners Inc
FINANCIAL SERVICES - Investment Banking
|
$81.60
|
+2.05
2.58% |
$82.29
|
581,069
135.76% of 50 DAV
50 DAV is 428,000
|
$81.75
-0.18%
|
1/5/2017
|
$71.40
|
PP = $72.07
|
|
MB = $75.67
|
Most Recent Note - 2/27/2017 9:57:56 AM
G - Still holding its ground stubbornly, extended from its prior base. Its 50 DMA line and prior low ($74.75 on 2/08/17) define near-term support to watch. Recently reported Dec '16 quarterly earnings +17% on +9% sales revenues, below the +25% minimum earnings guideline (C criteria), raising fundamental concerns.
>>> FEATURED STOCK ARTICLE : Holding Ground After Latest Earnings Were Below +25% Guideline - 2/17/2017 |
View all notes |
Set NEW NOTE alert |
Company Profile |
SEC
News |
Chart |
Request a new note
C
A
S
I |
NTES
-
NASDAQ
Netease Inc Adr
INTERNET - Internet Information Providers
|
$302.58
|
-1.47
-0.48% |
$308.66
|
1,443,081
131.31% of 50 DAV
50 DAV is 1,099,000
|
$308.50
-1.92%
|
2/10/2017
|
$259.30
|
PP = $272.68
|
|
MB = $286.31
|
Most Recent Note - 2/24/2017 12:40:25 PM
G - Perched near all-time highs, extended from its prior base following a "breakaway gap" and additional volume-driven gains. Prior highs in the $272 area define initial support to watch on pullbacks.
>>> FEATURED STOCK ARTICLE : Rebounding With Earnings News Due Soon - 2/10/2017 |
View all notes |
Set NEW NOTE alert |
Company Profile |
SEC
News |
Chart |
Request a new note
C
A
S
I |
STMP
-
NASDAQ
Stamps.com Inc
INTERNET - Internet Software and Services
|
$120.85
|
-5.25
-4.16% |
$128.25
|
596,621
258.73% of 50 DAV
50 DAV is 230,600
|
$136.00
-11.14%
|
2/16/2017
|
$129.45
|
PP = $123.85
|
|
MB = $130.04
|
Most Recent Note - 3/1/2017 5:28:26 PM
G - Ended near the session low as more damaging distributional pressure today added to its streak of volume-driven losses. Its color code is changed to green after undercutting prior highs and its 50 DMA line triggering technical sell signals.
>>> FEATURED STOCK ARTICLE : Recent Gains Have Lacked Heavy Volume Indicative of Accumulation - 2/16/2017 |
View all notes |
Set NEW NOTE alert |
Company Profile |
SEC
News |
Chart |
Request a new note
C
A
S
I |
HTHT
-
NASDAQ
China Lodging Group Ads
LEISURE - Lodging
|
$60.61
|
+2.64
4.55% |
$60.75
|
155,956
118.15% of 50 DAV
50 DAV is 132,000
|
$59.20
2.38%
|
9/29/2016
|
$46.12
|
PP = $47.82
|
|
MB = $50.21
|
Most Recent Note - 3/1/2017 5:33:56 PM
G - Hit a new all-time high and finished near the session high with above average volume behind its big gain today. The recent low ($53.12 on 2/15/17) and its 50 DMA line ($52.42) define important near-term support to watch. Repeatedly noted with caution in prior reports - "Reported earnings +10% on +6% sales revenues for the Sep '16 quarter, below the +25% minimum earnings guideline (C criteria), raising concerns."
>>> FEATURED STOCK ARTICLE : Mostly Bullish Action Continues Since Latest Earnings Report - 2/9/2017 |
View all notes |
Set NEW NOTE alert |
Company Profile |
SEC
News |
Chart |
Request a new note
C
A
S
I |
Symbol/Exchange
Company Name
Industry Group |
PRICE |
CHANGE
(%Change) |
Day High |
Volume
(% DAV)
(% 50 day avg vol) |
52 Wk Hi
% From Hi |
Featured
Date |
Price
Featured |
Pivot Featured |
|
Max Buy |
BEAT
-
NASDAQ
BioTelemetry Inc
Medical-Services
|
$26.55
|
+1.10
4.32% |
$27.25
|
539,266
155.86% of 50 DAV
50 DAV is 346,000
|
$27.30
-2.75%
|
2/14/2017
|
$25.10
|
PP = $24.55
|
|
MB = $25.78
|
Most Recent Note - 2/27/2017 5:20:04 PM
G - Pulled back with heavy volume today and closed near its "max buy" level. Prior highs in the $24 area and its 50 DMA line ($23.17) define important near-term support.
>>> FEATURED STOCK ARTICLE : Perched Near All-Time High With Earnings Report Due - 2/21/2017 |
View all notes |
Set NEW NOTE alert |
Company Profile |
SEC
News |
Chart |
Request a new note
C
A
S
I |
PATK
-
NASDAQ
Patrick Industries Inc
WHOLESALE - Building Materials Wholesale
|
$82.40
|
+2.55
3.19% |
$83.25
|
108,902
90.00% of 50 DAV
50 DAV is 121,000
|
$86.10
-4.30%
|
11/29/2016
|
$72.45
|
PP = $69.63
|
|
MB = $73.11
|
Most Recent Note - 2/27/2017 5:37:39 PM
G - Found support recently near its 50 DMA line ($79.77) and posted a gain today with above average volume. Recent lows in the $76 area define support where more damaging losses may trigger a technical sell signal. Reported earnings +14% on +30% sales revenues for the Dec '16 quarter, below the +25% minimum earnings guideline (C criteria) raising fundamental concerns.
>>> FEATURED STOCK ARTICLE : Perched Near All-Time High Extended From Prior Base - 1/31/2017 |
View all notes |
Set NEW NOTE alert |
Company Profile |
SEC
News |
Chart |
Request a new note
C
A
S
I |
ESNT
-
NYSE
Essent Group Ltd
Finance-MrtgandRel Svc
|
$35.54
|
+0.73
2.10% |
$35.64
|
1,301,160
205.23% of 50 DAV
50 DAV is 634,000
|
$38.10
-6.72%
|
1/25/2017
|
$34.09
|
PP = $34.04
|
|
MB = $35.74
|
Most Recent Note - 3/1/2017 5:46:56 PM
Y - Rising near its "max buy" level with today's 4th consecutive gain on ever-increasing volume after finding support. Consolidating above its 50 DMA line and prior highs defining important near-term support in the $33-34 area.
>>> FEATURED STOCK ARTICLE : Twice Average Volume Behind Big Breakout Gain - 1/25/2017 |
View all notes |
Set NEW NOTE alert |
Company Profile |
SEC
News |
Chart |
Request a new note
C
A
S
I |
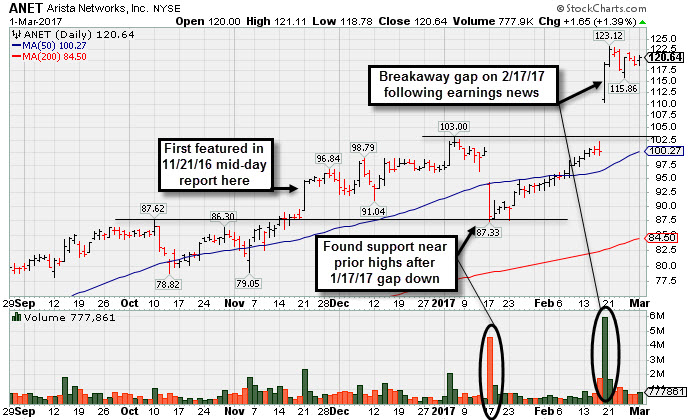
ANET
-
NYSE
Arista Networks Inc
TELECOMMUNICATIONS - Communication Equipment
|
$120.64
|
+1.65
1.39% |
$121.11
|
777,861
92.49% of 50 DAV
50 DAV is 841,000
|
$123.12
-2.01%
|
12/30/2016
|
$96.77
|
PP = $99.00
|
|
MB = $103.95
|
Most Recent Note - 2/28/2017 4:53:14 PM
G - Holding its ground stubbornly, extended from prior highs in the $103 area following a big "breakaway gap" on 2/17/17. Reported earnings +30% on +34% sales revenues for the Dec '16 quarter and it was noted - "Recovered impressively and faces no resistance due to overhead supply, but it has not formed a sound base after its gap down on 1/17/17."
>>> FEATURED STOCK ARTICLE : Technical Damages Raised Concern and Triggered Technical Sell Signal - 1/18/2017 |
View all notes |
Set NEW NOTE alert |
Company Profile |
SEC
News |
Chart |
Request a new note
C
A
S
I |
VBTX
-
NASDAQ
Veritex Holdings Inc
BANKING - Regional - Southwest Banks
|
$29.05
|
+0.40
1.40% |
$29.25
|
116,495
121.35% of 50 DAV
50 DAV is 96,000
|
$29.43
-1.29%
|
1/23/2017
|
$27.30
|
PP = $27.87
|
|
MB = $29.26
|
Most Recent Note - 2/27/2017 5:35:59 PM
Y - Hovering near its "max buy" level. Prior highs in the $27 area and its 50 DMA line define important near-term support.
>>> FEATURED STOCK ARTICLE : Challenged Highs But Ended in Bottom Third of Intra-day Range - 1/23/2017 |
View all notes |
Set NEW NOTE alert |
Company Profile |
SEC
News |
Chart |
Request a new note
C
A
S
I |
Symbol/Exchange
Company Name
Industry Group |
PRICE |
CHANGE
(%Change) |
Day High |
Volume
(% DAV)
(% 50 day avg vol) |
52 Wk Hi
% From Hi |
Featured
Date |
Price
Featured |
Pivot Featured |
|
Max Buy |
IBP
-
NYSE
Installed Building Prod
DIVERSIFIED SERVICES - Business/Management Services
|
$49.45
|
+2.40
5.10% |
$50.00
|
295,549
184.72% of 50 DAV
50 DAV is 160,000
|
$47.95
3.13%
|
2/27/2017
|
$44.83
|
PP = $44.40
|
|
MB = $46.62
|
Most Recent Note - 3/1/2017 5:37:11 PM
G - Rallied further above its "max buy" level with today's 4th consecutive volume-driven gain, getting very extended from its prior base. No resistance remains due to overhead supply. Prior highs in the $44 area define initial support to watch. First highlighted in the 2/27/17 mid-day report with pivot point cited based on its 12/08/16 high plus 10 cents (read here). See the latest FSU analysis for more details and an annotated graph.
>>> FEATURED STOCK ARTICLE : Big Breakout Followed Solid Earnings News - 2/28/2017 |
View all notes |
Set NEW NOTE alert |
Company Profile |
SEC
News |
Chart |
Request a new note
C
A
S
I |
SFBS
-
NASDAQ
Servisfirst Bancshares
BANKING - Regional - Southeast Banks
|
$42.00
|
+0.43
1.03% |
$42.54
|
500,364
248.94% of 50 DAV
50 DAV is 201,000
|
$42.66
-1.55%
|
7/19/2016
|
$26.64
|
PP = $26.41
|
|
MB = $27.73
|
Most Recent Note - 2/27/2017 5:32:30 PM
G - Still holding its ground stubbornly and perched at all-time highs. Recently reported earnings +8% on +20% sales revenues for the Dec '16 quarter, below the +25% minimum guideline (C criteria), raising fundamental concerns. Its 50 DMA line ($38.92) defines important near-term support where a subsequent violation would trigger a technical sell signal.
>>> FEATURED STOCK ARTICLE : Perched Near All-Time High After Concerns Raised by Latest Earnings - 2/22/2017 |
View all notes |
Set NEW NOTE alert |
Company Profile |
SEC
News |
Chart |
Request a new note
C
A
S
I |
INGN
-
NASDAQ
Inogen Inc
HEALTH SERVICES - Medical Instruments and Supplies
|
$73.80
|
+5.18
7.55% |
$79.94
|
653,160
502.43% of 50 DAV
50 DAV is 130,000
|
$70.50
4.69%
|
2/27/2017
|
$68.69
|
PP = $69.94
|
|
MB = $73.44
|
Most Recent Note - 3/1/2017 12:35:01 PM
Y - Gapped up and hit new all-time highs today after reporting earnings +32% on +26% sales revenues for the Dec '16 quarter. Disciplined investors avoid chasing stocks more than +5% above the pivot point. INGN was highlighted in yellow with pivot point cited based on its 2/21/17 high in the 2 prior mid-day reports (read here) and noted -"Perched near all-time highs after a saucer-with-handle base. Subsequent volume-driven gains for new highs coupled with strong earnings may clinch a technical buy signal. Reported earnings +23% on +33% sales revenues for the Sep '16 quarter, slightly below the +25% minimum guideline. Due to report Dec '16 earnings news on 2/28/17, and volume and volatility often increase near earnings news. Rebounded and made gradual progress since dropped from the Featured Stocks list on 10/27/16." See the latest FSU analysis for more details and an annotated graph.
>>> FEATURED STOCK ARTICLE : Formed Orderly Base With Earnings News Due After Tuesday's Close - 2/27/2017 |
View all notes |
Set NEW NOTE alert |
Company Profile |
SEC
News |
Chart |
Request a new note
C
A
S
I |
PLAY
-
NASDAQ
Dave & Buster's Ent Inc
Retail-Restaurants
|
$57.74
|
+0.55
0.96% |
$58.25
|
629,051
112.73% of 50 DAV
50 DAV is 558,000
|
$59.63
-3.17%
|
2/23/2017
|
$55.41
|
PP = $58.35
|
|
MB = $61.27
|
Most Recent Note - 3/1/2017 5:44:04 PM
Y - Found support again near its 50 DMA line ($55.80). It was highlighted in yellow with pivot point cited based on its 1/04/17 high plus 10 cents in the 2/23/17 mid-day report (read here) and it was noted - "Subsequent gains for new highs with above average volume may trigger a convincing technical buy signal. Recently wedged to new highs with gains lacking great volume. Found support near its 50 DMA line while consolidating since a big 'breakaway gap' on 12/07/16 after reporting better than expected earnings +108% on +19% sales revenues for the Oct '16 quarter. Following its $16 IPO on 10/10/14 it completed Secondary Offerings on 2/05/15, 5/27/15, and 10/01/15. "
>>> FEATURED STOCK ARTICLE : Consolidating Near 50 DMA After Recent Gains Lacked Volume - 2/23/2017 |
View all notes |
Set NEW NOTE alert |
Company Profile |
SEC
News |
Chart |
Request a new note
C
A
S
I |
LITE
-
NASDAQ
Lumentum Holdings Inc
TELECOMMUNICATIONS - Cables / Satalite Equipment
|
$47.90
|
+2.00
4.36% |
$48.31
|
1,612,826
127.70% of 50 DAV
50 DAV is 1,263,000
|
$53.70
-10.79%
|
2/8/2017
|
$44.60
|
PP = $44.80
|
|
MB = $47.04
|
Most Recent Note - 3/1/2017 5:39:54 PM
G - Color code is changed to green after rising back above its "max buy" level. Recent lows tested the prior highs in the $44-45 area noted as important support to watch.
>>> FEATURED STOCK ARTICLE : Gap Up Gain and Strong Finish Triggered Technical Buy Signal - 2/8/2017 |
View all notes |
Set NEW NOTE alert |
Company Profile |
SEC
News |
Chart |
Request a new note
C
A
S
I |
Symbol/Exchange
Company Name
Industry Group |
PRICE |
CHANGE
(%Change) |
Day High |
Volume
(% DAV)
(% 50 day avg vol) |
52 Wk Hi
% From Hi |
Featured
Date |
Price
Featured |
Pivot Featured |
|
Max Buy |
LCII
-
NYSE
L C I Industries
MATERIALS and CONSTRUCTION - General Building Materials
|
$112.30
|
+4.60
4.27% |
$112.55
|
193,560
119.48% of 50 DAV
50 DAV is 162,000
|
$117.15
-4.14%
|
11/29/2016
|
$106.29
|
PP = $101.00
|
|
MB = $106.05
|
Most Recent Note - 2/28/2017 4:52:17 PM
G - Slumped below its 50 DMA line ($110) and closed near the session low. Further deterioration below recent low ($104.10 on 2/14/17) may trigger a more worrisome technical sell signal. Fundamentals through Dec '16 remain strong.
>>> FEATURED STOCK ARTICLE : Distributional Action While Retreating From Highs - 1/30/2017 |
View all notes |
Set NEW NOTE alert |
Company Profile |
SEC
News |
Chart |
Request a new note
C
A
S
I |