You are not logged in.
This means you
CAN ONLY VIEW reports that were published prior to Saturday, March 29, 2025.
You
MUST UPGRADE YOUR MEMBERSHIP if you want to see any current reports.
AFTER MARKET UPDATE - WEDNESDAY, JANUARY 25TH, 2017
Previous After Market Report Next After Market Report >>>
|
|
|
|
DOW |
+155.80 |
20,068.51 |
+0.78% |
|
Volume |
1,023,041,070 |
+2% |
|
Volume |
1,758,244,390 |
+7% |
|
NASDAQ |
+55.38 |
5,656.34 |
+0.99% |
|
Advancers |
1,908 |
65% |
|
Advancers |
2,186 |
72% |
|
S&P 500 |
+18.30 |
2,298.37 |
+0.80% |
|
Decliners |
1,044 |
35% |
|
Decliners |
838 |
28% |
|
Russell 2000 |
+13.23 |
1,382.44 |
+0.97% |
|
52 Wk Highs |
329 |
|
|
52 Wk Highs |
282 |
|
|
S&P 600 |
+8.77 |
846.78 |
+1.05% |
|
52 Wk Lows |
9 |
|
|
52 Wk Lows |
20 |
|
|
 |
Dow Clears 20,000 Threshold as Indices Post Solid Gains
Kenneth J. Gruneisen - Passed the CAN SLIM® Master's Exam
Stocks finished higher on Wednesday. The Dow was up 155 points to 20068. The S&P 500 added 18 points to 2298 and the Nasdaq Composite gained 55 points to 5656. Volume totals were higher than the prior session totals on the NYSE and on the Nasdaq exchange, a sign of increasing institutional buying demand. Breadth was solidly positive as advancers led decliners by nearly a 2-1 margin on the NYSE and by 11-4 on the Nasdaq exchange. Leadership expanded as there were 80 high-ranked companies from the Leaders List that made new 52-week highs and were listed on the BreakOuts Page, versus the total of 38 on the prior session. New 52-week highs totals expanded and solidly outnumbered new 52-week lows on both the NYSE and the Nasdaq exchange.
PICTURED: The Dow Jones Industrial Average rallied above the 20,000 level for a new record high. Its 50-day moving average (DMA) line and recent lows define near-term support to watch on pullbacks.
A solid expansion in leadership was behind the major averages' (M criteria) latest gains and the market is in a confirmed uptrend. New buying efforts should only be made in candidates with superior fundamental and technical characteristics. The Featured Stocks Page lists noteworthy high-ranked leaders.
The Dow Jones Industrial Average climbed above 20,000 for the first time as the post-election rally resumed amid strong corporate earnings. On Wednesday, the blue-chips index surged more than 100 points to reach the milestone mark as President Donald Trump signed a series of executive orders. On the data front, MBA mortgage applications rose 4% last week, after increasing 0.8% in the previous week. Separately, an FHFA report showed that home prices rose 0.5% in November, above expectations.
Eight of 11 sectors in the S&P 500 ended in positive territory. Financials paced the gains with Progressive Corp. (PGR +3.17%) rising. Industrials shares outperformed with Rockwell Automation (ROK +7.73%) solidly higher. Boeing (BA +4.24%) rose after reporting better-than-expected quarterly revenue. In Tech, Seagate Technology (STX +13.97%) rallied as quarterly profit widely beat Street forecasts. Logitech (LOGI +13.15%) rose after posting record retail revenue with strength in its gaming segment. On the M&A front, Textron (TXT -5.37%) fell as the aircraft maker agreed to acquire Arctic Cat (ACAT +41.71%) for $247 million.
Treasuries finished lower with the benchmark 10-year note down 14/32 to yield 2.51%. In commodities, NYMEX WTI crude lost 0.5% to $52.91/barrel. COMEX gold fell 0.9% to $1199.50/ounce. |
 Kenneth J. Gruneisen started out as a licensed stockbroker in August 1987, a couple of months prior to the historic stock market crash that took the Dow Jones Industrial Average down -22.6% in a single day. He has published daily fact-based fundamental and technical analysis on high-ranked stocks online for two decades. Through FACTBASEDINVESTING.COM, Kenneth provides educational articles, news, market commentary, and other information regarding proven investment systems that work in good times and bad.
Comments contained in the body of this report are technical opinions only and are not necessarily those of Gruneisen Growth Corp. The material herein has been obtained from sources believed to be reliable and accurate, however, its accuracy and completeness cannot be guaranteed. Our firm, employees, and customers may effect transactions, including transactions contrary to any recommendation herein, or have positions in the securities mentioned herein or options with respect thereto. Any recommendation contained in this report may not be suitable for all investors and it is not to be deemed an offer or solicitation on our part with respect to the purchase or sale of any securities. |
|
 |
Tech, Financial, Retail, and Energy-Linked Groups Rose
Kenneth J. Gruneisen - Passed the CAN SLIM® Master's Exam
The Retail Index ($RLX +0.58%) edged higher and the Broker/Dealer Index ($XBD +1.50%) and Bank Index ($BKX +1.62%) both gave a solid boost to the major indices on Wednesday. The tech sector had a positive bias as the Semiconductor Index ($SOX +1.45%), Networking Index ($NWX +1.05%), and the Biotechnology Index ($BTK +0.97%) posted unanimous gains. The Gold & Silver Index ($XAU -1.69%) was a standout decliner while the Oil Services Index ($OSX +1.71%) ended solidly higher. Charts courtesy www.stockcharts.com
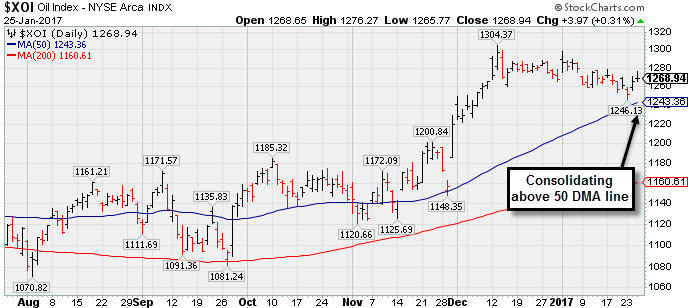 PICTURED: The Integrated Oil Index ($XOI +0.31%) is consolidating above its 50-day moving average (DMA) line.
| Oil Services |
$OSX |
191.34 |
+3.21 |
+1.71% |
+4.11% |
| Integrated Oil |
$XOI |
1,268.94 |
+3.97 |
+0.31% |
+0.08% |
| Semiconductor |
$SOX |
956.06 |
+13.65 |
+1.45% |
+5.47% |
| Networking |
$NWX |
453.29 |
+4.72 |
+1.05% |
+1.61% |
| Broker/Dealer |
$XBD |
217.11 |
+3.20 |
+1.50% |
+5.76% |
| Retail |
$RLX |
1,401.12 |
+8.10 |
+0.58% |
+4.33% |
| Gold & Silver |
$XAU |
90.36 |
-1.55 |
-1.69% |
+14.58% |
| Bank |
$BKX |
92.96 |
+1.49 |
+1.63% |
+1.27% |
| Biotech |
$BTK |
3,165.42 |
+30.27 |
+0.97% |
+2.94% |
|
|
|
 |
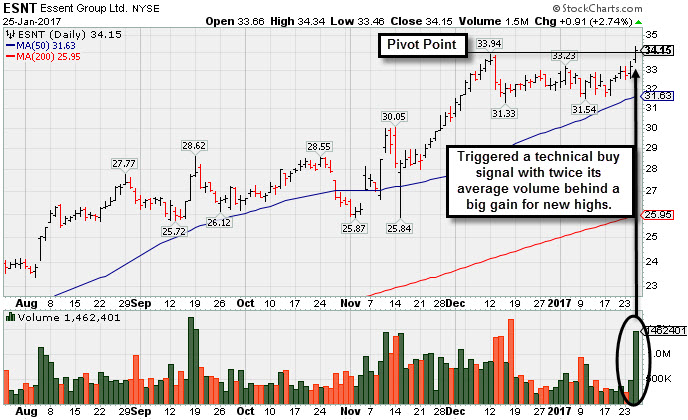
Twice Average Volume Behind Big Breakout Gain
Kenneth J. Gruneisen - Passed the CAN SLIM® Master's Exam
Essent Group Ltd (ESNT +$0.91 or +2.74% to $34.15) finished strong after highlighted in yellow with new pivot point cited based on its 12/12/16 high plus 10 cents in the earlier mid-day report (read here). It hit a new all-time high (N criteria) with today's big gain backed by twice its average volume, well above the minimum of +40% above average volume needed to trigger a proper technical buy signal. It recently found support above its 50-day moving average (DMA) line during its orderly consolidation. Disciplined investors avoid chasing stocks more than +5% above prior highs and always limit losses by selling any stock that falls more than -7% from their purchase price.
The high-ranked Finance-Mrtg and Rel Svc firm's quarterly earnings have been above the +25% minimum guideline (C criteria) and sales revenues increases in comparisons through Sep '16 have been strong. Its annual earnings (A criteria) history has been good since its $17 IPO on 10/31/13. It completed a new Public Offering on 11/19/14.
The number of top-ranted funds owning its shares rose from 317 in Mar '16 to 366 in Dec '16, a reassuring sign concerning the I criteria. Its current Up/Down Volume Ratio of 1.3 is an unbiased indication its shares have been under slight accumulation over the past 50 days.
|
|
|
Color Codes Explained :
Y - Better candidates highlighted by our
staff of experts.
G - Previously featured
in past reports as yellow but may no longer be buyable under the
guidelines.
***Last / Change / Volume data in this table is the closing quote data***
Symbol/Exchange
Company Name
Industry Group |
PRICE |
CHANGE
(%Change) |
Day High |
Volume
(% DAV)
(% 50 day avg vol) |
52 Wk Hi
% From Hi |
Featured
Date |
Price
Featured |
Pivot Featured |
|
Max Buy |
THO
-
NYSE
Thor Industries Inc
AUTOMOTIVE - Recreational Vehicles
|
$105.26
|
+3.85
3.80% |
$105.55
|
812,554
111.00% of 50 DAV
50 DAV is 732,000
|
$108.45
-2.94%
|
1/24/2017
|
$100.52
|
PP = $108.45
|
|
MB = $113.87
|
 Most Recent Note - 1/25/2017 5:21:48 PM
Y - Posted a 2nd consecutive big gain with near average volume today while rallying from support at its 50 DMA line ($99). It was highlighted in yellow in the 1/24/17 mid-day report as a new pivot point was cited based on its 12/07/16 high plus 10 cents (read here) . Subsequent volume-driven gains for new highs are needed to trigger a technical buy signal. Reported earnings +54% on +66% sales revenues for the Oct '16 quarter. Three of the past 4 quarters were above the +25% minimum earnings guideline (C criteria) of the fact-based investment system. See the latest FSU analysis for more details and an annotated graph.
>>> FEATURED STOCK ARTICLE : Rose From Support at 50-Day Moving Average Line - 1/24/2017 |
View all notes |
Set NEW NOTE alert |
Company Profile |
SEC
News |
Chart |
Request a new note
C
A
S
I |
CSFL
-
NASDAQ
Centerstate Banks Inc
Banks-Southeast
|
$25.20
|
-0.23
-0.90% |
$25.79
|
464,818
150.91% of 50 DAV
50 DAV is 308,000
|
$25.83
-2.45%
|
10/10/2016
|
$18.20
|
PP = $18.37
|
|
MB = $19.29
|
Most Recent Note - 1/24/2017 5:40:43 PM
G - Challenged prior highs with today's 3rd consecutive gain. Completed a new Public Offering of shares on 1/10/17 during its orderly consolidation perched near all-time highs. Its 50 DMA line ($24) defines near-term support along with recent lows.
>>> FEATURED STOCK ARTICLE : Bank Stock Perched Near Record Highs After Considerable Rally - 1/4/2017 |
View all notes |
Set NEW NOTE alert |
Company Profile |
SEC
News |
Chart |
Request a new note
C
A
S
I |
IESC
-
NASDAQ
I E S Holdings Inc
Bldg-Maintenance and Svc
|
$20.65
|
+0.70
3.51% |
$20.80
|
56,302
63.26% of 50 DAV
50 DAV is 89,000
|
$23.00
-10.22%
|
11/23/2016
|
$19.35
|
PP = $18.26
|
|
MB = $19.17
|
Most Recent Note - 1/25/2017 5:17:55 PM
G - Gapped up for a 2nd consecutive session today and posted a 6th consecutive gain backed by below average volume. Recently found support near prior highs in the $18 area.
>>> FEATURED STOCK ARTICLE : Violated 50-Day Moving Average Line and Now Testing Prior Highs - 1/19/2017 |
View all notes |
Set NEW NOTE alert |
Company Profile |
SEC
News |
Chart |
Request a new note
C
A
S
I |
BERY
-
NYSE
Berry Plastics Group Inc
CONSUMER NON-DURABLES - Packaging and Containers
|
$52.04
|
-0.34
-0.65% |
$52.97
|
1,233,571
95.70% of 50 DAV
50 DAV is 1,289,000
|
$52.51
-0.90%
|
11/30/2016
|
$50.26
|
PP = $46.47
|
|
MB = $48.79
|
Most Recent Note - 1/24/2017 5:46:36 PM
G - Posted another gain with below average volume today for its best-ever close. Insider buying reported in recent weeks is a reassuring sign. Its 50 DMA line ($49.22) defines support to watch above recent lows in the $48.50 area.
>>> FEATURED STOCK ARTICLE : Orderly Consolidation Continues Well Above Support - 1/3/2017 |
View all notes |
Set NEW NOTE alert |
Company Profile |
SEC
News |
Chart |
Request a new note
C
A
S
I |
EVR
-
NYSE
Evercore Partners Inc
FINANCIAL SERVICES - Investment Banking
|
$76.55
|
+1.25
1.66% |
$76.80
|
376,574
85.59% of 50 DAV
50 DAV is 440,000
|
$75.73
1.09%
|
1/5/2017
|
$71.40
|
PP = $72.07
|
|
MB = $75.67
|
Most Recent Note - 1/23/2017 5:48:01 PM
Y - Wedged higher with today's gain lacking great volume conviction. Its 50 DMA line ($68.95) defines support above prior highs. Concerns remain because volume behind all gains has been light since a new pivot point was cited based on its 12/08/16 high plus 10 cents - "Gains above a pivot point must have a minimum of +40% above average volume to trigger a proper new (or add-on) technical buy signal.)
>>> FEATURED STOCK ARTICLE : Perched Near All-Time High Building New Flat Base - 1/5/2017 |
View all notes |
Set NEW NOTE alert |
Company Profile |
SEC
News |
Chart |
Request a new note
C
A
S
I |
Symbol/Exchange
Company Name
Industry Group |
PRICE |
CHANGE
(%Change) |
Day High |
Volume
(% DAV)
(% 50 day avg vol) |
52 Wk Hi
% From Hi |
Featured
Date |
Price
Featured |
Pivot Featured |
|
Max Buy |
HTHT
-
NASDAQ
China Lodging Group Ads
LEISURE - Lodging
|
$53.29
|
+1.73
3.36% |
$53.35
|
163,075
94.81% of 50 DAV
50 DAV is 172,000
|
$54.23
-1.73%
|
9/29/2016
|
$46.12
|
PP = $47.82
|
|
MB = $50.21
|
Most Recent Note - 1/24/2017 5:47:59 PM
G - Still quietly consolidating above support at its 50 DMA line ($49.24) with volume totals cooling. The prior low ($45.61 on 12/20/16) defines the next important near-term support level. Repeatedly noted with caution in prior reports - "Reported earnings +10% on +6% sales revenues for the Sep '16 quarter, below the +25% minimum earnings guideline (C criteria), raising concerns."
>>> FEATURED STOCK ARTICLE : Slump Below "Max Buy" Level But Fundamental Concerns Were Raised - 1/6/2017 |
View all notes |
Set NEW NOTE alert |
Company Profile |
SEC
News |
Chart |
Request a new note
C
A
S
I |
DW
-
NYSE
LCI Industries
MATERIALS and CONSTRUCTION - General Building Materials
|
$115.30
|
+3.50
3.13% |
$115.35
|
132,450
70.34% of 50 DAV
50 DAV is 188,300
|
$116.50
-1.03%
|
11/29/2016
|
$106.29
|
PP = $101.00
|
|
MB = $106.05
|
Most Recent Note - 1/23/2017 5:43:17 PM
G - Found support at its 50 DMA line ($106.10) and posted a gain today with average volume. Prior highs in the $103 area define the next important support level below its 50 DMA line. Subsequent violations may trigger technical sell signals. Drew Industries (DW) announced a new name LCI Industries (LCII) and new trading symbol effective as of the market open on January 3, 2017.
>>> FEATURED STOCK ARTICLE : Consolidating Well Above Prior Highs and 50-Day Moving Average - 12/30/2016 |
View all notes |
Set NEW NOTE alert |
Company Profile |
SEC
News |
Chart |
Request a new note
C
A
S
I |
LMAT
-
NASDAQ
Lemaitre Vascular Inc
Medical-Products
|
$23.43
|
+0.11
0.47% |
$23.88
|
105,188
77.34% of 50 DAV
50 DAV is 136,000
|
$27.04
-13.34%
|
12/22/2016
|
$24.99
|
PP = $25.09
|
|
MB = $26.34
|
Most Recent Note - 1/19/2017 5:41:08 PM
G - Slumped below its 50 DMA line with a 6th consecutive loss today raising concerns and triggering a technical sell signal. Color code is changed to green. Only a prompt rebound above its 50 DMA line ($23.93) would help its outlook improve.
>>> FEATURED STOCK ARTICLE : Built an Orderly Base-On-Base Pattern - 12/23/2016 |
View all notes |
Set NEW NOTE alert |
Company Profile |
SEC
News |
Chart |
Request a new note
C
A
S
I |
BEAT
-
NASDAQ
BioTelemetry Inc
Medical-Services
|
$22.60
|
+0.35
1.57% |
$23.05
|
268,622
94.59% of 50 DAV
50 DAV is 284,000
|
$24.10
-6.22%
|
12/19/2016
|
$22.91
|
PP = $21.78
|
|
MB = $22.87
|
Most Recent Note - 1/20/2017 5:25:33 PM
Y - Quietly consolidating near prior highs in the $21-22 area which define initial support to watch above its 50 DMA line ($20.84). More damaging losses leading to violations may trigger technical sell signals.
>>> FEATURED STOCK ARTICLE : Volume Totals Cooling While Consolidating Above Prior Highs - 1/10/2017 |
View all notes |
Set NEW NOTE alert |
Company Profile |
SEC
News |
Chart |
Request a new note
C
A
S
I |
PATK
-
NASDAQ
Patrick Industries Inc
WHOLESALE - Building Materials Wholesale
|
$82.90
|
+2.10
2.60% |
$83.03
|
88,705
72.12% of 50 DAV
50 DAV is 123,000
|
$81.65
1.53%
|
11/29/2016
|
$72.45
|
PP = $69.63
|
|
MB = $73.11
|
Most Recent Note - 1/19/2017 5:38:37 PM
G - Pulling back from all-time highs after getting extended from its prior base. Prior highs in the $69 area and its 50 DMA line ($72.60) define support to watch on pullbacks.
>>> FEATURED STOCK ARTICLE : Stubbornly Held Ground and Rose Since Featured Again - 12/28/2016 |
View all notes |
Set NEW NOTE alert |
Company Profile |
SEC
News |
Chart |
Request a new note
C
A
S
I |
Symbol/Exchange
Company Name
Industry Group |
PRICE |
CHANGE
(%Change) |
Day High |
Volume
(% DAV)
(% 50 day avg vol) |
52 Wk Hi
% From Hi |
Featured
Date |
Price
Featured |
Pivot Featured |
|
Max Buy |
ESNT
-
NYSE
Essent Group Ltd
Finance-MrtgandRel Svc
|
$34.15
|
+0.91
2.74% |
$34.34
|
1,462,601
207.17% of 50 DAV
50 DAV is 706,000
|
$33.94
0.62%
|
1/25/2017
|
$34.09
|
PP = $34.04
|
|
MB = $35.74
|
Most Recent Note - 1/25/2017 5:15:22 PM
Y - Finished strong after highlighted in yellow with new pivot point cited based on its 12/12/16 high plus 10 cents. Hit new all-time highs with +107% above average volume triggering a technical buy signal. Found support above its 50 DMA line during its orderly consolidation. Quarterly earnings and sales revenues increases in comparisons through Sep '16 have been strong, Annual earnings (A criteria) history has been good since its $17 IPO on 10/31/13. Completed a new Public Offering on 11/19/14. See the latest FSU analysis for more details and a new annotated graph.
>>> FEATURED STOCK ARTICLE : Twice Average Volume Behind Big Breakout Gain - 1/25/2017 |
View all notes |
Set NEW NOTE alert |
Company Profile |
SEC
News |
Chart |
Request a new note
C
A
S
I |
ANET
-
NYSE
Arista Networks Inc
TELECOMMUNICATIONS - Communication Equipment
|
$93.08
|
+0.61
0.66% |
$94.75
|
497,208
60.93% of 50 DAV
50 DAV is 816,000
|
$103.00
-9.63%
|
12/30/2016
|
$96.77
|
PP = $99.00
|
|
MB = $103.95
|
Most Recent Note - 1/24/2017 5:43:57 PM
G - Rose today yet remains below its 50 DMA line after a damaging gap down on 1/17/17 triggering a technical sell signal. A rebound above its 50 DMA line ($94.67) is needed for its outlook to improve.
>>> FEATURED STOCK ARTICLE : Technical Damages Raised Concern and Triggered Technical Sell Signal - 1/18/2017 |
View all notes |
Set NEW NOTE alert |
Company Profile |
SEC
News |
Chart |
Request a new note
C
A
S
I |
VBTX
-
NASDAQ
Veritex Holdings Inc
BANKING - Regional - Southwest Banks
|
$28.27
|
+0.87
3.18% |
$28.43
|
102,376
138.35% of 50 DAV
50 DAV is 74,000
|
$27.77
1.82%
|
1/23/2017
|
$27.30
|
PP = $27.87
|
|
MB = $29.26
|
Most Recent Note - 1/25/2017 5:24:15 PM
Y - Today's 6th consecutive gain was backed by +38% above average volume as it rallied for a new all-time high after a short flat base. Members were previously reminded - "A gain above the pivot point backed by at least +40% above average volume is needed to trigger a proper technical buy signal. Reported Dec '16 quarterly earnings +17% on +26% sales revenues, below the +25% minimum guideline (C criteria) for buy candidates, raising fundamental concerns. Completed a new Public Offering on 12/15/16 See the latest FSU analysis for more details and an annotated graph."
>>> FEATURED STOCK ARTICLE : Challenged Highs But Ended in Bottom Third of Intra-day Range - 1/23/2017 |
View all notes |
Set NEW NOTE alert |
Company Profile |
SEC
News |
Chart |
Request a new note
C
A
S
I |
SFBS
-
NASDAQ
Servisfirst Bancshares
BANKING - Regional - Southeast Banks
|
$38.87
|
+0.67
1.75% |
$38.98
|
121,905
42.18% of 50 DAV
50 DAV is 289,000
|
$38.65
0.57%
|
7/19/2016
|
$26.64
|
PP = $26.41
|
|
MB = $27.73
|
Most Recent Note - 1/24/2017 5:49:12 PM
G - Posted a gain on light volume today challenging prior highs. Recent low and its 50 DMA line define important near-term support in the $35-36 area where subsequent violations would raise concerns.
>>> FEATURED STOCK ARTICLE : Stubbornly Holding Ground Near Highs - 1/12/2017 |
View all notes |
Set NEW NOTE alert |
Company Profile |
SEC
News |
Chart |
Request a new note
C
A
S
I |
|
|
|
THESE ARE NOT BUY RECOMMENDATIONS!
Comments contained in the body of this report are technical
opinions only. The material herein has been obtained
from sources believed to be reliable and accurate, however,
its accuracy and completeness cannot be guaranteed.
This site is not an investment advisor, hence it does
not endorse or recommend any securities or other investments.
Any recommendation contained in this report may not
be suitable for all investors and it is not to be deemed
an offer or solicitation on our part with respect to
the purchase or sale of any securities. All trademarks,
service marks and trade names appearing in this report
are the property of their respective owners, and are
likewise used for identification purposes only.
This report is a service available
only to active Paid Premium Members.
You may opt-out of receiving report notifications
at any time. Questions or comments may be submitted
by writing to Premium Membership Services 665 S.E. 10 Street, Suite 201 Deerfield Beach, FL 33441-5634 or by calling 1-800-965-8307
or 954-785-1121.
|
|
|