You are not logged in.
This means you
CAN ONLY VIEW reports that were published prior to Saturday, March 29, 2025.
You
MUST UPGRADE YOUR MEMBERSHIP if you want to see any current reports.
AFTER MARKET UPDATE - TUESDAY, JANUARY 31ST, 2017
Previous After Market Report Next After Market Report >>>
|
|
|
|
DOW |
-107.04 |
19,864.09 |
-0.54% |
|
Volume |
1,479,533,740 |
+44% |
|
Volume |
1,852,219,210 |
+15% |
|
NASDAQ |
+1.08 |
5,614.79 |
+0.02% |
|
Advancers |
1,858 |
64% |
|
Advancers |
1,776 |
61% |
|
S&P 500 |
-2.03 |
2,278.87 |
-0.09% |
|
Decliners |
1,058 |
36% |
|
Decliners |
1,125 |
39% |
|
Russell 2000 |
+9.49 |
1,361.82 |
+0.70% |
|
52 Wk Highs |
69 |
|
|
52 Wk Highs |
73 |
|
|
S&P 600 |
+7.06 |
834.20 |
+0.85% |
|
52 Wk Lows |
19 |
|
|
52 Wk Lows |
49 |
|
|
 |
Breadth Was Positive and Leadership Improved Slightly
Kenneth J. Gruneisen - Passed the CAN SLIM® Master's Exam
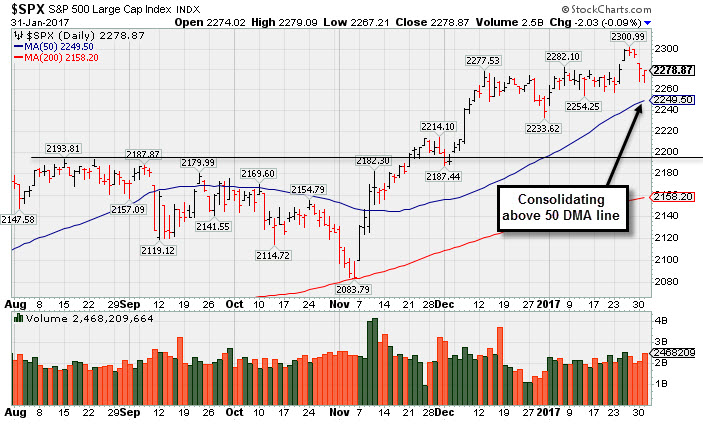
Stocks finished mostly lower on Tuesday. The Dow was down 107 points to 19864. The S&P 500 lost 2 points to 2278 and the Nasdaq Composite added 1 point to 5614. Volume totals were higher than the prior session totals on the NYSE and on the Nasdaq exchange. Breadth was positive as advancers led decliners by a 9-5 margin on the NYSE and by a 3-2 margin on the Nasdaq exchange. There were 18 high-ranked companies from the Leaders List that made new 52-week highs and were listed on the BreakOuts Page, versus the total of 9 on the prior session. New 52-week highs totals improved and still outnumbered new 52-week lows on both the NYSE and the Nasdaq exchange.
PICTURED: The S&P 500 Index is consolidating well above its 50-day moving average (DMA) line and recent lows defining near-term support to watch on pullbacks.
An evaporation of leadership has raised concerns while the major averages' (M criteria) confirmed uptrend has encountered more damaging distributional pressure. New buying efforts should only be made in candidates with superior fundamental and technical characteristics. The Featured Stocks Page lists noteworthy high-ranked leaders.
The S&P 500 declined for a fourth-straight session Tuesday as investors continued to weigh the latest policies from President Donald Trump. On the data front, the Case-Shiller Index showed U.S. home prices increased 5.6% year-over-year in November. In a separate release, consumer confidence fell to 111.8 in January, below expectations. Finally, manufacturing activity in the Chicago Fed region slowed this month.
Six of 11 sectors in the S&P 500 ended in negative territory. Industrials shares led the losses with United Parcel Service (UPS -6.75%) falling as the logistics giant posted weaker-than-expected quarterly results. Technology stocks finished lower with MasterCard (MA -2.72%) fell. Apple (AAPL -0.23%) edged lower ahead of its scheduled release after the closing bell. In the consumer space, Under Armour (UA -23.40%) tumbled as the apparel maker’s sales forecast missed estimates by a wide margin. Health Care shares outperformed as Eli Lilly (LLY +3.12%) rose. AmerisouceBergen (ABc+4.38%) rose after the company raised its forward revenue guidance for fiscal year 2017.
Treasuries finished higher with the benchmark 10-year note up 10/32 to yield 2.44%. In commodities, NYMEX WTI crude added 0.4% to $52.84/barrel. COMEX gold gained 1.4% to $1210.30/ounce. In FOREX, the Dollar Index retreated 0.8%. |
 Kenneth J. Gruneisen started out as a licensed stockbroker in August 1987, a couple of months prior to the historic stock market crash that took the Dow Jones Industrial Average down -22.6% in a single day. He has published daily fact-based fundamental and technical analysis on high-ranked stocks online for two decades. Through FACTBASEDINVESTING.COM, Kenneth provides educational articles, news, market commentary, and other information regarding proven investment systems that work in good times and bad.
Comments contained in the body of this report are technical opinions only and are not necessarily those of Gruneisen Growth Corp. The material herein has been obtained from sources believed to be reliable and accurate, however, its accuracy and completeness cannot be guaranteed. Our firm, employees, and customers may effect transactions, including transactions contrary to any recommendation herein, or have positions in the securities mentioned herein or options with respect thereto. Any recommendation contained in this report may not be suitable for all investors and it is not to be deemed an offer or solicitation on our part with respect to the purchase or sale of any securities. |
|
 |
Gold & Silver, Biotech, Networking, and Oil Services Indexes Rose
Kenneth J. Gruneisen - Passed the CAN SLIM® Master's Exam
The Retail Index ($RLX -0.28%) edged lower while the Broker/Dealer Index ($XBD -0.23%) and Bank Index ($BKX -0.63%) both posted small losses on Tuesday. The tech sector was mixed as the Semiconductor Index ($SOX -1.31%) fell yet the Networking Index ($NWX +0.54%) posted a small gain and the Biotechnology Index ($BTK +3.72%) posted a standout gain. Commodity-linked groups were led by the Gold & Silver Index ($XAU +3.07%) while the Oil Services Index ($OSX +0.85%) posted a smaller gain and the Integrated Oil Index ($XOI +0.00%) finished flat. Charts courtesy www.stockcharts.com
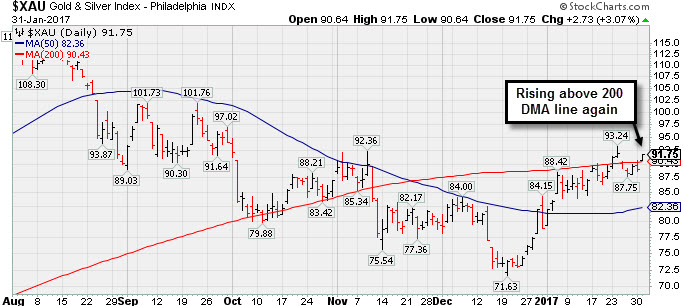 PICTURED: The Gold & Silver Index ($XAU +3.07%) is rising above its 200-day moving average (DMA) line again.
| Oil Services |
$OSX |
180.24 |
+1.52 |
+0.85% |
-1.93% |
| Integrated Oil |
$XOI |
1,232.99 |
-0.02 |
-0.00% |
-2.76% |
| Semiconductor |
$SOX |
944.28 |
-12.56 |
-1.31% |
+4.17% |
| Networking |
$NWX |
451.33 |
+2.44 |
+0.54% |
+1.17% |
| Broker/Dealer |
$XBD |
215.08 |
-0.50 |
-0.23% |
+4.77% |
| Retail |
$RLX |
1,390.92 |
-3.88 |
-0.28% |
+3.57% |
| Gold & Silver |
$XAU |
91.76 |
+2.74 |
+3.08% |
+16.36% |
| Bank |
$BKX |
91.41 |
-0.58 |
-0.63% |
-0.41% |
| Biotech |
$BTK |
3,250.57 |
+116.54 |
+3.72% |
+5.71% |
|
|
|
 |
Perched Near All-Time High Extended From Prior Base
Kenneth J. Gruneisen - Passed the CAN SLIM® Master's Exam
Patrick Industries Inc (PATK +$0.20 or +0.25% to $81.75) remains perched near all-time highs, extended from its prior base. its 50-day moving average (DMA) line ($75.94) defines support to watch on pullbacks. Prior highs in the $69 area define the next support below that important short-term moving average. Subsequent violations would raise concerns and trigger technical sell signals.
PATK currently has A Timeliness Rating of A and a Sponsorship Ratinbg of B. It has made gradual progress since last shown in this FSU section on 12/28/16 with an annotated graph under the headline, "Stubbornly Held Ground and Rose Since Featured Again". It was highlighted in yellow with new pivot point cited based on its 7/28/16 high plus 10 cents in the 11/29/16 mid-day report (read here). The convincing gain for new highs was backed by +106% above average volume triggering a new (or add-on) technical buy signal.
It reported Sep '16 quarterly earnings +36% on +42% sales revenues,continuing its streak of quarterly comparisons steadily above the +25% minimum earnings guideline (C criteria). A small downturn in FY '13 was a flaw previously noted in its annual earnings (A criteria) history.
Its current Up/Down Volume ratio of 1.8 is an unbiased indication that its shares were under accumulation over the past 50 days. The number of top-rated funds owning its share rose from 218 in Jun '15 to 315 in Sep '16, a reassuring trend concerning the I criteria. Its small supply of 14.3 million shares (S criteria) in the public float can contribute to greater price volatility in the event of institutional buying or selling. |
|
|
Color Codes Explained :
Y - Better candidates highlighted by our
staff of experts.
G - Previously featured
in past reports as yellow but may no longer be buyable under the
guidelines.
***Last / Change / Volume data in this table is the closing quote data***
Symbol/Exchange
Company Name
Industry Group |
PRICE |
CHANGE
(%Change) |
Day High |
Volume
(% DAV)
(% 50 day avg vol) |
52 Wk Hi
% From Hi |
Featured
Date |
Price
Featured |
Pivot Featured |
|
Max Buy |
THO
-
NYSE
Thor Industries Inc
AUTOMOTIVE - Recreational Vehicles
|
$103.50
|
-0.74
-0.71% |
$104.30
|
504,463
70.55% of 50 DAV
50 DAV is 715,000
|
$108.45
-4.56%
|
1/24/2017
|
$100.52
|
PP = $108.45
|
|
MB = $113.87
|
Most Recent Note - 1/30/2017 1:24:56 PM
Y - Rallied recently from support at its 50 DMA line ($100.43). It was highlighted in yellow in the 1/24/17 mid-day report as a new pivot point was cited based on its 12/07/16 high plus 10 cents (read here). Subsequent volume-driven gains for new highs are still needed to trigger a proper technical buy signal.
>>> FEATURED STOCK ARTICLE : Rose From Support at 50-Day Moving Average Line - 1/24/2017 |
View all notes |
Set NEW NOTE alert |
Company Profile |
SEC
News |
Chart |
Request a new note
C
A
S
I |
CSFL
-
NASDAQ
Centerstate Banks Inc
Banks-Southeast
|
$24.39
|
-0.15
-0.61% |
$24.84
|
410,606
137.79% of 50 DAV
50 DAV is 298,000
|
$26.30
-7.26%
|
10/10/2016
|
$18.20
|
PP = $18.37
|
|
MB = $19.29
|
Most Recent Note - 1/27/2017 5:24:44 PM
G - Pulled back today with near average volume after hitting a new high with a volume-driven gain on the prior session. Completed a new Public Offering of shares on 1/10/17 during its orderly consolidation. Its 50 DMA line ($24.28) and recent lows define near-term support to watch.
>>> FEATURED STOCK ARTICLE : Bank Stock Perched Near Record Highs After Considerable Rally - 1/4/2017 |
View all notes |
Set NEW NOTE alert |
Company Profile |
SEC
News |
Chart |
Request a new note
C
A
S
I |
IESC
-
NASDAQ
I E S Holdings Inc
Bldg-Maintenance and Svc
|
$19.50
|
-0.05
-0.26% |
$19.60
|
26,993
32.13% of 50 DAV
50 DAV is 84,000
|
$23.00
-15.22%
|
11/23/2016
|
$19.35
|
PP = $18.26
|
|
MB = $19.17
|
Most Recent Note - 1/30/2017 1:22:26 PM
G - Slumping back below its 50 DMA line raising concerns with below average volume behind today's 3rd consecutive loss. Recently found support near prior highs in the $18 area.
>>> FEATURED STOCK ARTICLE : Violated 50-Day Moving Average Line and Now Testing Prior Highs - 1/19/2017 |
View all notes |
Set NEW NOTE alert |
Company Profile |
SEC
News |
Chart |
Request a new note
C
A
S
I |
BERY
-
NYSE
Berry Plastics Group Inc
CONSUMER NON-DURABLES - Packaging and Containers
|
$51.03
|
+0.32
0.63% |
$51.13
|
1,477,165
113.54% of 50 DAV
50 DAV is 1,301,000
|
$52.97
-3.66%
|
11/30/2016
|
$50.26
|
PP = $46.47
|
|
MB = $48.79
|
Most Recent Note - 1/30/2017 1:29:03 PM
G - Pulling back from all-time highs with today's 4th consecutive loss. Insider buying reported in recent weeks is a reassuring sign. Its 50 DMA line ($49.72) defines support to watch above recent lows in the $48.50 area.
>>> FEATURED STOCK ARTICLE : Orderly Consolidation Continues Well Above Support - 1/3/2017 |
View all notes |
Set NEW NOTE alert |
Company Profile |
SEC
News |
Chart |
Request a new note
C
A
S
I |
EVR
-
NYSE
Evercore Partners Inc
FINANCIAL SERVICES - Investment Banking
|
$77.45
|
+0.55
0.72% |
$77.55
|
651,062
164.41% of 50 DAV
50 DAV is 396,000
|
$77.60
-0.19%
|
1/5/2017
|
$71.40
|
PP = $72.07
|
|
MB = $75.67
|
Most Recent Note - 1/30/2017 12:56:53 PM
Y - Wedged higher with today's gain lacking great volume conviction. Its 50 DMA line ($68.95) defines support above prior highs. Concerns remain because volume behind all gains has been light since a new pivot point was cited based on its 12/08/16 high plus 10 cents - "Gains above a pivot point must have a minimum of +40% above average volume to trigger a proper new (or add-on) technical buy signal.)
>>> FEATURED STOCK ARTICLE : Perched Near All-Time High Building New Flat Base - 1/5/2017 |
View all notes |
Set NEW NOTE alert |
Company Profile |
SEC
News |
Chart |
Request a new note
C
A
S
I |
Symbol/Exchange
Company Name
Industry Group |
PRICE |
CHANGE
(%Change) |
Day High |
Volume
(% DAV)
(% 50 day avg vol) |
52 Wk Hi
% From Hi |
Featured
Date |
Price
Featured |
Pivot Featured |
|
Max Buy |
HTHT
-
NASDAQ
China Lodging Group Ads
LEISURE - Lodging
|
$54.03
|
+0.10
0.19% |
$54.26
|
54,087
32.39% of 50 DAV
50 DAV is 167,000
|
$55.00
-1.76%
|
9/29/2016
|
$46.12
|
PP = $47.82
|
|
MB = $50.21
|
 Most Recent Note - 1/31/2017 5:00:01 PM
G - Hovering in a tight range perched at all-time highs with near-term support at its 50 DMA line ($50). Repeatedly noted with caution in prior reports - "Reported earnings +10% on +6% sales revenues for the Sep '16 quarter, below the +25% minimum earnings guideline (C criteria), raising concerns."
>>> FEATURED STOCK ARTICLE : Slump Below "Max Buy" Level But Fundamental Concerns Were Raised - 1/6/2017 |
View all notes |
Set NEW NOTE alert |
Company Profile |
SEC
News |
Chart |
Request a new note
C
A
S
I |
LMAT
-
NASDAQ
Lemaitre Vascular Inc
Medical-Products
|
$22.71
|
+0.02
0.09% |
$22.98
|
102,448
82.62% of 50 DAV
50 DAV is 124,000
|
$27.04
-16.01%
|
12/22/2016
|
$24.99
|
PP = $25.09
|
|
MB = $26.34
|
Most Recent Note - 1/30/2017 1:26:40 PM
G - Quietly slumping further below its 50 DMA line today. A rebound above its 50 DMA line ($23.97) is needed for its outlook to improve. See the latest FSU analysis for more details and an annotated graph.
>>> FEATURED STOCK ARTICLE : Concerns Increase While Lingering Below 50-Day Moving Average - 1/27/2017 |
View all notes |
Set NEW NOTE alert |
Company Profile |
SEC
News |
Chart |
Request a new note
C
A
S
I |
BEAT
-
NASDAQ
BioTelemetry Inc
Medical-Services
|
$23.05
|
+0.80
3.60% |
$23.15
|
340,333
124.66% of 50 DAV
50 DAV is 273,000
|
$24.10
-4.36%
|
12/19/2016
|
$22.91
|
PP = $21.78
|
|
MB = $22.87
|
Most Recent Note - 1/31/2017 4:55:09 PM
G - Color code is changed to green after rallying above the previously cited "max buy" level. Prior highs in the $21-22 area and its 50 DMA line define important near-term support to watch. Damaging losses leading to violations may trigger technical sell signals.
>>> FEATURED STOCK ARTICLE : Volume Totals Cooling While Consolidating Above Prior Highs - 1/10/2017 |
View all notes |
Set NEW NOTE alert |
Company Profile |
SEC
News |
Chart |
Request a new note
C
A
S
I |
PATK
-
NASDAQ
Patrick Industries Inc
WHOLESALE - Building Materials Wholesale
|
$81.75
|
+0.20
0.25% |
$82.70
|
157,682
129.25% of 50 DAV
50 DAV is 122,000
|
$83.50
-2.10%
|
11/29/2016
|
$72.45
|
PP = $69.63
|
|
MB = $73.11
|
Most Recent Note - 1/31/2017 5:55:29 PM
G - Still perched near all-time highs, extended from its prior base. Its 50 DMA line ($75.94) defines support to watch above prior highs. See the latest FSU analysis for more details and a new annotated graph.
>>> FEATURED STOCK ARTICLE : Perched Near All-Time High Extended From Prior Base - 1/31/2017 |
View all notes |
Set NEW NOTE alert |
Company Profile |
SEC
News |
Chart |
Request a new note
C
A
S
I |
ESNT
-
NYSE
Essent Group Ltd
Finance-MrtgandRel Svc
|
$34.57
|
+0.14
0.41% |
$34.62
|
723,974
106.94% of 50 DAV
50 DAV is 677,000
|
$35.00
-1.23%
|
1/25/2017
|
$34.09
|
PP = $34.04
|
|
MB = $35.74
|
Most Recent Note - 1/30/2017 1:21:05 PM
Y - Touched a new high with today's early gain approaching its "max buy" level. Gain with +107% above average volume on 1/25/17 triggered a technical buy signal. Its 50 DMA line and recent lows define important near-term support to watch.
>>> FEATURED STOCK ARTICLE : Twice Average Volume Behind Big Breakout Gain - 1/25/2017 |
View all notes |
Set NEW NOTE alert |
Company Profile |
SEC
News |
Chart |
Request a new note
C
A
S
I |
Symbol/Exchange
Company Name
Industry Group |
PRICE |
CHANGE
(%Change) |
Day High |
Volume
(% DAV)
(% 50 day avg vol) |
52 Wk Hi
% From Hi |
Featured
Date |
Price
Featured |
Pivot Featured |
|
Max Buy |
ANET
-
NYSE
Arista Networks Inc
TELECOMMUNICATIONS - Communication Equipment
|
$94.00
|
+0.33
0.35% |
$94.20
|
406,933
53.12% of 50 DAV
50 DAV is 766,000
|
$103.00
-8.74%
|
12/30/2016
|
$96.77
|
PP = $99.00
|
|
MB = $103.95
|
Most Recent Note - 1/30/2017 1:16:51 PM
G - Met resistance at its 50 DMA line when rebounding after a damaging gap down on 1/17/17 triggering a technical sell signal. A rebound above its 50 DMA line ($95.18) is needed for its outlook to improve.
>>> FEATURED STOCK ARTICLE : Technical Damages Raised Concern and Triggered Technical Sell Signal - 1/18/2017 |
View all notes |
Set NEW NOTE alert |
Company Profile |
SEC
News |
Chart |
Request a new note
C
A
S
I |
VBTX
-
NASDAQ
Veritex Holdings Inc
BANKING - Regional - Southwest Banks
|
$27.16
|
+0.41
1.53% |
$27.86
|
296,683
380.36% of 50 DAV
50 DAV is 78,000
|
$28.61
-5.07%
|
1/23/2017
|
$27.30
|
PP = $27.87
|
|
MB = $29.26
|
Most Recent Note - 1/31/2017 4:58:37 PM
Y - Consolidating since its 1/25/17 gain with +38% above average volume, failing to follow through or convincingly break out from a short flat base. Members were previously reminded - "A gain above the pivot point backed by at least +40% above average volume is needed to trigger a proper technical buy signal. Reported Dec '16 quarterly earnings +17% on +26% sales revenues, below the +25% minimum guideline (C criteria) for buy candidates, raising fundamental concerns. Completed a new Public Offering on 12/15/16 See the latest FSU analysis for more details and an annotated graph."
>>> FEATURED STOCK ARTICLE : Challenged Highs But Ended in Bottom Third of Intra-day Range - 1/23/2017 |
View all notes |
Set NEW NOTE alert |
Company Profile |
SEC
News |
Chart |
Request a new note
C
A
S
I |
SFBS
-
NASDAQ
Servisfirst Bancshares
BANKING - Regional - Southeast Banks
|
$40.04
|
+1.98
5.20% |
$40.35
|
282,369
106.15% of 50 DAV
50 DAV is 266,000
|
$39.26
1.99%
|
7/19/2016
|
$26.64
|
PP = $26.41
|
|
MB = $27.73
|
Most Recent Note - 1/31/2017 9:59:11 AM
G - Hitting new all-time highs with today's big early gain. Reported earnings +8% on +20% sales revenues for the Dec '16 quarter, below the +25% minimum guideline (C criteria), raising fundamental concerns. Recent low and its 50 DMA line define important near-term support in the $36 area where subsequent violations would trigger technical sell signals.
>>> FEATURED STOCK ARTICLE : Stubbornly Holding Ground Near Highs - 1/12/2017 |
View all notes |
Set NEW NOTE alert |
Company Profile |
SEC
News |
Chart |
Request a new note
C
A
S
I |
LCII
-
NYSE
L C I Industries
MATERIALS and CONSTRUCTION - General Building Materials
|
$109.75
|
-0.25
-0.23% |
$111.70
|
185,716
102.04% of 50 DAV
50 DAV is 182,000
|
$117.15
-6.32%
|
11/29/2016
|
$106.29
|
PP = $101.00
|
|
MB = $106.05
|
Most Recent Note - 1/30/2017 5:44:54 PM
G - Encountering distributional pressure. Subsequent losses violating its 50 DMA line ($108) and prior lows may trigger technical sell signals. Mostly bullish action has followed since Drew Industries (DW) announced a new name LCI Industries (LCII). See the latest FSU analysis for more details and a new annotated graph.
>>> FEATURED STOCK ARTICLE : Distributional Action While Retreating From Highs - 1/30/2017 |
View all notes |
Set NEW NOTE alert |
Company Profile |
SEC
News |
Chart |
Request a new note
C
A
S
I |
|
|
|
THESE ARE NOT BUY RECOMMENDATIONS!
Comments contained in the body of this report are technical
opinions only. The material herein has been obtained
from sources believed to be reliable and accurate, however,
its accuracy and completeness cannot be guaranteed.
This site is not an investment advisor, hence it does
not endorse or recommend any securities or other investments.
Any recommendation contained in this report may not
be suitable for all investors and it is not to be deemed
an offer or solicitation on our part with respect to
the purchase or sale of any securities. All trademarks,
service marks and trade names appearing in this report
are the property of their respective owners, and are
likewise used for identification purposes only.
This report is a service available
only to active Paid Premium Members.
You may opt-out of receiving report notifications
at any time. Questions or comments may be submitted
by writing to Premium Membership Services 665 S.E. 10 Street, Suite 201 Deerfield Beach, FL 33441-5634 or by calling 1-800-965-8307
or 954-785-1121.
|
|
|