***Last / Change / Volume data in this table is the closing quote data***
Symbol/Exchange
Company Name
Industry Group |
PRICE |
CHANGE
(%Change) |
Day High |
Volume
(% DAV)
(% 50 day avg vol) |
52 Wk Hi
% From Hi |
Featured
Date |
Price
Featured |
Pivot Featured |
|
Max Buy |
THO
-
NYSE
Thor Industries Inc
AUTOMOTIVE - Recreational Vehicles
|
$111.29
|
-0.03
-0.03% |
$111.73
|
520,356
96.36% of 50 DAV
50 DAV is 540,000
|
$111.81
-0.47%
|
1/24/2017
|
$100.52
|
PP = $108.45
|
|
MB = $113.87
|
Most Recent Note - 2/13/2017 5:47:38 PM
Y - Perched near record highs, stubbornly holding its ground with volume totals cooling. Gapped up on 2/08/17 and rallied above its pivot point with a gain backed by very near the +40% above average volume needed to trigger a proper technical buy signal.
>>> FEATURED STOCK ARTICLE : Rose From Support at 50-Day Moving Average Line - 1/24/2017 |
View all notes |
Set NEW NOTE alert |
Company Profile |
SEC
News |
Chart |
Request a new note
C
A
S
I |
SBCF
-
NASDAQ
Seacoast Banking Corp Fl
BANKING - Regional - Mid-Atlantic Banks
|
$24.23
|
+0.03
0.12% |
$24.55
|
522,483
183.33% of 50 DAV
50 DAV is 285,000
|
$25.13
-3.58%
|
2/13/2017
|
$24.84
|
PP = $23.10
|
|
MB = $24.26
|
 Most Recent Note - 2/16/2017 12:48:28 PM
Y - Consolidating since its 2/13/17 gap up was highlighted in yellow with pivot point cited based on its 1/04/17 high plus 10 cents. Its solid volume-driven gain clinched a technical buy signal. Completed a new Public Offering on 2/15/17. Prior highs in the $23 area define initial support to watch. See the latest FSU analysis for more details and an annotated graph.
>>> FEATURED STOCK ARTICLE : Gap Up Gain and Strong Finish Triggered Technical Buy Signal - 2/13/2017 |
View all notes |
Set NEW NOTE alert |
Company Profile |
SEC
News |
Chart |
Request a new note
C
A
S
I |
CSFL
-
NASDAQ
Centerstate Banks Inc
Banks-Southeast
|
$25.45
|
+0.03
0.12% |
$25.46
|
198,758
67.84% of 50 DAV
50 DAV is 293,000
|
$26.30
-3.23%
|
10/10/2016
|
$18.20
|
PP = $18.37
|
|
MB = $19.29
|
Most Recent Note - 2/13/2017 5:36:48 PM
G - Recently finding support after sputtering near its 50 DMA line ($24.83). Recent low ($23.80 on 2/08/17) defines important near-term support where further deterioration would trigger a technical sell signal. Completed a new Public Offering of shares on 1/10/17.
>>> FEATURED STOCK ARTICLE : Found Support Near 50-Day Average Following Offering - 2/6/2017 |
View all notes |
Set NEW NOTE alert |
Company Profile |
SEC
News |
Chart |
Request a new note
C
A
S
I |
IESC
-
NASDAQ
Integrated Electric Svcs
Bldg-Maintenance and Svc
|
$20.20
|
-0.20
-0.98% |
$20.50
|
62,106
94.67% of 50 DAV
50 DAV is 65,600
|
$23.00
-12.17%
|
11/23/2016
|
$19.35
|
PP = $18.26
|
|
MB = $19.17
|
Most Recent Note - 2/13/2017 5:51:18 PM
G - Consolidating above its 50 DMA line ($19.78) with a volume-driven loss today. Prior low ($18.05 on 1/18/17) defines important support near prior highs. Recently reported Dec '16 quarterly earnings -33% on +27% sales revenues, below the +25% minimum earnings guideline (C criteria), raising fundamental concerns.
>>> FEATURED STOCK ARTICLE : Violated 50-Day Moving Average Line and Now Testing Prior Highs - 1/19/2017 |
View all notes |
Set NEW NOTE alert |
Company Profile |
SEC
News |
Chart |
Request a new note
C
A
S
I |
NSP
-
NYSE
Insperity Inc
Comml Svcs-Outsourcing
|
$85.90
|
+1.35
1.60% |
$86.00
|
219,181
155.45% of 50 DAV
50 DAV is 141,000
|
$86.35
-0.52%
|
2/14/2017
|
$84.30
|
PP = $82.28
|
|
MB = $86.39
|
Most Recent Note - 2/14/2017 6:06:56 PM
Y - Finished near the middle of its range today after highlighted in yellow with pivot point cited based on its 7/26/16 high plus 10 cents in the earlier mid-day report (read here) noted - "Spiked to new all-time highs today after a considerable volume-driven gain on the prior session triggering a technical buy signal. Reported earnings +76% on +12% sales revenues for the Dec '16 quarter, and prior quarters showed strong earnings increases above the +25% minimum guideline (C criteria). Annual earnings (A criteria) history has improved after a downturn in FY '13." See the latest FSU analysis for more details and a new annotated graph.
>>> FEATURED STOCK ARTICLE : Big Volume-Driven Gains Indicative of Institutional Demand - 2/14/2017 |
View all notes |
Set NEW NOTE alert |
Company Profile |
SEC
News |
Chart |
Request a new note
C
A
S
I |
Symbol/Exchange
Company Name
Industry Group |
PRICE |
CHANGE
(%Change) |
Day High |
Volume
(% DAV)
(% 50 day avg vol) |
52 Wk Hi
% From Hi |
Featured
Date |
Price
Featured |
Pivot Featured |
|
Max Buy |
BERY
-
NYSE
Berry Plastics Group Inc
CONSUMER NON-DURABLES - Packaging and Containers
|
$50.31
|
+0.69
1.39% |
$50.34
|
1,327,062
107.72% of 50 DAV
50 DAV is 1,232,000
|
$52.97
-5.02%
|
11/30/2016
|
$50.26
|
PP = $46.47
|
|
MB = $48.79
|
Most Recent Note - 2/13/2017 5:43:42 PM
G - Its Relative Strength Rating has slumped to 77, below the 80+ minimum for buy candidates under the fact-based investment system. Sputtering near recent lows in the $48.50 area defining near-term support. Damaging losses and violations would trigger a more worrisome technical sell signal. Reported earnings +43% on -7% sales revenues for the Dec '16 quarter. See the latest FSU analysis for more details and an annotated graph.
>>> FEATURED STOCK ARTICLE : Recent 50-Day Violation Raised Concerns - 2/7/2017 |
View all notes |
Set NEW NOTE alert |
Company Profile |
SEC
News |
Chart |
Request a new note
C
A
S
I |
EVR
-
NYSE
Evercore Partners Inc
FINANCIAL SERVICES - Investment Banking
|
$80.15
|
+1.10
1.39% |
$80.60
|
595,467
141.78% of 50 DAV
50 DAV is 420,000
|
$81.75
-1.96%
|
1/5/2017
|
$71.40
|
PP = $72.07
|
|
MB = $75.67
|
Most Recent Note - 2/13/2017 5:48:40 PM
G - Consolidating after getting very extended from its prior base. Recently reported Dec '16 quarterly earnings +17% on +9% sales revenues, below the +25% minimum earnings guideline (C criteria), raising fundamental concerns.
>>> FEATURED STOCK ARTICLE : Perched Near All-Time High Building New Flat Base - 1/5/2017 |
View all notes |
Set NEW NOTE alert |
Company Profile |
SEC
News |
Chart |
Request a new note
C
A
S
I |
NTES
-
NASDAQ
Netease Inc Adr
INTERNET - Internet Information Providers
|
$298.73
|
+36.88
14.08% |
$299.68
|
3,734,625
393.95% of 50 DAV
50 DAV is 948,000
|
$272.58
9.59%
|
2/10/2017
|
$259.30
|
PP = $272.68
|
|
MB = $286.31
|
Most Recent Note - 2/16/2017 12:38:17 PM
Y - Triggered a technical buy signal with a big "breakaway gap" backed by heavy volume. Reported earnings +57% on +43% sales revenues for the Dec '16 quarter, continuing its strong earnings track record. NTES was highlighted in yellow with new pivot point cited based on its 10/14/16 high plus 10 cents in the 2/10/17 mid-day report (read here) when noted - "Subsequent volume driven gains for new highs may trigger a technical buy signal. Due to report Dec '16 earnings on 2/15/17 and volume and volatility often increase near earnings news. Gradually rebounding after dropped from the Featured Stocks list on 12/12/16."
>>> FEATURED STOCK ARTICLE : Rebounding With Earnings News Due Soon - 2/10/2017 |
View all notes |
Set NEW NOTE alert |
Company Profile |
SEC
News |
Chart |
Request a new note
C
A
S
I |
STMP
-
NASDAQ
Stamps.com Inc
INTERNET - Internet Software and Services
|
$128.55
|
-0.60
-0.46% |
$132.30
|
229,540
110.89% of 50 DAV
50 DAV is 207,000
|
$129.90
-1.04%
|
2/16/2017
|
$129.45
|
PP = $123.85
|
|
MB = $130.04
|
Most Recent Note - 2/16/2017 5:24:29 PM
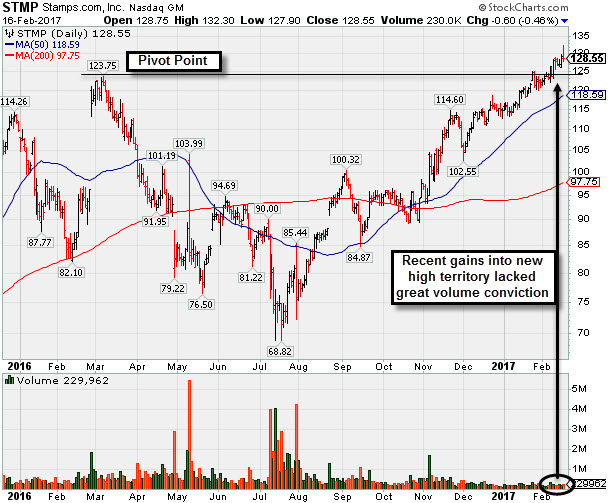
Y - It was highlighted in yellow with pivot point cited based on its 3/07/16 high plus 10 cents in the earlier mid-day report while noted - "Subsequent volume-driven gains may help clinch a convincing technical buy signal. Recently it has been wedging to new highs with gains lacking great volume conviction. Due to report Dec'16 earnings on 2/23/17. Reported earnings +104% on +79% sales revenues for the Sep '16 quarter, continuing its strong growth track record. Went through a deep and choppy consolidation after dropped from the Featured Stocks list on 1/15/16.
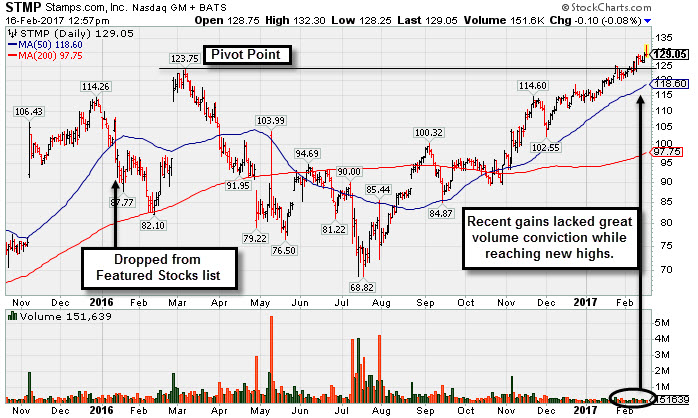 " See the latest FSU analysis for more details and a new annotated graph. " See the latest FSU analysis for more details and a new annotated graph.
>>> FEATURED STOCK ARTICLE : Recent Gains Have Lacked Heavy Volume Indicative of Accumulation - 2/16/2017 |
View all notes |
Set NEW NOTE alert |
Company Profile |
SEC
News |
Chart |
Request a new note
C
A
S
I |
HTHT
-
NASDAQ
China Lodging Group Ads
LEISURE - Lodging
|
$57.30
|
+1.49
2.67% |
$58.44
|
257,162
169.19% of 50 DAV
50 DAV is 152,000
|
$59.20
-3.21%
|
9/29/2016
|
$46.12
|
PP = $47.82
|
|
MB = $50.21
|
Most Recent Note - 2/16/2017 12:23:34 PM
G - Challenging its 52-week high with today's gain backed by above average volume. Prior highs in the $54 area define near-term support above its 50 DMA line. Repeatedly noted with caution in prior reports - "Reported earnings +10% on +6% sales revenues for the Sep '16 quarter, below the +25% minimum earnings guideline (C criteria), raising concerns." See the latest FSU analysis for more details and a new annotated graph.
>>> FEATURED STOCK ARTICLE : Mostly Bullish Action Continues Since Latest Earnings Report - 2/9/2017 |
View all notes |
Set NEW NOTE alert |
Company Profile |
SEC
News |
Chart |
Request a new note
C
A
S
I |
Symbol/Exchange
Company Name
Industry Group |
PRICE |
CHANGE
(%Change) |
Day High |
Volume
(% DAV)
(% 50 day avg vol) |
52 Wk Hi
% From Hi |
Featured
Date |
Price
Featured |
Pivot Featured |
|
Max Buy |
LMAT
-
NASDAQ
Lemaitre Vascular Inc
Medical-Products
|
$23.19
|
-0.34
-1.44% |
$23.57
|
47,794
44.25% of 50 DAV
50 DAV is 108,000
|
$27.04
-14.23%
|
12/22/2016
|
$24.99
|
PP = $25.09
|
|
MB = $26.34
|
Most Recent Note - 2/16/2017 5:29:15 PM
G - Met resistance at its 50 DMA line this week while rebounding. A rally above its 50 DMA line ($23.82) would help its outlook to improve.
>>> FEATURED STOCK ARTICLE : Concerns Increase While Lingering Below 50-Day Moving Average - 1/27/2017 |
View all notes |
Set NEW NOTE alert |
Company Profile |
SEC
News |
Chart |
Request a new note
C
A
S
I |
BEAT
-
NASDAQ
BioTelemetry Inc
Medical-Services
|
$24.85
|
-0.25
-1.00% |
$25.55
|
343,430
117.21% of 50 DAV
50 DAV is 293,000
|
$25.94
-4.22%
|
2/14/2017
|
$25.10
|
PP = $24.55
|
|
MB = $25.78
|
Most Recent Note - 2/15/2017 12:10:48 PM
Y - Gapped up today hitting another new high. Yesterday in the mid-day report it was highlighted in yellow with new pivot point cited based on its 2/06/17 high plus 10 cents after a saucer-with-handle base above its prior base. The volume-driven gain above its pivot point was backed by +121% above average volume triggering a new (or add-on) technical buy signal. Prior highs in the $24 area and its 50 DMA line ($22.49) define important near-term support.
>>> FEATURED STOCK ARTICLE : Volume Totals Cooling While Consolidating Above Prior Highs - 1/10/2017 |
View all notes |
Set NEW NOTE alert |
Company Profile |
SEC
News |
Chart |
Request a new note
C
A
S
I |
PATK
-
NASDAQ
Patrick Industries Inc
WHOLESALE - Building Materials Wholesale
|
$81.00
|
-3.25
-3.86% |
$83.80
|
329,933
279.60% of 50 DAV
50 DAV is 118,000
|
$86.10
-5.92%
|
11/29/2016
|
$72.45
|
PP = $69.63
|
|
MB = $73.11
|
Most Recent Note - 2/16/2017 12:43:55 PM
G - Reported earnings +14% on +30% sales revenues for the Dec '16 quarter, below the +25% minimum earnings guideline (C criteria) raising fundamental concerns. Finding support at its 50 DMA line ($79.05) after it tested recent lows in the $76 area. More damaging losses may trigger a technical sell signal.
>>> FEATURED STOCK ARTICLE : Perched Near All-Time High Extended From Prior Base - 1/31/2017 |
View all notes |
Set NEW NOTE alert |
Company Profile |
SEC
News |
Chart |
Request a new note
C
A
S
I |
ESNT
-
NYSE
Essent Group Ltd
Finance-MrtgandRel Svc
|
$36.22
|
-0.17
-0.47% |
$36.40
|
667,043
101.37% of 50 DAV
50 DAV is 658,000
|
$38.10
-4.93%
|
1/25/2017
|
$34.09
|
PP = $34.04
|
|
MB = $35.74
|
Most Recent Note - 2/16/2017 5:34:21 PM
G - It is still extended from any sound base. Its 50 DMA line and prior highs define important near-term support in the $33-34 area. Reported earnings +42% on +30% sales revenues for the Dec '16 quarter, continuing its strong earnings track record.
>>> FEATURED STOCK ARTICLE : Twice Average Volume Behind Big Breakout Gain - 1/25/2017 |
View all notes |
Set NEW NOTE alert |
Company Profile |
SEC
News |
Chart |
Request a new note
C
A
S
I |
ANET
-
NYSE
Arista Networks Inc
TELECOMMUNICATIONS - Communication Equipment
|
$100.17
|
-0.50
-0.50% |
$102.19
|
1,445,441
204.16% of 50 DAV
50 DAV is 708,000
|
$103.00
-2.75%
|
12/30/2016
|
$96.77
|
PP = $99.00
|
|
MB = $103.95
|
Most Recent Note - 2/16/2017 5:32:46 PM
Y - Challenged its 52-week high today but it encountered distributional pressure. Color code is changed to yellow as it has recovered impressively and faces no resistance due to overhead supply, but it has not formed a sound base after its gap down on 1/17/17
>>> FEATURED STOCK ARTICLE : Technical Damages Raised Concern and Triggered Technical Sell Signal - 1/18/2017 |
View all notes |
Set NEW NOTE alert |
Company Profile |
SEC
News |
Chart |
Request a new note
C
A
S
I |
Symbol/Exchange
Company Name
Industry Group |
PRICE |
CHANGE
(%Change) |
Day High |
Volume
(% DAV)
(% 50 day avg vol) |
52 Wk Hi
% From Hi |
Featured
Date |
Price
Featured |
Pivot Featured |
|
Max Buy |
VBTX
-
NASDAQ
Veritex Holdings Inc
BANKING - Regional - Southwest Banks
|
$28.76
|
+0.45
1.59% |
$28.83
|
45,439
44.99% of 50 DAV
50 DAV is 101,000
|
$29.33
-1.94%
|
1/23/2017
|
$27.30
|
PP = $27.87
|
|
MB = $29.26
|
Most Recent Note - 2/14/2017 6:08:36 PM
Y - Posted a solid gain today with above average volume and finished near the session high. Prior highs in the $27 area define initial support above its 50 DMA line ($26.05).
>>> FEATURED STOCK ARTICLE : Challenged Highs But Ended in Bottom Third of Intra-day Range - 1/23/2017 |
View all notes |
Set NEW NOTE alert |
Company Profile |
SEC
News |
Chart |
Request a new note
C
A
S
I |
SFBS
-
NASDAQ
Servisfirst Bancshares
BANKING - Regional - Southeast Banks
|
$42.30
|
+0.21
0.50% |
$42.35
|
179,872
76.54% of 50 DAV
50 DAV is 235,000
|
$42.34
-0.09%
|
7/19/2016
|
$26.64
|
PP = $26.41
|
|
MB = $27.73
|
Most Recent Note - 2/13/2017 1:00:04 PM
G - Hitting another new all-time high today. Recently reported earnings +8% on +20% sales revenues for the Dec '16 quarter, below the +25% minimum guideline (C criteria), raising fundamental concerns. Its 50 DMA line ($37.52) defines important near-term support above recent lows in the $36 area. Subsequent violations would trigger technical sell signals.
>>> FEATURED STOCK ARTICLE : Stubbornly Holding Ground Near Highs - 1/12/2017 |
View all notes |
Set NEW NOTE alert |
Company Profile |
SEC
News |
Chart |
Request a new note
C
A
S
I |
LITE
-
NASDAQ
Lumentum Holdings Inc
TELECOMMUNICATIONS - Cables / Satalite Equipment
|
$51.85
|
+2.40
4.85% |
$52.00
|
2,020,107
168.48% of 50 DAV
50 DAV is 1,199,000
|
$51.25
1.17%
|
2/8/2017
|
$44.60
|
PP = $44.80
|
|
MB = $47.04
|
Most Recent Note - 2/16/2017 5:27:08 PM
G - Hit another new high today, getting very extended from its prior base with a spurt of volume-driven gains. Prior highs in the $44-45 area define initial support to watch on pullbacks.
>>> FEATURED STOCK ARTICLE : Gap Up Gain and Strong Finish Triggered Technical Buy Signal - 2/8/2017 |
View all notes |
Set NEW NOTE alert |
Company Profile |
SEC
News |
Chart |
Request a new note
C
A
S
I |
LCII
-
NYSE
L C I Industries
MATERIALS and CONSTRUCTION - General Building Materials
|
$109.85
|
+1.15
1.06% |
$110.05
|
166,088
97.70% of 50 DAV
50 DAV is 170,000
|
$117.15
-6.23%
|
11/29/2016
|
$106.29
|
PP = $101.00
|
|
MB = $106.05
|
Most Recent Note - 2/14/2017 12:28:22 PM
G - Rebounded from the session's early lows after dipping further below its 50 DMA line and also undercutting the prior low ($105.05 on 1/20/17) raising concerns. Further deterioration may trigger a more worrisome technical sell signal. A rebound above the 50 DMA line ($109.67) is needed for its outlook to improve. Fundamentals through Dec '16 remain strong.
>>> FEATURED STOCK ARTICLE : Distributional Action While Retreating From Highs - 1/30/2017 |
View all notes |
Set NEW NOTE alert |
Company Profile |
SEC
News |
Chart |
Request a new note
C
A
S
I |