You are not logged in.
This means you
CAN ONLY VIEW reports that were published prior to Wednesday, April 2, 2025.
You
MUST UPGRADE YOUR MEMBERSHIP if you want to see any current reports.
AFTER MARKET UPDATE - FRIDAY, FEBRUARY 10TH, 2017
Previous After Market Report Next After Market Report >>>
|
|
|
|
DOW |
+96.97 |
20,269.37 |
+0.48% |
|
Volume |
927,094,740 |
-7% |
|
Volume |
1,709,560,040 |
-3% |
|
NASDAQ |
+18.95 |
5,734.13 |
+0.33% |
|
Advancers |
2,128 |
72% |
|
Advancers |
1,902 |
67% |
|
S&P 500 |
+8.23 |
2,316.10 |
+0.36% |
|
Decliners |
820 |
28% |
|
Decliners |
916 |
32% |
|
Russell 2000 |
+10.32 |
1,388.84 |
+0.75% |
|
52 Wk Highs |
217 |
|
|
52 Wk Highs |
216 |
|
|
S&P 600 |
+6.87 |
849.64 |
+0.82% |
|
52 Wk Lows |
3 |
|
|
52 Wk Lows |
22 |
|
|
 |
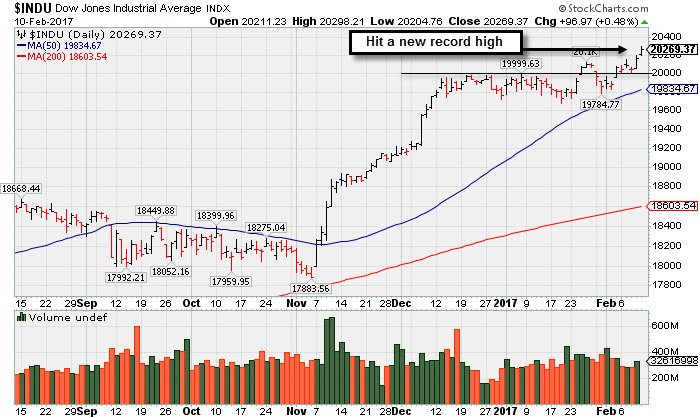
Indices Extend Rally Into Record High Territory
Kenneth J. Gruneisen - Passed the CAN SLIM® Master's Exam
For the week, the Dow climbed 1%, the S&P 500 was up 0.8%, while the Nasdaq advanced 1.2%. Stocks finished higher on Friday. The Dow was up 96 points to 20269. The S&P 500 added 8 points to 2316 and the Nasdaq Composite gained 18 points to 5734. Volume totals were lighter than the prior session totals on the NYSE and on the Nasdaq exchange. Breadth was positive as advancers led decliners by more than a 2-1 margin the NYSE and on the Nasdaq exchange. There were 59 high-ranked companies from the Leaders List that made new 52-week highs and were listed on the BreakOuts Page, versus the total of 52 on the prior session. New 52-week highs totals expanded and solidly outnumbered new 52-week lows on both the NYSE and the Nasdaq exchange.
PICTURED: The Dow Jones Industrial Average rallied for a new record high. It stayed well above near-term support at its 50-day moving average (DMA) line during the recent consolidation.
Leadership remains healthy as the major averages' (M criteria) have maintained an upward trend. New buying efforts should only be made in candidates with superior fundamental and technical characteristics. The Featured Stocks Page lists noteworthy high-ranked leaders.
The major averages reached new highs amid investor optimism over President Trump's promise for corporate tax reform. On Thursday, Trump said to expect an announcement in the next few weeks that will be "phenomenal" in terms of tax. On the data front, a University of Michigan preliminary report on consumer sentiment came in at 95.7, below the expected 98.5.
Ten of 11 sectors in the S&P 500 finished in positive territory. In M&A news, Mead Johnson Nutrition (MJN +5.62%) rose after agreeing to a $16.6 billion takeover bid from Reckitt Benckiser. Sears Holdings (SHLD +25.63%) surged after the company announced restructuring aimed at $1.1 billion in annual cost savings. In Tech, Activision Blizzard (ATVI +18.88%) rallied as the software developer reported better-than-expected quarterly profit. Yelp (YELP -13.64%) was a notable decliner amid decelerating user growth.
Treasuries were modestly lower with the benchmark 10-year note declining 4/32 to yield 2.41%. In commodities, NYMEX WTI crude added 1.5% to $53.80/barrel after news that OPEC countries have delivered 90% of promised production cuts. COMEX gold lost 0.1% to $1234.40/ounce. |
 Kenneth J. Gruneisen started out as a licensed stockbroker in August 1987, a couple of months prior to the historic stock market crash that took the Dow Jones Industrial Average down -22.6% in a single day. He has published daily fact-based fundamental and technical analysis on high-ranked stocks online for two decades. Through FACTBASEDINVESTING.COM, Kenneth provides educational articles, news, market commentary, and other information regarding proven investment systems that work in good times and bad.
Comments contained in the body of this report are technical opinions only and are not necessarily those of Gruneisen Growth Corp. The material herein has been obtained from sources believed to be reliable and accurate, however, its accuracy and completeness cannot be guaranteed. Our firm, employees, and customers may effect transactions, including transactions contrary to any recommendation herein, or have positions in the securities mentioned herein or options with respect thereto. Any recommendation contained in this report may not be suitable for all investors and it is not to be deemed an offer or solicitation on our part with respect to the purchase or sale of any securities. |
|
 |
Commodity-Linked Groups Led Retail and Financial Groups Higher
Kenneth J. Gruneisen - Passed the CAN SLIM® Master's Exam
The Retail Index ($RLX +0.50%) outpaced the Broker/Dealer Index ($XBD +0.11%) and the Bank Index ($BKX +0.23%) as the major indices rose further on Friday. The tech sector was led by the Networking Index ($NWX +0.96%) while the Biotechnology Index ($BTK -0.15%) and the Semiconductor Index ($SOX +0.08%) both ended slightly lower. The Oil Services Index ($OSX +1.13%) and the Integrated Oil Index ($XOI +0.93%) both ratcheted higher and the Gold & Silver Index ($XAU +1.49%) also tallied a gain. Charts courtesy www.stockcharts.com
 PICTURED: The Retail Index ($RLX +0.50%) rallied for a new record high.
| Oil Services |
$OSX |
180.22 |
+2.02 |
+1.13% |
-1.94% |
| Integrated Oil |
$XOI |
1,233.07 |
+11.35 |
+0.93% |
-2.75% |
| Semiconductor |
$SOX |
963.05 |
-0.76 |
-0.08% |
+6.24% |
| Networking |
$NWX |
459.91 |
+4.37 |
+0.96% |
+3.10% |
| Broker/Dealer |
$XBD |
221.64 |
+0.25 |
+0.11% |
+7.97% |
| Retail |
$RLX |
1,413.43 |
+7.09 |
+0.50% |
+5.25% |
| Gold & Silver |
$XAU |
95.42 |
+1.40 |
+1.49% |
+21.00% |
| Bank |
$BKX |
93.14 |
+0.21 |
+0.23% |
+1.47% |
| Biotech |
$BTK |
3,337.03 |
-4.89 |
-0.15% |
+8.52% |
|
|
|
 |
Rebounding With Earnings News Due Soon
Kenneth J. Gruneisen - Passed the CAN SLIM® Master's Exam
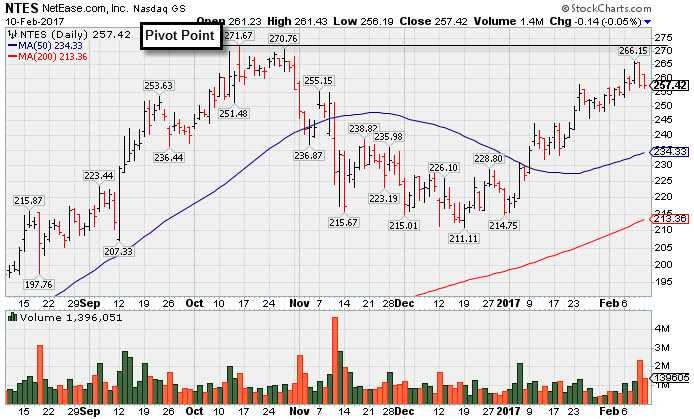
Netease Inc (NTES -$0.14 or -0.05% to $257.42) was highlighted in yellow with new pivot point cited based on its 10/14/16 high plus 10 cents in the earlier mid-day report (read here). Subsequent volume driven gains for new highs may trigger a technical buy signal. It is due to report Dec '16 earnings on 2/15/17 and volume and volatility often increase near earnings news.
It was last shown in this FSU section with an annotated graph under the headline, "Concerns Remain While Lingering Below 50-Day Moving Average", It has been gradually rebounding after dropped from the Featured Stocks list on 12/12/16, Fundamentals remain strong but it was last noted - "Through the Sep '16 quarter it showed sales revenues and earnings increases above the +25% minimum guideline (C criteria), but deceleration in sequential quarterly comparisons is cause for concern."
Recently it reported earnings +40% on +32% sales revenues for the Sep '16 quarter. Those earnings results were above the +25% minimum guideline (C criteria), but not as impressive as its reported earnings +89% on +83% sales revenues for the Jun '16 quarter, and ever stronger quarters prior. Annual earnings (A criteria) growth has been strong.
NTES currently has a Timeliness rating of A and a Sponsorship Rating of B. The number of top-rated funds owning its shares rose from 467 in Jun '15 to 951 in Dec '16, a reassuring sign concerning the I criteria. Its current Up/Down Volume Ratio of 1.2 is an unbiased indication its shares have been under slight accumulation over the past 50 days. |
|
|
Color Codes Explained :
Y - Better candidates highlighted by our
staff of experts.
G - Previously featured
in past reports as yellow but may no longer be buyable under the
guidelines.
***Last / Change / Volume data in this table is the closing quote data***
Symbol/Exchange
Company Name
Industry Group |
PRICE |
CHANGE
(%Change) |
Day High |
Volume
(% DAV)
(% 50 day avg vol) |
52 Wk Hi
% From Hi |
Featured
Date |
Price
Featured |
Pivot Featured |
|
Max Buy |
THO
-
NYSE
Thor Industries Inc
AUTOMOTIVE - Recreational Vehicles
|
$109.09
|
-1.56
-1.41% |
$111.40
|
491,269
70.89% of 50 DAV
50 DAV is 693,000
|
$110.80
-1.54%
|
1/24/2017
|
$100.52
|
PP = $108.45
|
|
MB = $113.87
|
Most Recent Note - 2/8/2017 6:57:23 PM
Y - Gapped up and rallied above its pivot point with today's gain backed by very near the +40% above average volume needed to trigger a proper technical buy signal.
>>> FEATURED STOCK ARTICLE : Rose From Support at 50-Day Moving Average Line - 1/24/2017 |
View all notes |
Set NEW NOTE alert |
Company Profile |
SEC
News |
Chart |
Request a new note
C
A
S
I |
CSFL
-
NASDAQ
Centerstate Banks Inc
Banks-Southeast
|
$24.79
|
+0.32
1.31% |
$24.90
|
207,612
67.85% of 50 DAV
50 DAV is 306,000
|
$26.30
-5.74%
|
10/10/2016
|
$18.20
|
PP = $18.37
|
|
MB = $19.29
|
Most Recent Note - 2/6/2017 5:54:12 PM
G - Consolidating after gapping up on the prior session finding support near its 50 DMA line. Completed a new Public Offering of shares on 1/10/17. See the latest FSU analysis for more details and a new annotated graph.
>>> FEATURED STOCK ARTICLE : Found Support Near 50-Day Average Following Offering - 2/6/2017 |
View all notes |
Set NEW NOTE alert |
Company Profile |
SEC
News |
Chart |
Request a new note
C
A
S
I |
IESC
-
NASDAQ
I E S Holdings Inc
Bldg-Maintenance and Svc
|
$20.95
|
-0.20
-0.95% |
$21.52
|
82,347
111.28% of 50 DAV
50 DAV is 74,000
|
$23.00
-8.91%
|
11/23/2016
|
$19.35
|
PP = $18.26
|
|
MB = $19.17
|
Most Recent Note - 2/9/2017 12:14:27 PM
G - Reported Dec '16 quarterly earnings -33% on +27% sales revenues, below the +25% minimum earnings guideline (C criteria) raising fundamental concerns. Rallying above its 50 DMA line with a big volume-driven gain today helping its technical stance improve. Prior low ($18.05 on 1/18/17) defines important support near prior highs.
>>> FEATURED STOCK ARTICLE : Violated 50-Day Moving Average Line and Now Testing Prior Highs - 1/19/2017 |
View all notes |
Set NEW NOTE alert |
Company Profile |
SEC
News |
Chart |
Request a new note
C
A
S
I |
BERY
-
NYSE
Berry Plastics Group Inc
CONSUMER NON-DURABLES - Packaging and Containers
|
$49.03
|
+0.07
0.14% |
$49.43
|
1,993,846
142.13% of 50 DAV
50 DAV is 1,402,800
|
$52.97
-7.44%
|
11/30/2016
|
$50.26
|
PP = $46.47
|
|
MB = $48.79
|
Most Recent Note - 2/7/2017 5:38:04 PM
G - Slumped below its 50 DMA line with damaging volume-driven losses raising concerns. Recent lows in the $48.50 area define near-term support where a violation would trigger a more worrisome technical sell signal. Reported earnings +43% on -7% sales revenues for the Dec '16 quarter. See the latest FSU analysis for more details and a new annotated graph.
>>> FEATURED STOCK ARTICLE : Recent 50-Day Violation Raised Concerns - 2/7/2017 |
View all notes |
Set NEW NOTE alert |
Company Profile |
SEC
News |
Chart |
Request a new note
C
A
S
I |
EVR
-
NYSE
Evercore Partners Inc
FINANCIAL SERVICES - Investment Banking
|
$78.55
|
-0.45
-0.57% |
$79.25
|
397,454
90.54% of 50 DAV
50 DAV is 439,000
|
$81.75
-3.91%
|
1/5/2017
|
$71.40
|
PP = $72.07
|
|
MB = $75.67
|
Most Recent Note - 2/7/2017 12:21:50 PM
G - Pulling back today after 5 consecutive volume-driven gains, getting very extended from its prior base. Recently reported Dec '16 quarterly earnings +17% on +9% sales revenues, below the +25% minimum earnings guideline (C criteria), raising fundamental concerns.
>>> FEATURED STOCK ARTICLE : Perched Near All-Time High Building New Flat Base - 1/5/2017 |
View all notes |
Set NEW NOTE alert |
Company Profile |
SEC
News |
Chart |
Request a new note
C
A
S
I |
Symbol/Exchange
Company Name
Industry Group |
PRICE |
CHANGE
(%Change) |
Day High |
Volume
(% DAV)
(% 50 day avg vol) |
52 Wk Hi
% From Hi |
Featured
Date |
Price
Featured |
Pivot Featured |
|
Max Buy |
NTES
-
NASDAQ
Netease Inc Adr
INTERNET - Internet Information Providers
|
$257.42
|
-0.14
-0.05% |
$261.43
|
1,394,971
149.35% of 50 DAV
50 DAV is 934,000
|
$272.58
-5.56%
|
2/10/2017
|
$259.30
|
PP = $272.68
|
|
MB = $286.31
|
 Most Recent Note - 2/10/2017 5:07:23 PM
Y - It was highlighted in yellow with new pivot point cited based on its 10/14/16 high plus 10 cents in the earlier mid-day report. Subsequent volume driven gains for new highs may trigger a technical buy signal. Due to report Dec '16 earnings on 2/15/17 and volume and volatility often increase near earnings news. Gradually rebounding after dropped from the Featured Stocks list on 12/12/16, Fundamentals remain strong but it was last noted - "Through the Sep '16 quarter it showed sales revenues and earnings increases above the +25% minimum guideline (C criteria), but deceleration in sequential quarterly comparisons is cause for concern." See the latest FSU analysis for more details and a new annotated graph.
>>> FEATURED STOCK ARTICLE : Rebounding With Earnings News Due Soon - 2/10/2017 |
View all notes |
Set NEW NOTE alert |
Company Profile |
SEC
News |
Chart |
Request a new note
C
A
S
I |
HTHT
-
NASDAQ
China Lodging Group Ads
LEISURE - Lodging
|
$55.14
|
-0.36
-0.65% |
$55.78
|
200,900
130.45% of 50 DAV
50 DAV is 154,000
|
$59.20
-6.86%
|
9/29/2016
|
$46.12
|
PP = $47.82
|
|
MB = $50.21
|
Most Recent Note - 2/9/2017 6:42:45 PM
G - Consolidating above prior highs in the $54 area defining near-term support above its 50 DMA line. Repeatedly noted with caution in prior reports - "Reported earnings +10% on +6% sales revenues for the Sep '16 quarter, below the +25% minimum earnings guideline (C criteria), raising concerns." See the latest FSU analysis for more details and a new annotated graph.
>>> FEATURED STOCK ARTICLE : Mostly Bullish Action Continues Since Latest Earnings Report - 2/9/2017 |
View all notes |
Set NEW NOTE alert |
Company Profile |
SEC
News |
Chart |
Request a new note
C
A
S
I |
LMAT
-
NASDAQ
Lemaitre Vascular Inc
Medical-Products
|
$23.35
|
+0.23
0.99% |
$23.63
|
58,461
51.28% of 50 DAV
50 DAV is 114,000
|
$27.04
-13.64%
|
12/22/2016
|
$24.99
|
PP = $25.09
|
|
MB = $26.34
|
Most Recent Note - 2/6/2017 6:08:17 PM
G - Sank further below its 50 DMA line with above average volume behind today's loss. Its Relative Strength Rating has fallen to 79, below the 80+ minimum guideline for buy candidates.A rebound above its 50 DMA line ($23.82) is needed for its outlook to improve.
>>> FEATURED STOCK ARTICLE : Concerns Increase While Lingering Below 50-Day Moving Average - 1/27/2017 |
View all notes |
Set NEW NOTE alert |
Company Profile |
SEC
News |
Chart |
Request a new note
C
A
S
I |
BEAT
-
NASDAQ
BioTelemetry Inc
Medical-Services
|
$23.80
|
+0.00
0.00% |
$23.95
|
177,320
63.56% of 50 DAV
50 DAV is 279,000
|
$24.45
-2.66%
|
12/19/2016
|
$22.91
|
PP = $21.78
|
|
MB = $22.87
|
Most Recent Note - 2/9/2017 6:47:22 PM
G - Forming a saucer-with-handle base above its prior base, holding its ground stubbornly while perched at multi-year highs and volume totals have been cooling. Its 50 DMA line and prior lows define important near-term support.
>>> FEATURED STOCK ARTICLE : Volume Totals Cooling While Consolidating Above Prior Highs - 1/10/2017 |
View all notes |
Set NEW NOTE alert |
Company Profile |
SEC
News |
Chart |
Request a new note
C
A
S
I |
PATK
-
NASDAQ
Patrick Industries Inc
WHOLESALE - Building Materials Wholesale
|
$83.75
|
-1.70
-1.99% |
$86.10
|
118,898
98.26% of 50 DAV
50 DAV is 121,000
|
$85.50
-2.05%
|
11/29/2016
|
$72.45
|
PP = $69.63
|
|
MB = $73.11
|
Most Recent Note - 2/9/2017 6:54:00 PM
G - Gapped up today and rallied for new all-time highs, getting more extended from its prior base. Its 50 DMA line and recent lows in the $76 area define support to watch.
>>> FEATURED STOCK ARTICLE : Perched Near All-Time High Extended From Prior Base - 1/31/2017 |
View all notes |
Set NEW NOTE alert |
Company Profile |
SEC
News |
Chart |
Request a new note
C
A
S
I |
Symbol/Exchange
Company Name
Industry Group |
PRICE |
CHANGE
(%Change) |
Day High |
Volume
(% DAV)
(% 50 day avg vol) |
52 Wk Hi
% From Hi |
Featured
Date |
Price
Featured |
Pivot Featured |
|
Max Buy |
ESNT
-
NYSE
Essent Group Ltd
Finance-MrtgandRel Svc
|
$36.50
|
+0.26
0.72% |
$38.10
|
934,405
143.98% of 50 DAV
50 DAV is 649,000
|
$36.65
-0.41%
|
1/25/2017
|
$34.09
|
PP = $34.04
|
|
MB = $35.74
|
Most Recent Note - 2/10/2017 12:16:55 PM
G - Reported earnings +42% on +30% sales revenues for the Dec '16 quarter, continuing its strong earnings track record. Hit a new high today, and it is very extended from any sound base. Its 50 DMA line and prior highs define important near-term support in the $33-34 area.
>>> FEATURED STOCK ARTICLE : Twice Average Volume Behind Big Breakout Gain - 1/25/2017 |
View all notes |
Set NEW NOTE alert |
Company Profile |
SEC
News |
Chart |
Request a new note
C
A
S
I |
ANET
-
NYSE
Arista Networks Inc
TELECOMMUNICATIONS - Communication Equipment
|
$98.78
|
+0.97
0.99% |
$99.20
|
407,255
56.88% of 50 DAV
50 DAV is 716,000
|
$103.00
-4.10%
|
12/30/2016
|
$96.77
|
PP = $99.00
|
|
MB = $103.95
|
Most Recent Note - 2/6/2017 5:58:26 PM
G - Consolidating near its 50 DMA line ($95.60) with volume totals cooling while rebounding after a damaging gap down on 1/17/17. Subsequent losses on above average volume would raise greater concerns.
>>> FEATURED STOCK ARTICLE : Technical Damages Raised Concern and Triggered Technical Sell Signal - 1/18/2017 |
View all notes |
Set NEW NOTE alert |
Company Profile |
SEC
News |
Chart |
Request a new note
C
A
S
I |
VBTX
-
NASDAQ
Veritex Holdings Inc
BANKING - Regional - Southwest Banks
|
$27.40
|
-0.21
-0.76% |
$27.68
|
65,911
71.64% of 50 DAV
50 DAV is 92,000
|
$29.33
-6.58%
|
1/23/2017
|
$27.30
|
PP = $27.87
|
|
MB = $29.26
|
Most Recent Note - 2/9/2017 6:51:53 PM
Y - Pulled back with lighter volume 4 days in a row since clinching a technical buy signal with its volume-driven gain on 2/03/17. Prior highs in the $27 area define initial support above its 50 DMA line ($25.58).
>>> FEATURED STOCK ARTICLE : Challenged Highs But Ended in Bottom Third of Intra-day Range - 1/23/2017 |
View all notes |
Set NEW NOTE alert |
Company Profile |
SEC
News |
Chart |
Request a new note
C
A
S
I |
SFBS
-
NASDAQ
Servisfirst Bancshares
BANKING - Regional - Southeast Banks
|
$41.08
|
+0.28
0.69% |
$41.10
|
125,618
49.65% of 50 DAV
50 DAV is 253,000
|
$41.16
-0.19%
|
7/19/2016
|
$26.64
|
PP = $26.41
|
|
MB = $27.73
|
Most Recent Note - 2/6/2017 6:11:41 PM
G - Holding its ground near all-time highs. Recently reported earnings +8% on +20% sales revenues for the Dec '16 quarter, below the +25% minimum guideline (C criteria), raising fundamental concerns. Its 50 DMA line ($37.52) defines important near-term support above recent lows in the $36 area. Subsequent violations would trigger technical sell signals.
>>> FEATURED STOCK ARTICLE : Stubbornly Holding Ground Near Highs - 1/12/2017 |
View all notes |
Set NEW NOTE alert |
Company Profile |
SEC
News |
Chart |
Request a new note
C
A
S
I |
LITE
-
NASDAQ
Lumentum Holdings Inc
TELECOMMUNICATIONS - Cables / Satalite Equipment
|
$47.45
|
+0.85
1.82% |
$48.35
|
1,749,193
155.07% of 50 DAV
50 DAV is 1,128,000
|
$49.40
-3.95%
|
2/8/2017
|
$44.60
|
PP = $44.80
|
|
MB = $47.04
|
Most Recent Note - 2/9/2017 12:19:19 PM
G - Rallying further into new high territory and above its "max buy" level with today's 3rd consecutive volume-driven gain and its color code is changed to green. Finished strong after highlighted in yellow with new pivot point cited based on its 12/09/16 high plus 10 cents. The gain and strong finish above the pivot point triggered a convincing technical buy signal. Reported earnings +73% on +21% sales revenues for the Dec '16 quarter and gapped up hitting a new high. Volume and volatility often increase near earnings news. Rebound above its 50 DMA line with a volume-driven gain on 2/07/17 helping its outlook improve. Relative Strength rating has improved from 81 to 94 since 1/05/17 when dropped from the Featured Stocks list, and it stayed well above its 200 DMA line. See the latest FSU analysis for more details and an annotated graph.
>>> FEATURED STOCK ARTICLE : Gap Up Gain and Strong Finish Triggered Technical Buy Signal - 2/8/2017 |
View all notes |
Set NEW NOTE alert |
Company Profile |
SEC
News |
Chart |
Request a new note
C
A
S
I |
Symbol/Exchange
Company Name
Industry Group |
PRICE |
CHANGE
(%Change) |
Day High |
Volume
(% DAV)
(% 50 day avg vol) |
52 Wk Hi
% From Hi |
Featured
Date |
Price
Featured |
Pivot Featured |
|
Max Buy |
LCII
-
NYSE
L C I Industries
MATERIALS and CONSTRUCTION - General Building Materials
|
$108.35
|
-4.15
-3.69% |
$113.90
|
257,470
146.29% of 50 DAV
50 DAV is 176,000
|
$117.15
-7.51%
|
11/29/2016
|
$106.29
|
PP = $101.00
|
|
MB = $106.05
|
Most Recent Note - 2/10/2017 5:09:34 PM
G - Slumped back below its 50 DMA line ($109.57) with today's volume-driven loss raising concerns. Further deterioration below prior lows ($105.05 on 1/20/17) may trigger a more worrisome technical sell signal. Fundamentals through Dec '16 remain strong.
>>> FEATURED STOCK ARTICLE : Distributional Action While Retreating From Highs - 1/30/2017 |
View all notes |
Set NEW NOTE alert |
Company Profile |
SEC
News |
Chart |
Request a new note
C
A
S
I |
|
|
|
THESE ARE NOT BUY RECOMMENDATIONS!
Comments contained in the body of this report are technical
opinions only. The material herein has been obtained
from sources believed to be reliable and accurate, however,
its accuracy and completeness cannot be guaranteed.
This site is not an investment advisor, hence it does
not endorse or recommend any securities or other investments.
Any recommendation contained in this report may not
be suitable for all investors and it is not to be deemed
an offer or solicitation on our part with respect to
the purchase or sale of any securities. All trademarks,
service marks and trade names appearing in this report
are the property of their respective owners, and are
likewise used for identification purposes only.
This report is a service available
only to active Paid Premium Members.
You may opt-out of receiving report notifications
at any time. Questions or comments may be submitted
by writing to Premium Membership Services 665 S.E. 10 Street, Suite 201 Deerfield Beach, FL 33441-5634 or by calling 1-800-965-8307
or 954-785-1121.
|
|
|