You are not logged in.
This means you
CAN ONLY VIEW reports that were published prior to Saturday, March 29, 2025.
You
MUST UPGRADE YOUR MEMBERSHIP if you want to see any current reports.
AFTER MARKET UPDATE - MONDAY, JANUARY 23RD, 2017
Previous After Market Report Next After Market Report >>>
|
|
|
|
DOW |
-27.40 |
19,799.85 |
-0.14% |
|
Volume |
904,557,100 |
-25% |
|
Volume |
1,505,039,340 |
-5% |
|
NASDAQ |
-2.39 |
5,552.94 |
-0.04% |
|
Advancers |
1,593 |
54% |
|
Advancers |
1,209 |
41% |
|
S&P 500 |
-6.11 |
2,265.20 |
-0.27% |
|
Decliners |
1,333 |
46% |
|
Decliners |
1,748 |
59% |
|
Russell 2000 |
-4.01 |
1,347.84 |
-0.30% |
|
52 Wk Highs |
84 |
|
|
52 Wk Highs |
101 |
|
|
S&P 600 |
-2.46 |
825.10 |
-0.30% |
|
52 Wk Lows |
14 |
|
|
52 Wk Lows |
40 |
|
|
 |
Indices Pulled Back With Lighter Volume Totals
Kenneth J. Gruneisen - Passed the CAN SLIM® Master's Exam
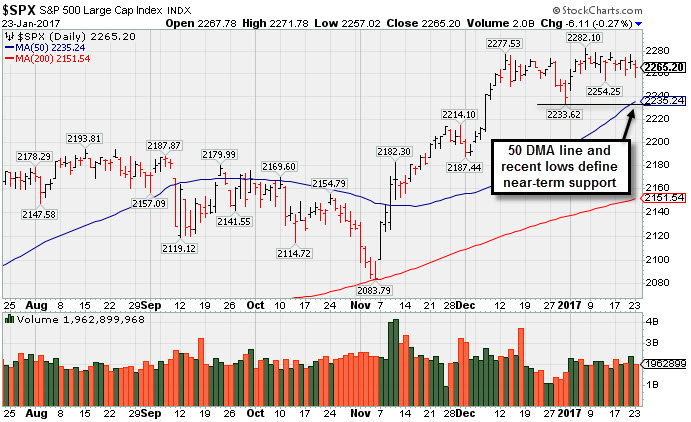
Stocks finished lower on Monday. The Dow was down 27 points to 19799. The S&P 500 lost 6 points to 2265 and the Nasdaq Composite fell 2 points to 5552. Volume totals were lighter than the prior session totals on the NYSE and on the Nasdaq exchange. Breadth was mixed as advancers led decliners by an 8-7 margin on the NYSE while decliners led advancers by nearly 3-2 on the Nasdaq exchange. There were 18 high-ranked companies from the Leaders List that made new 52-week highs and were listed on the BreakOuts Page, matching the total of 18 on the prior session. New 52-week highs outnumbered new 52-week lows on both the NYSE and the Nasdaq exchange.
PICTURED: The S&P 500 Index is consolidating near its record high, above its 50-day moving average (DMA) line and recent lows defining near-term support to watch on pullbacks.
Near record high territory, the major averages (M criteria) are in a confirmed uptrend which has endured distributional pressure. New buying efforts should only be made in candidates with superior fundamental and technical characteristics. The Featured Stocks Page lists noteworthy high-ranked leaders.
The major averages declined on the session Monday amid increasing uncertainty surrounding President Donald Trump’s policies. In a meeting with business leaders, Trump vowed a major border tax on imports and stated that taxes will be cut massively for the middle class. These remarks follow Trump’s inaugural speech on Friday where he took a protectionist tone with unclear implications on fiscal stimulus plans. In M&A news, Aetna (AET -2.7%) fell as the court blocked its proposed acquisition of Humana (HUM +2.24%).
Six of 11 sectors in the S&P 500 ended in negative territory. Energy shares retreated on the session with Schlumberger (SLB -2.57%) ending lower. Halliburton (HAL -2.92%) fell as the oilfield services giant reported weaker-than-expected quarterly revenue. Technology stocks finished lower with Qualcomm (QCOM -12.72%) tumbling after Apple (AAPL +0.08%) filed a lawsuit against the company. In the consumer space, Kate Spade (KATE +3.60%) rose amid reports the retailer is receiving takeover interest. Dish Network (DISH +2.21%) after being the subject of positive analyst commentary.
Treasuries finished higher with the 10-year note up 17/32 to yield 2.40%. In commodities, NYMEX WTI crude lost 0.8% to $52.79/barrel. COMEX gold added 0.9% to $1215.10/ounce. In FOREX, the Dollar Index fell 0.6%. |
 Kenneth J. Gruneisen started out as a licensed stockbroker in August 1987, a couple of months prior to the historic stock market crash that took the Dow Jones Industrial Average down -22.6% in a single day. He has published daily fact-based fundamental and technical analysis on high-ranked stocks online for two decades. Through FACTBASEDINVESTING.COM, Kenneth provides educational articles, news, market commentary, and other information regarding proven investment systems that work in good times and bad.
Comments contained in the body of this report are technical opinions only and are not necessarily those of Gruneisen Growth Corp. The material herein has been obtained from sources believed to be reliable and accurate, however, its accuracy and completeness cannot be guaranteed. Our firm, employees, and customers may effect transactions, including transactions contrary to any recommendation herein, or have positions in the securities mentioned herein or options with respect thereto. Any recommendation contained in this report may not be suitable for all investors and it is not to be deemed an offer or solicitation on our part with respect to the purchase or sale of any securities. |
|
 |
Gold & Silver Index Rose While Energy-Linked Groups Fell
Kenneth J. Gruneisen - Passed the CAN SLIM® Master's Exam
The Retail Index ($RLX +0.27%) and Broker/Dealer Index ($XBD +0.25%) inched higher while the Bank Index ($BKX -0.44%) fell modestly on Monday. The tech sector had a negative bias as the Semiconductor Index ($SOX -0.67%) and the Biotechnology Index ($BTK -1.27%) were both lower and the Networking Index ($NWX +0.15%) eked out a tiny gain. The Gold & Silver Index ($XAU +2.91%) was a standout gainer, meanwhile energy-linked slumped and the Integrated Oil Index ($XOI -0.75%) and Oil Services Index ($OSX -2.28%) both ended lower. Charts courtesy www.stockcharts.com
 PICTURED: The Broker/Dealer Index ($XBD +0.25%) is consolidating above its 50-day moving average (DMA) line and recent lows defining near-term support to watch on pullbacks..
| Oil Services |
$OSX |
184.23 |
-4.30 |
-2.28% |
+0.24% |
| Integrated Oil |
$XOI |
1,251.70 |
-9.51 |
-0.75% |
-1.29% |
| Semiconductor |
$SOX |
923.77 |
-6.24 |
-0.67% |
+1.91% |
| Networking |
$NWX |
441.20 |
+0.68 |
+0.15% |
-1.10% |
| Broker/Dealer |
$XBD |
210.78 |
+0.52 |
+0.25% |
+2.68% |
| Retail |
$RLX |
1,382.85 |
+3.76 |
+0.27% |
+2.97% |
| Gold & Silver |
$XAU |
91.26 |
+2.58 |
+2.91% |
+15.72% |
| Bank |
$BKX |
90.80 |
-0.40 |
-0.44% |
-1.08% |
| Biotech |
$BTK |
3,134.77 |
-40.40 |
-1.27% |
+1.94% |
|
|
|
 |
Challenged Highs But Ended in Bottom Third of Intra-day Range
Kenneth J. Gruneisen - Passed the CAN SLIM® Master's Exam
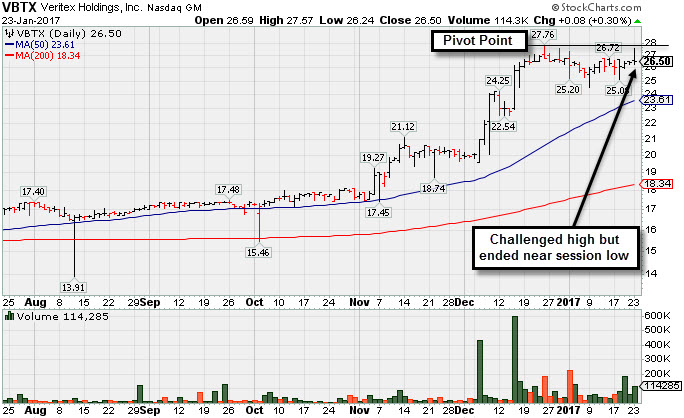
Veritex Holdings Inc (VBTX +$0.08 or +0.30% to $26.50) finished weak after it was highlighted in yellow with new pivot point cited based on its 12/23/16 high plus 10 cents in today's earlier mid-day report (read here). It challenged its all-time high with the session's early gain after a short flat base. Higher volume without meaningful price progress is considered to be a sign of distributional pressure. It is due to report earnings results before the open on Tuesday. Disciplined investors will observe that it was noted - "A gain above the pivot point backed by at least +40% above average volume is needed to trigger a proper technical buy signal. Due to report Dec '16 quarterly earnings, and volume and volatility often increase near earnings news." VBTX completed a new Public Offering on 12/15/16 and was noted in prior mid-day reports - "Patient investors may watch for a new base or secondary buy point to possibly develop and be noted in the weeks ahead. Reported earnings +35% on +32% sales revenues for the Sep '16 quarter, and its fundamentals remain strong. It went through a long and deep consolidation below its 200 DMA line after dropped from the Featured Stocks list on 1/15/16." The past 12 quarterly comparisons earnings increases versus the year ago periods were well above the +25% minimum guideline (C criteria). Its annual earnings history (A criteria) has been good, but it has a limited history since its Oct 2014 IPO at $13. VBTX went through a long consolidation since last shown in this FSU section on 1/05/16 with an annotated graph under the headline, "Met Resistance Due to Overhead Supply When Rebounding". Disciplined investors will note that it never produced the necessary gains above its pivot point backed by at least +40% above average volume needed to trigger a technical buy signal. It was highlighted in yellow with pivot point cited based on its 7/08/15 high plus 10 cents in the 11/04/15 mid-day report (read here). The number of top-rated funds owning its shares rose from 18 in Jun '15 to 107 in Dec '16. Its current Up/Down Volume Ratio of 2.9 is an unbiased indication its shares have been under accumulation over the past 50 days (I criteria). Its small supply of only 10.2 million shares (S criteria) in the public float can contribute to greater volatility in the event of institutional buying or selling. Charts courtesy www.stockcharts.com
 |
|
|
Color Codes Explained :
Y - Better candidates highlighted by our
staff of experts.
G - Previously featured
in past reports as yellow but may no longer be buyable under the
guidelines.
***Last / Change / Volume data in this table is the closing quote data***
Symbol/Exchange
Company Name
Industry Group |
PRICE |
CHANGE
(%Change) |
Day High |
Volume
(% DAV)
(% 50 day avg vol) |
52 Wk Hi
% From Hi |
Featured
Date |
Price
Featured |
Pivot Featured |
|
Max Buy |
CSFL
-
NASDAQ
Centerstate Banks Inc
Banks-Southeast
|
$24.93
|
+0.10
0.40% |
$24.97
|
235,171
74.90% of 50 DAV
50 DAV is 314,000
|
$25.83
-3.50%
|
10/10/2016
|
$18.20
|
PP = $18.37
|
|
MB = $19.29
|
Most Recent Note - 1/17/2017 2:33:38 PM
G - Completed a new Public Offering of shares on 1/10/17 during its orderly consolidation perched near all-time highs. Its 50 DMA line ($23.38) defines near-term support above prior highs in the $19 area.
>>> FEATURED STOCK ARTICLE : Bank Stock Perched Near Record Highs After Considerable Rally - 1/4/2017 |
View all notes |
Set NEW NOTE alert |
Company Profile |
SEC
News |
Chart |
Request a new note
C
A
S
I |
IESC
-
NASDAQ
I E S Holdings Inc
Bldg-Maintenance and Svc
|
$18.90
|
+0.25
1.34% |
$18.95
|
29,168
32.41% of 50 DAV
50 DAV is 90,000
|
$23.00
-17.83%
|
11/23/2016
|
$19.35
|
PP = $18.26
|
|
MB = $19.17
|
Most Recent Note - 1/19/2017 5:44:52 PM
G - Remains below its 50 DMA line testing prior highs. More damaging losses would trigger a worrisome technical sell signal. A rebound above the 50 DMA line ($19.22) would help its outlook improve. See the latest FSU analysis for more details and a new annotated graph.
>>> FEATURED STOCK ARTICLE : Violated 50-Day Moving Average Line and Now Testing Prior Highs - 1/19/2017 |
View all notes |
Set NEW NOTE alert |
Company Profile |
SEC
News |
Chart |
Request a new note
C
A
S
I |
BERY
-
NYSE
Berry Plastics Group Inc
CONSUMER NON-DURABLES - Packaging and Containers
|
$51.67
|
+0.65
1.27% |
$51.73
|
831,191
63.21% of 50 DAV
50 DAV is 1,315,000
|
$51.75
-0.15%
|
11/30/2016
|
$50.26
|
PP = $46.47
|
|
MB = $48.79
|
Most Recent Note - 1/18/2017 6:06:35 PM
G - Posted a gain with near average volume today for its best-ever close. Consolidating in an orderly fashion with volume totals cooling since its 11/29/16 breakout. Insider buying reported in recent weeks is a reassuring sign. Its 50 DMA line ($48.66) defines support to watch above prior highs in the $46 area.
>>> FEATURED STOCK ARTICLE : Orderly Consolidation Continues Well Above Support - 1/3/2017 |
View all notes |
Set NEW NOTE alert |
Company Profile |
SEC
News |
Chart |
Request a new note
C
A
S
I |
EVR
-
NYSE
Evercore Partners Inc
FINANCIAL SERVICES - Investment Banking
|
$74.05
|
+1.15
1.58% |
$74.05
|
344,337
76.86% of 50 DAV
50 DAV is 448,000
|
$74.10
-0.07%
|
1/5/2017
|
$71.40
|
PP = $72.07
|
|
MB = $75.67
|
 Most Recent Note - 1/23/2017 5:48:01 PM
Y - Wedged higher with today's gain lacking great volume conviction. Its 50 DMA line ($68.95) defines support above prior highs. Concerns remain because volume behind all gains has been light since a new pivot point was cited based on its 12/08/16 high plus 10 cents - "Gains above a pivot point must have a minimum of +40% above average volume to trigger a proper new (or add-on) technical buy signal.)
>>> FEATURED STOCK ARTICLE : Perched Near All-Time High Building New Flat Base - 1/5/2017 |
View all notes |
Set NEW NOTE alert |
Company Profile |
SEC
News |
Chart |
Request a new note
C
A
S
I |
HTHT
-
NASDAQ
China Lodging Group Ads
LEISURE - Lodging
|
$50.42
|
+0.00
0.00% |
$51.05
|
112,219
63.40% of 50 DAV
50 DAV is 177,000
|
$54.23
-7.03%
|
9/29/2016
|
$46.12
|
PP = $47.82
|
|
MB = $50.21
|
Most Recent Note - 1/18/2017 6:01:14 PM
G - Consolidating above support at its 50 DMA line ($48.82). The prior low ($45.61 on 12/20/16) defines the next important near-term support level. Repeatedly noted with caution in prior reports - "Reported earnings +10% on +6% sales revenues for the Sep '16 quarter, below the +25% minimum earnings guideline (C criteria), raising concerns." See the latest FSU analysis for more details and a new annotated graph.
>>> FEATURED STOCK ARTICLE : Slump Below "Max Buy" Level But Fundamental Concerns Were Raised - 1/6/2017 |
View all notes |
Set NEW NOTE alert |
Company Profile |
SEC
News |
Chart |
Request a new note
C
A
S
I |
Symbol/Exchange
Company Name
Industry Group |
PRICE |
CHANGE
(%Change) |
Day High |
Volume
(% DAV)
(% 50 day avg vol) |
52 Wk Hi
% From Hi |
Featured
Date |
Price
Featured |
Pivot Featured |
|
Max Buy |
DW
-
NYSE
LCI Industries
MATERIALS and CONSTRUCTION - General Building Materials
|
$107.95
|
+1.90
1.79% |
$108.10
|
188,221
98.49% of 50 DAV
50 DAV is 191,100
|
$116.50
-7.34%
|
11/29/2016
|
$106.29
|
PP = $101.00
|
|
MB = $106.05
|
Most Recent Note - 1/23/2017 5:43:17 PM
G - Found support at its 50 DMA line ($106.10) and posted a gain today with average volume. Prior highs in the $103 area define the next important support level below its 50 DMA line. Subsequent violations may trigger technical sell signals. Drew Industries (DW) announced a new name LCI Industries (LCII) and new trading symbol effective as of the market open on January 3, 2017.
>>> FEATURED STOCK ARTICLE : Consolidating Well Above Prior Highs and 50-Day Moving Average - 12/30/2016 |
View all notes |
Set NEW NOTE alert |
Company Profile |
SEC
News |
Chart |
Request a new note
C
A
S
I |
LMAT
-
NASDAQ
Lemaitre Vascular Inc
Medical-Products
|
$23.26
|
-0.08
-0.34% |
$23.56
|
58,493
40.34% of 50 DAV
50 DAV is 145,000
|
$27.04
-13.97%
|
12/22/2016
|
$24.99
|
PP = $25.09
|
|
MB = $26.34
|
Most Recent Note - 1/19/2017 5:41:08 PM
G - Slumped below its 50 DMA line with a 6th consecutive loss today raising concerns and triggering a technical sell signal. Color code is changed to green. Only a prompt rebound above its 50 DMA line ($23.93) would help its outlook improve.
>>> FEATURED STOCK ARTICLE : Built an Orderly Base-On-Base Pattern - 12/23/2016 |
View all notes |
Set NEW NOTE alert |
Company Profile |
SEC
News |
Chart |
Request a new note
C
A
S
I |
BEAT
-
NASDAQ
BioTelemetry Inc
Medical-Services
|
$22.05
|
+0.15
0.68% |
$22.15
|
193,604
67.46% of 50 DAV
50 DAV is 287,000
|
$24.10
-8.51%
|
12/19/2016
|
$22.91
|
PP = $21.78
|
|
MB = $22.87
|
Most Recent Note - 1/20/2017 5:25:33 PM
Y - Quietly consolidating near prior highs in the $21-22 area which define initial support to watch above its 50 DMA line ($20.84). More damaging losses leading to violations may trigger technical sell signals.
>>> FEATURED STOCK ARTICLE : Volume Totals Cooling While Consolidating Above Prior Highs - 1/10/2017 |
View all notes |
Set NEW NOTE alert |
Company Profile |
SEC
News |
Chart |
Request a new note
C
A
S
I |
PATK
-
NASDAQ
Patrick Industries Inc
WHOLESALE - Building Materials Wholesale
|
$78.25
|
+0.05
0.06% |
$79.04
|
98,286
79.26% of 50 DAV
50 DAV is 124,000
|
$81.65
-4.16%
|
11/29/2016
|
$72.45
|
PP = $69.63
|
|
MB = $73.11
|
Most Recent Note - 1/19/2017 5:38:37 PM
G - Pulling back from all-time highs after getting extended from its prior base. Prior highs in the $69 area and its 50 DMA line ($72.60) define support to watch on pullbacks.
>>> FEATURED STOCK ARTICLE : Stubbornly Held Ground and Rose Since Featured Again - 12/28/2016 |
View all notes |
Set NEW NOTE alert |
Company Profile |
SEC
News |
Chart |
Request a new note
C
A
S
I |
ANET
-
NYSE
"Arista Networks, Inc"
TELECOMMUNICATIONS - Communication Equipment
|
$89.67
|
-0.13
-0.14% |
$89.88
|
734,987
89.52% of 50 DAV
50 DAV is 821,000
|
$103.00
-12.94%
|
12/30/2016
|
$96.77
|
PP = $99.00
|
|
MB = $103.95
|
Most Recent Note - 1/18/2017 6:00:17 PM
G - Halted its slide today after a damaging gap down on the prior session violated its 50 DMA line triggering a technical sell signal. A prompt rebound above its 50 DMA line ($94.25) is needed for its outlook to improve. See the latest FSU analysis for more details and a new annotated graph.
>>> FEATURED STOCK ARTICLE : Technical Damages Raised Concern and Triggered Technical Sell Signal - 1/18/2017 |
View all notes |
Set NEW NOTE alert |
Company Profile |
SEC
News |
Chart |
Request a new note
C
A
S
I |
Symbol/Exchange
Company Name
Industry Group |
PRICE |
CHANGE
(%Change) |
Day High |
Volume
(% DAV)
(% 50 day avg vol) |
52 Wk Hi
% From Hi |
Featured
Date |
Price
Featured |
Pivot Featured |
|
Max Buy |
VBTX
-
NASDAQ
Veritex Holdings Inc
BANKING - Regional - Southwest Banks
|
$26.50
|
+0.08
0.30% |
$27.57
|
114,285
160.96% of 50 DAV
50 DAV is 71,000
|
$27.77
-4.56%
|
1/23/2017
|
$27.30
|
PP = $27.87
|
|
MB = $29.26
|
Most Recent Note - 1/23/2017 5:39:43 PM
Y - Finished weak today after highlighted in yellow with new pivot point cited based on its 12/23/16 high plus 10 cents. Challenged its all-time high after a short flat base. A gain above the pivot point backed by at least +40% above average volume is needed to trigger a proper technical buy signal. Due to report Dec '16 quarterly earnings prior to Tuesday's open, and volume and volatility often increase near earnings news. Completed a new Public Offering on 12/15/16 and was noted in prior mid-day reports - "Patient investors may watch for a new base or secondary buy point to possibly develop and be noted in the weeks ahead. Reported earnings +35% on +32% sales revenues for the Sep '16 quarter, and its fundamentals remain strong. See the latest FSU analysis for more details and a new annotated graph.
>>> FEATURED STOCK ARTICLE : Challenged Highs But Ended in Bottom Third of Intra-day Range - 1/23/2017 |
View all notes |
Set NEW NOTE alert |
Company Profile |
SEC
News |
Chart |
Request a new note
C
A
S
I |
SFBS
-
NASDAQ
Servisfirst Bancshares
BANKING - Regional - Southeast Banks
|
$37.29
|
+0.07
0.19% |
$37.60
|
72,200
24.64% of 50 DAV
50 DAV is 293,000
|
$38.65
-3.52%
|
7/19/2016
|
$26.64
|
PP = $26.41
|
|
MB = $27.73
|
Most Recent Note - 1/17/2017 2:37:47 PM
G - Consolidating near its high. Recent low and its 50 DMA line define important near-term support in the $35 area where subsequent violations would raise concerns.
>>> FEATURED STOCK ARTICLE : Stubbornly Holding Ground Near Highs - 1/12/2017 |
View all notes |
Set NEW NOTE alert |
Company Profile |
SEC
News |
Chart |
Request a new note
C
A
S
I |
|
|
|
THESE ARE NOT BUY RECOMMENDATIONS!
Comments contained in the body of this report are technical
opinions only. The material herein has been obtained
from sources believed to be reliable and accurate, however,
its accuracy and completeness cannot be guaranteed.
This site is not an investment advisor, hence it does
not endorse or recommend any securities or other investments.
Any recommendation contained in this report may not
be suitable for all investors and it is not to be deemed
an offer or solicitation on our part with respect to
the purchase or sale of any securities. All trademarks,
service marks and trade names appearing in this report
are the property of their respective owners, and are
likewise used for identification purposes only.
This report is a service available
only to active Paid Premium Members.
You may opt-out of receiving report notifications
at any time. Questions or comments may be submitted
by writing to Premium Membership Services 665 S.E. 10 Street, Suite 201 Deerfield Beach, FL 33441-5634 or by calling 1-800-965-8307
or 954-785-1121.
|
|
|