You are not logged in.
This means you
CAN ONLY VIEW reports that were published prior to Saturday, March 29, 2025.
You
MUST UPGRADE YOUR MEMBERSHIP if you want to see any current reports.
AFTER MARKET UPDATE - THURSDAY, JANUARY 5TH, 2017
Previous After Market Report Next After Market Report >>>
|
|
|
|
DOW |
-42.87 |
19,899.29 |
-0.21% |
|
Volume |
1,140,977,000 |
-4% |
|
Volume |
1,617,486,270 |
-6% |
|
NASDAQ |
+10.94 |
5,487.94 |
+0.20% |
|
Advancers |
1,292 |
44% |
|
Advancers |
1,289 |
42% |
|
S&P 500 |
-1.75 |
2,269.00 |
-0.08% |
|
Decliners |
1,638 |
56% |
|
Decliners |
1,779 |
58% |
|
Russell 2000 |
-16.02 |
1,371.94 |
-1.15% |
|
52 Wk Highs |
127 |
|
|
52 Wk Highs |
117 |
|
|
S&P 600 |
-12.33 |
845.04 |
-1.44% |
|
52 Wk Lows |
8 |
|
|
52 Wk Lows |
17 |
|
|
 |
Major Indices Fell Slightly With Less Volume and Less Leadership
Kenneth J. Gruneisen - Passed the CAN SLIM® Master's Exam
Stocks finished mostly lower on Thursday. The Dow was down 42 points to 19899. The S&P 500 lost 1 point to 2269 and the Nasdaq Composite gained 10 points to 5487. Volume totals were lighter than the prior session totals on the NYSE and on the Nasdaq exchange. Decliners led advancers by a 4-3 margin on the NYSE and 3-2 on the Nasdaq exchange. Leadership thinned as there were 26 high-ranked companies from the Leaders List that made new 52-week highs and were listed on the BreakOuts Page, versus the total of 60 on the prior session. New 52-week highs totals contracted yet still easily outnumbered new 52-week lows on both the NYSE and the Nasdaq exchange and the new lows total on the NYSE was in the single digits again.
PICTURED: The Dow Jones Industrial Average has been holding its ground near record highs.
Near record high territory, the major averages (M criteria) are in a confirmed uptrend. New buying efforts should only be made in candidates with superior fundamental and technical characteristics. The Featured Stocks Page lists noteworthy high-ranked leaders.
The major averages fluctuated throughout the session as U.S. Treasuries advanced and investors digested mixed economic releases. On the data front, an ADP report showed that 153,000 workers were added to private payrolls in December, below estimates of 175,000. In a separate release, Markit’s survey of U.S. business activity expanded to 53.9 in December. Finally, initial jobless claims came in at 235,000, below the expected 260,000.
Six of 11 sectors in the S&P 500 finished in negative territory. Financials led the losses with Citigroup (C -1.74%) ending lower. In the consumer space, Macy’s (M -13.9%) slid after the department store operator announced disappointing holiday sales and a plan to likely cut 6,200 workers. Kohl’s (KSS -19.02%) tumbled as the retailer slashed its full-year earnings guidance. In M&A news, CEB Inc. (CEB +20.92%) rose after agreeing to a $2.6 billion takeover bid from Gartner, Inc. (IT -11.03%) Shares of Chipotle Mexican Grill (CMG +2.63%) rose after being the subject of positive analyst commentary.
Treasuries finished higher with the benchmark 10-year note up 23/32 to yield 2.35%. In commodities, NYMEX WTI crude added 0.8% to $53.66/barrel. COMEX gold gained 1.4% to $1181.70/ounce. In FOREX, the Dollar Index tumbled 1.3%. |
 Kenneth J. Gruneisen started out as a licensed stockbroker in August 1987, a couple of months prior to the historic stock market crash that took the Dow Jones Industrial Average down -22.6% in a single day. He has published daily fact-based fundamental and technical analysis on high-ranked stocks online for two decades. Through FACTBASEDINVESTING.COM, Kenneth provides educational articles, news, market commentary, and other information regarding proven investment systems that work in good times and bad.
Comments contained in the body of this report are technical opinions only and are not necessarily those of Gruneisen Growth Corp. The material herein has been obtained from sources believed to be reliable and accurate, however, its accuracy and completeness cannot be guaranteed. Our firm, employees, and customers may effect transactions, including transactions contrary to any recommendation herein, or have positions in the securities mentioned herein or options with respect thereto. Any recommendation contained in this report may not be suitable for all investors and it is not to be deemed an offer or solicitation on our part with respect to the purchase or sale of any securities. |
|
 |
Tech and Financials Fell as Gold & Silver Index Posted Standout Gain
Kenneth J. Gruneisen - Passed the CAN SLIM® Master's Exam
The Broker/Dealer Index ($XBD -0.57%) and Bank Index ($BKX -1.41%) both pulled back while the Retail Index ($RLX -0.03%) finished flat on Thursday's session. The Biotechnology Index ($BTK +0.01%) held its ground while the the tech sector wad dragged lower by the Networking Index ($NWX -1.07%) and the Semiconductor Index ($SOX -0.89%). Commodity-linked groups were led by a big gain in the Gold & Silver Index ($XAU +5.45%) while the Oil Services Index ($OSX +0.55%) and the Integrated Oil Index ($XOI +0.29%) both sputtered higher. Charts courtesy www.stockcharts.com
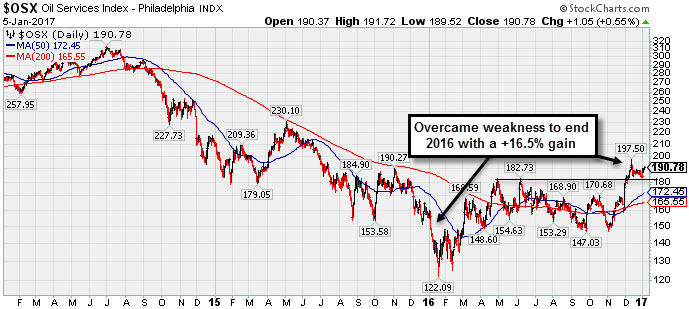 PICTURED: The 3-year Oil Services Index ($OSX +0.55%) chart illustrates how it overcame a weak start last year and ultimately finished with a +16.5% gain for 2016.
| Oil Services |
$OSX |
190.78 |
+1.04 |
+0.55% |
+3.80% |
| Integrated Oil |
$XOI |
1,285.11 |
+3.66 |
+0.29% |
+1.35% |
| Semiconductor |
$SOX |
901.69 |
-8.08 |
-0.89% |
-0.53% |
| Networking |
$NWX |
448.97 |
-4.84 |
-1.07% |
+0.64% |
| Broker/Dealer |
$XBD |
211.96 |
-1.21 |
-0.57% |
+3.26% |
| Retail |
$RLX |
1,364.49 |
-0.42 |
-0.03% |
+1.60% |
| Gold & Silver |
$XAU |
87.93 |
+4.54 |
+5.44% |
+11.50% |
| Bank |
$BKX |
92.39 |
-1.32 |
-1.41% |
+0.65% |
| Biotech |
$BTK |
3,234.40 |
+0.18 |
+0.01% |
+5.18% |
|
|
|
 |
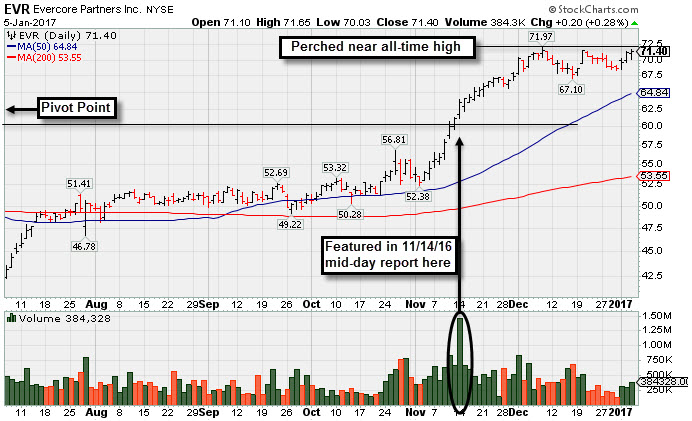
Perched Near All-Time High Building New Flat Base
Kenneth J. Gruneisen - Passed the CAN SLIM® Master's Exam
Evercore Partners Inc (EVR +$0.20 or +0.28% to $71.40) ended 15 cents off its best-ever close with today's 3rd consecutive gain with light volume, while building on a new flat base. Its color code is changed to yellow with new point cited based on its 12/08/16 high plus 10 cents. A volume-driven gain for new highs may trigger a new (or add-on) technical buy signal.
Its 50-day moving average (DMA) line ($64.96) defines important near-term support above prior highs. It was last shown in this FSU section on 12/05/16 with an annotated graph under the headline, "Hit Another New High Today With Volume-Driven Gain". Insider buying was reported in recent weeks, a reassuring sign, as EVR rallied +12.8% since featured in the 11/14/16 mid-day report highlighted in yellow with pivot point based on its 11/06/15 high plus 10 cents (read here).
The high-ranked Finance - Investment Banks/Brokers firm provides advisory services to multinational corporations on mergers, acquistions, divestitures and restructurings. EVR reported earnings +51% on +25% sales revenues for the Sep '16 quarter. Three of the past 4 earnings increases were above the +25% minimum guideline (C criteria). Its annual earnings (A criteria) history has been strong and steady.
The number of top-rated funds owning its shares fell from 406 in Dec '15 to 390 in Sep '16, a less than reassuring sign concerning the I criteria. However, its current Up/Down Volume Ratio of 2.4 is an unbiased indication its shares have been under accumulation over the past 50 days. It has an A Timeliness rating and a B sponsorship Rating. Its small supply of only 38.9 million shares outstanding (S criteria) can contribute to greater price volatility in the event of institutional buying or selling.
|
|
|
Color Codes Explained :
Y - Better candidates highlighted by our
staff of experts.
G - Previously featured
in past reports as yellow but may no longer be buyable under the
guidelines.
***Last / Change / Volume data in this table is the closing quote data***
Symbol/Exchange
Company Name
Industry Group |
PRICE |
CHANGE
(%Change) |
Day High |
Volume
(% DAV)
(% 50 day avg vol) |
52 Wk Hi
% From Hi |
Featured
Date |
Price
Featured |
Pivot Featured |
|
Max Buy |
CSFL
-
NASDAQ
Centerstate Banks Inc
Banks-Southeast
|
$25.07
|
-0.21
-0.83% |
$25.53
|
165,054
62.05% of 50 DAV
50 DAV is 266,000
|
$25.83
-2.96%
|
10/10/2016
|
$18.20
|
PP = $18.37
|
|
MB = $19.29
|
Most Recent Note - 1/4/2017 5:52:25 PM
G - Stubbornly holding its ground near all-time highs, very extended from any sound base. Its 50 DMA line $22 defines near-term support above prior highs in the $19 area. See the latest FSU analysis for more details and a new annotated graph.
>>> FEATURED STOCK ARTICLE : Bank Stock Perched Near Record Highs After Considerable Rally - 1/4/2017 |
View all notes |
Set NEW NOTE alert |
Company Profile |
SEC
News |
Chart |
Request a new note
C
A
S
I |
IESC
-
NASDAQ
I E S Holdings Inc
Bldg-Maintenance and Svc
|
$19.50
|
-0.80
-3.94% |
$20.55
|
53,711
55.95% of 50 DAV
50 DAV is 96,000
|
$23.00
-15.22%
|
11/23/2016
|
$19.35
|
PP = $18.26
|
|
MB = $19.17
|
 Most Recent Note - 1/5/2017 5:46:30 PM
G - Still quietly consolidating above prior highs and its 50 DMA line which coincide in the $18 area defining important near-term support to watch.
>>> FEATURED STOCK ARTICLE : Consolidating After Strong Sep '16 Quarterly Earnings News - 12/21/2016 |
View all notes |
Set NEW NOTE alert |
Company Profile |
SEC
News |
Chart |
Request a new note
C
A
S
I |
BERY
-
NYSE
Berry Plastics Group Inc
CONSUMER NON-DURABLES - Packaging and Containers
|
$49.83
|
-0.37
-0.74% |
$50.41
|
727,746
50.05% of 50 DAV
50 DAV is 1,454,000
|
$51.68
-3.58%
|
11/30/2016
|
$50.26
|
PP = $46.47
|
|
MB = $48.79
|
Most Recent Note - 1/3/2017 5:27:54 PM
G - Posted a gain today with volume picking up to near average, still consolidating above its "max buy" level with volume totals generally cooling since its breakout. Prior highs in the $46 area and its 50 DMA line ($47.37) define support to watch on pullbacks. See the latest FSU analysis for additional details and a new annontated graph.
>>> FEATURED STOCK ARTICLE : Orderly Consolidation Continues Well Above Support - 1/3/2017 |
View all notes |
Set NEW NOTE alert |
Company Profile |
SEC
News |
Chart |
Request a new note
C
A
S
I |
EVR
-
NYSE
Evercore Partners Inc
FINANCIAL SERVICES - Investment Banking
|
$71.40
|
+0.20
0.28% |
$71.65
|
384,328
80.24% of 50 DAV
50 DAV is 479,000
|
$71.97
-0.79%
|
1/5/2017
|
$71.40
|
PP = $72.07
|
|
MB = $75.67
|
Most Recent Note - 1/5/2017 6:14:52 PM
Y - Color code is changed to yellow with new pivot point cited based on its 12/08/16 high plus 10 cents. Subsequent volume-driven gains for new highs may trigger a new (or add-on) technical buy signal. Its 50 DMA line ($64.96) defines important support above prior highs. See the latest FSU analysis for additional details and a new annotated graph.
>>> FEATURED STOCK ARTICLE : Perched Near All-Time High Building New Flat Base - 1/5/2017 |
View all notes |
Set NEW NOTE alert |
Company Profile |
SEC
News |
Chart |
Request a new note
C
A
S
I |
HTHT
-
NASDAQ
China Lodging Group Ads
LEISURE - Lodging
|
$49.22
|
+0.03
0.06% |
$49.61
|
136,862
73.19% of 50 DAV
50 DAV is 187,000
|
$54.23
-9.24%
|
9/29/2016
|
$46.12
|
PP = $47.82
|
|
MB = $50.21
|
Most Recent Note - 1/4/2017 5:58:15 PM
G - Pulled back today with lighter volume. Its 50 DMA line ($47.74) and prior low ($45.61 on 12/20/16) define important near-term support levels to watch on pullbacks. Repeatedly noted with caution in prior reports - "Reported earnings +10% on +6% sales revenues for the Sep '16 quarter, below the +25% minimum earnings guideline (C criteria), raising concerns."
>>> FEATURED STOCK ARTICLE : Mostly Bullish Action Continues to Bode Well for China Lodging - 12/9/2016 |
View all notes |
Set NEW NOTE alert |
Company Profile |
SEC
News |
Chart |
Request a new note
C
A
S
I |
Symbol/Exchange
Company Name
Industry Group |
PRICE |
CHANGE
(%Change) |
Day High |
Volume
(% DAV)
(% 50 day avg vol) |
52 Wk Hi
% From Hi |
Featured
Date |
Price
Featured |
Pivot Featured |
|
Max Buy |
DW
-
NYSE
LCI Industries
MATERIALS and CONSTRUCTION - General Building Materials
|
$108.60
|
-0.50
-0.46% |
$110.53
|
141,836
60.72% of 50 DAV
50 DAV is 233,600
|
$116.50
-6.78%
|
11/29/2016
|
$106.29
|
PP = $101.00
|
|
MB = $106.05
|
Most Recent Note - 1/4/2017 10:32:15 AM
G - Pulling back today from new all-time highs hit on the prior session. Drew Industries (DW) announced a new name LCI Indusries (LCII) and new trading symbol effective as of the market open on January 3, 2017. Prior highs in the $101-103 area define support to watch above its 50 DMA line. See the latest FSU analysis for more details and an annotated graph.
>>> FEATURED STOCK ARTICLE : Consolidating Well Above Prior Highs and 50-Day Moving Average - 12/30/2016 |
View all notes |
Set NEW NOTE alert |
Company Profile |
SEC
News |
Chart |
Request a new note
C
A
S
I |
LMAT
-
NASDAQ
Lemaitre Vascular Inc
Medical-Products
|
$25.09
|
-0.11
-0.44% |
$25.43
|
110,445
72.19% of 50 DAV
50 DAV is 153,000
|
$25.87
-3.02%
|
12/22/2016
|
$24.99
|
PP = $25.09
|
|
MB = $26.34
|
Most Recent Note - 1/3/2017 5:33:45 PM
Y - Hovering near its high after wedging higher with recent gains lacking great volume conviction. New pivot point was cited based on its 11/17/16 high plus 10 cents after an orderly base-on-base pattern. A volume-driven gain and strong close above the pivot point may clinch a new (or add-on) technical buy signal. Recent lows in the $22 area and its 50 DMA line ($22.95) coincide defining important support to watch on pullbacks.
>>> FEATURED STOCK ARTICLE : Built an Orderly Base-On-Base Pattern - 12/23/2016 |
View all notes |
Set NEW NOTE alert |
Company Profile |
SEC
News |
Chart |
Request a new note
C
A
S
I |
BEAT
-
NASDAQ
BioTelemetry Inc
Medical-Services
|
$22.75
|
-0.30
-1.30% |
$23.18
|
173,560
53.90% of 50 DAV
50 DAV is 322,000
|
$24.10
-5.60%
|
12/19/2016
|
$22.91
|
PP = $21.78
|
|
MB = $22.87
|
Most Recent Note - 1/4/2017 5:57:00 PM
G - Posted a gain with average volume and its color code is changed to green after rising above its "max buy" level again. Prior highs in the $21-22 area define initial support to watch on pullbacks.
>>> FEATURED STOCK ARTICLE : Breakaway Gap Technically Clears 11-Week V Shaped Base - 12/19/2016 |
View all notes |
Set NEW NOTE alert |
Company Profile |
SEC
News |
Chart |
Request a new note
C
A
S
I |
PATK
-
NASDAQ
Patrick Industries Inc
WHOLESALE - Building Materials Wholesale
|
$79.65
|
-0.40
-0.50% |
$80.20
|
160,414
131.49% of 50 DAV
50 DAV is 122,000
|
$80.50
-1.06%
|
11/29/2016
|
$72.45
|
PP = $69.63
|
|
MB = $73.11
|
Most Recent Note - 1/4/2017 12:48:51 PM
G - Touched a new all-time high today. It has been stubbornly holding its ground, extended from its prior base. Prior highs in the $69 area and its 50 DMA line ($67.97) define support to watch on pullbacks.
>>> FEATURED STOCK ARTICLE : Stubbornly Held Ground and Rose Since Featured Again - 12/28/2016 |
View all notes |
Set NEW NOTE alert |
Company Profile |
SEC
News |
Chart |
Request a new note
C
A
S
I |
ANET
-
NYSE
Arista Networks Inc
TELECOMMUNICATIONS - Communication Equipment
|
$101.94
|
+0.21
0.21% |
$103.00
|
977,256
127.58% of 50 DAV
50 DAV is 766,000
|
$102.28
-0.33%
|
12/30/2016
|
$96.77
|
PP = $99.00
|
|
MB = $103.95
|
Most Recent Note - 1/4/2017 12:27:20 PM
Y - Volume is running at an above average pace today while rallying from the previously noted advanced "3-weeks tight" base pattern hitting new all-time highs. On 12/30/16 it was last noted -"Subsequent volume-driven gains above the new pivot point cited may trigger a new (or add-on) technical buy signal. Its 50 DMA line and prior lows in the $91 area define important support to watch on pullbacks."
>>> FEATURED STOCK ARTICLE : Holding Ground After Rally More Than 5% Beyond Prior Highs - 12/20/2016 |
View all notes |
Set NEW NOTE alert |
Company Profile |
SEC
News |
Chart |
Request a new note
C
A
S
I |
Symbol/Exchange
Company Name
Industry Group |
PRICE |
CHANGE
(%Change) |
Day High |
Volume
(% DAV)
(% 50 day avg vol) |
52 Wk Hi
% From Hi |
Featured
Date |
Price
Featured |
Pivot Featured |
|
Max Buy |
SFBS
-
NASDAQ
Servisfirst Bancshares
BANKING - Regional - Southeast Banks
|
$37.56
|
-1.00
-2.59% |
$38.46
|
132,601
45.57% of 50 DAV
50 DAV is 291,000
|
$38.65
-2.82%
|
7/19/2016
|
$26.64
|
PP = $26.41
|
|
MB = $27.73
|
Most Recent Note - 1/3/2017 5:25:27 PM
G - Still holding its ground near all-time highs, extended from its prior base. Its 50 DMA line ($33.32) defines important support to watch on pullbacks. Do not be confused by 2-1 stock split effective 12/21/16 so the Featured Price, Pivot Point and Max Buy levels were adjusted accordingly
>>> FEATURED STOCK ARTICLE : Financial Firm Remains Extended Well Above Prior Highs - 12/14/2016 |
View all notes |
Set NEW NOTE alert |
Company Profile |
SEC
News |
Chart |
Request a new note
C
A
S
I |
OLLI
-
NASDAQ
"Ollies Bargain Outlet Holdings, Inc"
Retail-DiscountandVariety
|
$28.30
|
-1.10
-3.74% |
$29.00
|
796,003
119.20% of 50 DAV
50 DAV is 667,800
|
$32.75
-13.59%
|
10/4/2016
|
$27.36
|
PP = $28.70
|
|
MB = $30.14
|
Most Recent Note - 1/5/2017 5:45:20 PM
Met resistance near its 50 DMA line ($29.41) and slumped further today with slightly higher volume. Its Relative Strength rating has dropped to 72, below the 80+ guideline for buy candidates. More damaging losses would raise even greater concerns. A rebound above the 50 DMA line is needed for its outlook to improve. It will be dropped from the Featured Stocks list tonight.
>>> FEATURED STOCK ARTICLE : Distributional Action Plus Slump Below 50-Day Moving Average - 12/29/2016 |
View all notes |
Set NEW NOTE alert |
Company Profile |
SEC
News |
Chart |
Request a new note
C
A
S
I |
LITE
-
NASDAQ
Lumentum Holdings Inc
TELECOMMUNICATIONS - Cables / Satalite Equipment
|
$36.80
|
-0.80
-2.13% |
$37.60
|
578,413
56.82% of 50 DAV
50 DAV is 1,018,000
|
$45.25
-18.67%
|
12/8/2016
|
$42.80
|
PP = $45.35
|
|
MB = $47.62
|
Most Recent Note - 1/5/2017 5:50:12 PM
Slumped further below its 50 DMA line ($39.03) today raising concerns. Only a prompt rebound above the 50 DMA line would help its outlook improve. Its Relative Strength rating has dropped to 81. It will be dropped from the Featured Stocks list tonight.
>>> FEATURED STOCK ARTICLE : Challenging its High With Big Volume-Driven Gain - 12/8/2016 |
View all notes |
Set NEW NOTE alert |
Company Profile |
SEC
News |
Chart |
Request a new note
C
A
S
I |
|
|
|
THESE ARE NOT BUY RECOMMENDATIONS!
Comments contained in the body of this report are technical
opinions only. The material herein has been obtained
from sources believed to be reliable and accurate, however,
its accuracy and completeness cannot be guaranteed.
This site is not an investment advisor, hence it does
not endorse or recommend any securities or other investments.
Any recommendation contained in this report may not
be suitable for all investors and it is not to be deemed
an offer or solicitation on our part with respect to
the purchase or sale of any securities. All trademarks,
service marks and trade names appearing in this report
are the property of their respective owners, and are
likewise used for identification purposes only.
This report is a service available
only to active Paid Premium Members.
You may opt-out of receiving report notifications
at any time. Questions or comments may be submitted
by writing to Premium Membership Services 665 S.E. 10 Street, Suite 201 Deerfield Beach, FL 33441-5634 or by calling 1-800-965-8307
or 954-785-1121.
|
|
|