You are not logged in.
This means you
CAN ONLY VIEW reports that were published prior to Saturday, March 29, 2025.
You
MUST UPGRADE YOUR MEMBERSHIP if you want to see any current reports.
AFTER MARKET UPDATE - THURSDAY, JANUARY 12TH, 2017
Previous After Market Report Next After Market Report >>>
|
|
|
|
DOW |
-63.28 |
19,891.00 |
-0.32% |
|
Volume |
916,990,800 |
-14% |
|
Volume |
1,667,351,640 |
-6% |
|
NASDAQ |
-16.16 |
5,547.49 |
-0.29% |
|
Advancers |
1,147 |
39% |
|
Advancers |
978 |
32% |
|
S&P 500 |
-4.88 |
2,270.44 |
-0.21% |
|
Decliners |
1,765 |
61% |
|
Decliners |
2,041 |
68% |
|
Russell 2000 |
-12.23 |
1,361.07 |
-0.89% |
|
52 Wk Highs |
77 |
|
|
52 Wk Highs |
85 |
|
|
S&P 600 |
-9.78 |
833.29 |
-1.16% |
|
52 Wk Lows |
17 |
|
|
52 Wk Lows |
25 |
|
|
 |
Indices Finished Above Early Lows With Losses on Lighter Volume
Kenneth J. Gruneisen - Passed the CAN SLIM® Master's Exam
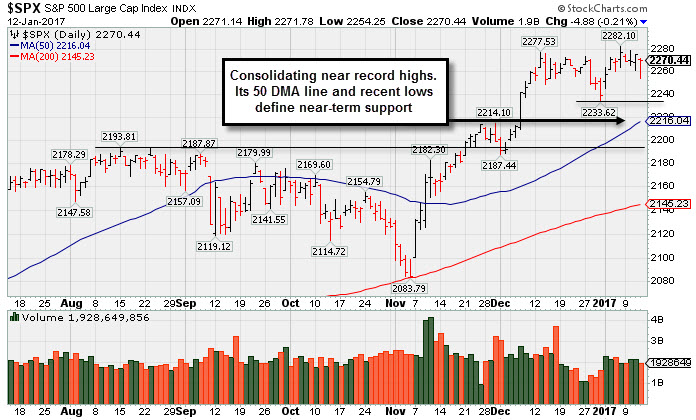
Stocks finished lower on Thursday, yet there was a great improvement from the session's early lows. The Dow was down 63 points to 19891. The S&P 500 lost 4 points to 2270 and the Nasdaq Composite fell 16 points to 5547. Volume totals were lighter than the prior session totals on the NYSE and on the Nasdaq exchange, also taking away some of the concerns of institutional selling or damaging "distribution". Breadth was negative as decliners led advancers by a 3-2 margin on the NYSE and by 2-1 on the Nasdaq exchange. Leadership waned as there were 13 high-ranked companies from the Leaders List that made new 52-week highs and were listed on the BreakOuts Page, half the total of 26 seen on the prior session. New 52-week highs contracted yet still easily outnumbered new 52-week lows on both the NYSE and the Nasdaq exchange.
PICTURED: The S&P 500 Index is perched near its record high. It is consolidating well above near-term support at recent lows and its 50-day moving average (DMA) line.
Near record high territory, the major averages (M criteria) are in a confirmed uptrend which has endured distributional pressure. New buying efforts should only be made in candidates with superior fundamental and technical characteristics. The Featured Stocks Page lists noteworthy high-ranked leaders.
The major averages declined on the session as Financials weighed amid increasing speculation on whether President-elect Donald Trump’s policies will spur economic growth. In his press conference on Wednesday, Trump failed to provide new details on his key policies of tax reform, deregulation and fiscal stimulus. On the data front, import prices rose 0.4% in December, below analyst estimates. In a separate release, initial jobless claims came in at 247,000, below the expected 255,000.
Seven of 11 sectors in the S&P 500 ended in negative territory. Financials led the losses with PNC Financial Services Group (PNC -2.80%) falling. Consumer Discretionary shares finished lower with Fiat Chrysler (FCAU -18.39%) tumbling after the Environmental Protection Agency accused the automaker of using software that allowed excess diesel emissions. In earnings, Delta Air Lines (DAL -1.07%) fell as the company warned of profit pressure from fuel costs and increased payroll. Shares of Merck & Co (MRK +0.94%) edged higher after being the subject of positive analyst commentary in reaction to its Keytruda adoption on Wednesday.
Treasuries finished higher with the benchmark 10-year note up 5/32 to yield 2.35%. In commodities, NYMEX WTI crude added 1.5% to $53.01/barrel. COMEX gold slipped 0.1% to $1195.60/ounce. In FOREX, the Dollar Index fell 0.4%. |
 Kenneth J. Gruneisen started out as a licensed stockbroker in August 1987, a couple of months prior to the historic stock market crash that took the Dow Jones Industrial Average down -22.6% in a single day. He has published daily fact-based fundamental and technical analysis on high-ranked stocks online for two decades. Through FACTBASEDINVESTING.COM, Kenneth provides educational articles, news, market commentary, and other information regarding proven investment systems that work in good times and bad.
Comments contained in the body of this report are technical opinions only and are not necessarily those of Gruneisen Growth Corp. The material herein has been obtained from sources believed to be reliable and accurate, however, its accuracy and completeness cannot be guaranteed. Our firm, employees, and customers may effect transactions, including transactions contrary to any recommendation herein, or have positions in the securities mentioned herein or options with respect thereto. Any recommendation contained in this report may not be suitable for all investors and it is not to be deemed an offer or solicitation on our part with respect to the purchase or sale of any securities. |
|
 |
Retail and Biotech Indexes Rose Amid Broader Group Weakness
Kenneth J. Gruneisen - Passed the CAN SLIM® Master's Exam
The Broker/Dealer Index ($XBD -0.95%) and Bank Index ($BKX -1.00%) both fell while the Retail Index ($RLX +0.49%) posted a gain on Thursday. The Biotechnology Index ($BTK +1.09%) rebounded somewhat from a large loss on the prior session, meanwhile the tech sector saw more weakness as the Networking Index ($NWX -0.71%) and the Semiconductor Index ($SOX -0.90%) both fell. The energy-linked Integrated Oil Index ($XOI -0.50%) and the Oil Services Index ($OSX -0.78%) both fell, outpacing the Gold & Silver Index ($XAU -0.21%) to the downside. Charts courtesy www.stockcharts.com
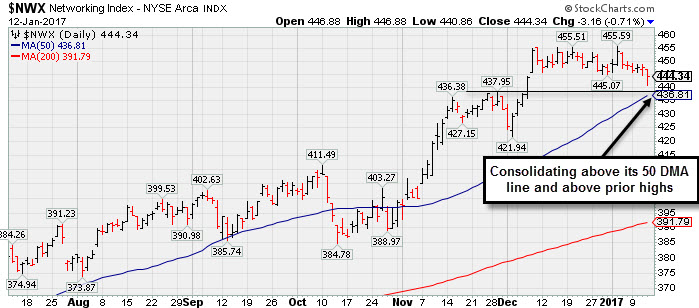 PICTURED: The Networking Index ($NWX -0.71%) is consolidating above its 50-day moving average (DMA) line and above prior highs.
| Oil Services |
$OSX |
188.13 |
-1.47 |
-0.78% |
+2.36% |
| Integrated Oil |
$XOI |
1,268.36 |
-6.39 |
-0.50% |
+0.03% |
| Semiconductor |
$SOX |
918.16 |
-8.38 |
-0.90% |
+1.29% |
| Networking |
$NWX |
444.34 |
-3.16 |
-0.71% |
-0.39% |
| Broker/Dealer |
$XBD |
212.39 |
-2.03 |
-0.95% |
+3.46% |
| Retail |
$RLX |
1,384.54 |
+6.75 |
+0.49% |
+3.09% |
| Gold & Silver |
$XAU |
86.22 |
-0.19 |
-0.22% |
+9.33% |
| Bank |
$BKX |
92.31 |
-0.94 |
-1.01% |
+0.57% |
| Biotech |
$BTK |
3,243.46 |
+35.06 |
+1.09% |
+5.48% |
|
|
|
 |
Stubbornly Holding Ground Near Highs
Kenneth J. Gruneisen - Passed the CAN SLIM® Master's Exam
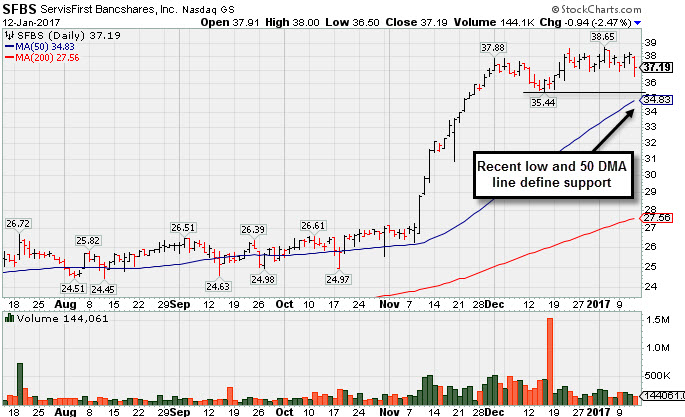
ServisFirst Bancshares Inc (SFBS -$0.94 or -2.47% to $37.19) has been stubbornly holding its ground in a tight range near all-time highs, extended from its prior base. Its 50-day moving average (DMA) line ($34.86) defines important support to watch on pullbacks.
Do not be confused by 2-1 stock split effective 12/21/16 so the Featured Price, Pivot Point and Max Buy levels were adjusted accordingly since it was last shown in this FSU section on 12/14/16 with an annotated graph under the headline, "Financial Firm Remains Extended Well Above Prior Highs". It got a burst of momentum along with many other Financial stocks following the election.
SFBS reported earnings +28% on +18% sales revenues for the Sep '16 quarter, its 4th consecutive quarterly comparison above the +25% minimum earnings guideline (C criteria), helping it match the fact-based investment system's guidelines. Earnings rose +28%, +34%, and +31% in the Dec '15, Mar and Jun '16 quarters, respectively, and underlying sales revenues growth has been in the +17-26% range. Its annual earnings (A criteria) history has been strong.
The number of top-rated funds owning its shares rose from 159 in Sep '15 to 232 in Sep '16, a reassuring sign concerning the I criteria. Its current Up/Down Volume Ratio of 1.4 is an unbiased indication its shares have been under accumulation over the past 50 days. Its small supply of only 23.1 million shares (S criteria) in the public float can contribute to greater price volatility in the event of institutional buying or selling. |
|
|
Color Codes Explained :
Y - Better candidates highlighted by our
staff of experts.
G - Previously featured
in past reports as yellow but may no longer be buyable under the
guidelines.
***Last / Change / Volume data in this table is the closing quote data***
Symbol/Exchange
Company Name
Industry Group |
PRICE |
CHANGE
(%Change) |
Day High |
Volume
(% DAV)
(% 50 day avg vol) |
52 Wk Hi
% From Hi |
Featured
Date |
Price
Featured |
Pivot Featured |
|
Max Buy |
CSFL
-
NASDAQ
Centerstate Banks Inc
Banks-Southeast
|
$24.83
|
-0.52
-2.05% |
$25.39
|
275,241
90.84% of 50 DAV
50 DAV is 303,000
|
$25.83
-3.89%
|
10/10/2016
|
$18.20
|
PP = $18.37
|
|
MB = $19.29
|
Most Recent Note - 1/11/2017 12:19:08 PM
G - Gapped down on the prior session after pricing a new Public Offering of shares. Volume totals had been cooling while holding its ground near all-time highs, extended from any sound base. Its 50 DMA line ($23.00) defines near-term support above prior highs in the $19 area.
>>> FEATURED STOCK ARTICLE : Bank Stock Perched Near Record Highs After Considerable Rally - 1/4/2017 |
View all notes |
Set NEW NOTE alert |
Company Profile |
SEC
News |
Chart |
Request a new note
C
A
S
I |
IESC
-
NASDAQ
I E S Holdings Inc
Bldg-Maintenance and Svc
|
$18.80
|
-0.50
-2.59% |
$19.20
|
27,846
30.27% of 50 DAV
50 DAV is 92,000
|
$23.00
-18.26%
|
11/23/2016
|
$19.35
|
PP = $18.26
|
|
MB = $19.17
|
 Most Recent Note - 1/12/2017 5:20:39 PM
G - Failed to find great support today while quietly sputtering near prior highs and its 50 DMA line. More damaging losses would raise concerns and may trigger technical sell signals.
>>> FEATURED STOCK ARTICLE : Consolidating After Strong Sep '16 Quarterly Earnings News - 12/21/2016 |
View all notes |
Set NEW NOTE alert |
Company Profile |
SEC
News |
Chart |
Request a new note
C
A
S
I |
BERY
-
NYSE
Berry Plastics Group Inc
CONSUMER NON-DURABLES - Packaging and Containers
|
$50.47
|
-0.40
-0.79% |
$50.82
|
745,405
55.79% of 50 DAV
50 DAV is 1,336,000
|
$51.68
-2.34%
|
11/30/2016
|
$50.26
|
PP = $46.47
|
|
MB = $48.79
|
Most Recent Note - 1/12/2017 5:23:42 PM
G - Consolidating in an orderly fashion with volume totals cooling since its 11/29/16 breakout. Insider buying reported in recent weeks is a reassuring sign. Its 50 DMA line ($48.20) defines support to watch above prior highs in the $46 area.
>>> FEATURED STOCK ARTICLE : Orderly Consolidation Continues Well Above Support - 1/3/2017 |
View all notes |
Set NEW NOTE alert |
Company Profile |
SEC
News |
Chart |
Request a new note
C
A
S
I |
EVR
-
NYSE
Evercore Partners Inc
FINANCIAL SERVICES - Investment Banking
|
$72.45
|
-0.15
-0.21% |
$72.65
|
400,773
87.51% of 50 DAV
50 DAV is 458,000
|
$72.85
-0.55%
|
1/5/2017
|
$71.40
|
PP = $72.07
|
|
MB = $75.67
|
Most Recent Note - 1/10/2017 4:44:59 PM
Y - Wedging higher with gains lacking volume after a new pivot point was cited based on its 12/08/16 high plus 10 cents. Gains above a pivot point must have a minimum of +40% above average volume to trigger a proper new (or add-on) technical buy signal. Its 50 DMA line ($66) defines important support above prior highs.
>>> FEATURED STOCK ARTICLE : Perched Near All-Time High Building New Flat Base - 1/5/2017 |
View all notes |
Set NEW NOTE alert |
Company Profile |
SEC
News |
Chart |
Request a new note
C
A
S
I |
HTHT
-
NASDAQ
China Lodging Group Ads
LEISURE - Lodging
|
$50.07
|
+1.38
2.83% |
$50.75
|
113,024
60.44% of 50 DAV
50 DAV is 187,000
|
$54.23
-7.67%
|
9/29/2016
|
$46.12
|
PP = $47.82
|
|
MB = $50.21
|
Most Recent Note - 1/12/2017 5:21:41 PM
G - Posted a gain today with light volume, rising from support at its 50 DMA line ($48.29). The prior low ($45.61 on 12/20/16) defines the next important near-term support level. Repeatedly noted with caution in prior reports - "Reported earnings +10% on +6% sales revenues for the Sep '16 quarter, below the +25% minimum earnings guideline (C criteria), raising concerns." See the latest FSU analysis for more details and a new annotated graph.
>>> FEATURED STOCK ARTICLE : Slump Below "Max Buy" Level But Fundamental Concerns Were Raised - 1/6/2017 |
View all notes |
Set NEW NOTE alert |
Company Profile |
SEC
News |
Chart |
Request a new note
C
A
S
I |
Symbol/Exchange
Company Name
Industry Group |
PRICE |
CHANGE
(%Change) |
Day High |
Volume
(% DAV)
(% 50 day avg vol) |
52 Wk Hi
% From Hi |
Featured
Date |
Price
Featured |
Pivot Featured |
|
Max Buy |
DW
-
NYSE
LCI Industries
MATERIALS and CONSTRUCTION - General Building Materials
|
$110.00
|
-0.10
-0.09% |
$110.15
|
96,565
44.52% of 50 DAV
50 DAV is 216,900
|
$116.50
-5.58%
|
11/29/2016
|
$106.29
|
PP = $101.00
|
|
MB = $106.05
|
Most Recent Note - 1/10/2017 4:42:44 PM
G - Consolidating well above prior highs in the $101-103 area defining support to watch coinciding with its 50 DMA line. Drew Industries (DW) announced a new name LCI Industries (LCII) and new trading symbol effective as of the market open on January 3, 2017.
>>> FEATURED STOCK ARTICLE : Consolidating Well Above Prior Highs and 50-Day Moving Average - 12/30/2016 |
View all notes |
Set NEW NOTE alert |
Company Profile |
SEC
News |
Chart |
Request a new note
C
A
S
I |
LMAT
-
NASDAQ
Lemaitre Vascular Inc
Medical-Products
|
$24.72
|
-0.55
-2.18% |
$24.94
|
218,860
148.88% of 50 DAV
50 DAV is 147,000
|
$27.04
-8.57%
|
12/22/2016
|
$24.99
|
PP = $25.09
|
|
MB = $26.34
|
Most Recent Note - 1/12/2017 1:27:01 PM
Y - Its slump back into the prior base raised concerns as it endured distributional pressure and tested support at its 50 DMA line ($23.66) today. More damaging losses would raise serious concerns and trigger a technical sell signal. Wedged to new highs with a gain backed by +46% above average volume on 1/10/17, rallying above the pivot point cited based on its 11/17/16 high plus 10 cents.
>>> FEATURED STOCK ARTICLE : Built an Orderly Base-On-Base Pattern - 12/23/2016 |
View all notes |
Set NEW NOTE alert |
Company Profile |
SEC
News |
Chart |
Request a new note
C
A
S
I |
BEAT
-
NASDAQ
BioTelemetry Inc
Medical-Services
|
$21.55
|
-0.95
-4.22% |
$22.50
|
318,404
98.88% of 50 DAV
50 DAV is 322,000
|
$24.10
-10.58%
|
12/19/2016
|
$22.91
|
PP = $21.78
|
|
MB = $22.87
|
Most Recent Note - 1/12/2017 4:31:40 PM
Y - Color code is changed to yellow after it slumped back into its prior base raising concerns with a loss today on higher (near average) volume. Prior highs in the $21-22 area define initial support to watch above its 50 DMA line ($20.35).
>>> FEATURED STOCK ARTICLE : Volume Totals Cooling While Consolidating Above Prior Highs - 1/10/2017 |
View all notes |
Set NEW NOTE alert |
Company Profile |
SEC
News |
Chart |
Request a new note
C
A
S
I |
PATK
-
NASDAQ
Patrick Industries Inc
WHOLESALE - Building Materials Wholesale
|
$80.40
|
-0.05
-0.06% |
$80.65
|
71,518
57.68% of 50 DAV
50 DAV is 124,000
|
$81.45
-1.29%
|
11/29/2016
|
$72.45
|
PP = $69.63
|
|
MB = $73.11
|
Most Recent Note - 1/10/2017 4:46:51 PM
G - Touched a new all-time high today. Stubbornly holding its ground while getting extended from its prior base. Prior highs in the $69 area and its 50 DMA line ($69.65) define support to watch on pullbacks.
>>> FEATURED STOCK ARTICLE : Stubbornly Held Ground and Rose Since Featured Again - 12/28/2016 |
View all notes |
Set NEW NOTE alert |
Company Profile |
SEC
News |
Chart |
Request a new note
C
A
S
I |
ANET
-
NYSE
Arista Networks Inc
TELECOMMUNICATIONS - Communication Equipment
|
$99.00
|
-0.47
-0.47% |
$99.99
|
590,355
75.59% of 50 DAV
50 DAV is 781,000
|
$103.00
-3.88%
|
12/30/2016
|
$96.77
|
PP = $99.00
|
|
MB = $103.95
|
Most Recent Note - 1/10/2017 4:38:59 PM
Y - Consolidating after rallying from the previously noted advanced "3-weeks tight" base pattern hitting new all-time highs with a volume-driven gain on 1/04/17. Its 50 DMA line ($93.11) and prior lows in the $91 area define important support to watch on pullbacks.
>>> FEATURED STOCK ARTICLE : Holding Ground After Rally More Than 5% Beyond Prior Highs - 12/20/2016 |
View all notes |
Set NEW NOTE alert |
Company Profile |
SEC
News |
Chart |
Request a new note
C
A
S
I |
Symbol/Exchange
Company Name
Industry Group |
PRICE |
CHANGE
(%Change) |
Day High |
Volume
(% DAV)
(% 50 day avg vol) |
52 Wk Hi
% From Hi |
Featured
Date |
Price
Featured |
Pivot Featured |
|
Max Buy |
SFBS
-
NASDAQ
Servisfirst Bancshares
BANKING - Regional - Southeast Banks
|
$37.19
|
-0.94
-2.47% |
$38.00
|
143,426
48.29% of 50 DAV
50 DAV is 297,000
|
$38.65
-3.78%
|
7/19/2016
|
$26.64
|
PP = $26.41
|
|
MB = $27.73
|
Most Recent Note - 1/12/2017 5:18:12 PM
G - Extended from its prior base. Its recent low and 50 DMA line ($34.83) define important support to watch on pullbacks. See the latest FSU analysis for more details and a new annotated graph.
>>> FEATURED STOCK ARTICLE : Stubbornly Holding Ground Near Highs - 1/12/2017 |
View all notes |
Set NEW NOTE alert |
Company Profile |
SEC
News |
Chart |
Request a new note
C
A
S
I |
|
|
|
THESE ARE NOT BUY RECOMMENDATIONS!
Comments contained in the body of this report are technical
opinions only. The material herein has been obtained
from sources believed to be reliable and accurate, however,
its accuracy and completeness cannot be guaranteed.
This site is not an investment advisor, hence it does
not endorse or recommend any securities or other investments.
Any recommendation contained in this report may not
be suitable for all investors and it is not to be deemed
an offer or solicitation on our part with respect to
the purchase or sale of any securities. All trademarks,
service marks and trade names appearing in this report
are the property of their respective owners, and are
likewise used for identification purposes only.
This report is a service available
only to active Paid Premium Members.
You may opt-out of receiving report notifications
at any time. Questions or comments may be submitted
by writing to Premium Membership Services 665 S.E. 10 Street, Suite 201 Deerfield Beach, FL 33441-5634 or by calling 1-800-965-8307
or 954-785-1121.
|
|
|