You are not logged in.
This means you
CAN ONLY VIEW reports that were published prior to Thursday, April 17, 2025.
You
MUST UPGRADE YOUR MEMBERSHIP if you want to see any current reports.
AFTER MARKET UPDATE - TUESDAY, JANUARY 10TH, 2017
Previous After Market Report Next After Market Report >>>
|
|
|
|
DOW |
-31.85 |
19,855.53 |
-0.16% |
|
Volume |
1,174,015,480 |
+14% |
|
Volume |
1,629,557,080 |
-5% |
|
NASDAQ |
+20.00 |
5,551.82 |
+0.36% |
|
Advancers |
1,867 |
64% |
|
Advancers |
1,983 |
66% |
|
S&P 500 |
+0.00 |
2,268.90 |
+0.00% |
|
Decliners |
1,057 |
36% |
|
Decliners |
1,000 |
34% |
|
Russell 2000 |
+13.41 |
1,370.90 |
+0.99% |
|
52 Wk Highs |
89 |
|
|
52 Wk Highs |
98 |
|
|
S&P 600 |
+7.72 |
840.10 |
+0.93% |
|
52 Wk Lows |
11 |
|
|
52 Wk Lows |
22 |
|
|
 |
Breadth Positive and Leadership Improved as Major Indices Were Mixed
Kenneth J. Gruneisen - Passed the CAN SLIM® Master's Exam
Stocks finished mostly higher on Tuesday. The Dow was down 31 points to 19855. The S&P 500 finished unchanged at 2268 and the Nasdaq Composite gained 20 points to 5551. Volume totals were mixed, higher than the prior session total on the NYSE and lower on the Nasdaq exchange. Breadth was positive as advancers led decliners by 9-5 on the NYSE and by nearly 2-1 on the Nasdaq exchange. There were 21 high-ranked companies from the Leaders List that made new 52-week highs and were listed on the BreakOuts Page, versus the total of 6 on the prior session. New 52-week highs totals expanded and easily outnumbered new 52-week lows on both the NYSE and the Nasdaq exchange.
PICTURED: The Dow Jones Industrial Average is perched near its record high, recently challenging the 20,000 level.
Near record high territory, the major averages (M criteria) are in a confirmed uptrend. New buying efforts should only be made in candidates with superior fundamental and technical characteristics. The Featured Stocks Page lists noteworthy high-ranked leaders.
The Nasdaq Composite climbed to an all-time high on Tuesday as investors digested optimistic updates on the economy. On the data front, the Labor Department revealed the number of available jobs rose 1.3% in November from the previous month. In a separate release, an National Federation of Independent Business survey showed small business optimism increased above expectations in December, climbing to a 12-year high. Finally, wholesale inventories grew 1% in November, in-line with expectations.
Six of 11 sectors in the S&P 500 ended in positive territory. Financials outperformed with Bank of America (BAC +1.7%) up. Airline stocks led Industrials higher with United Continental Holdings Inc (UAL +3.34%) rising. In Health Care, Illumina (ILMN +16.60%) rose as the company introduced a new DNA sequencer which can sequence human genome in an hour. Shares of Zimmer Biomet (ZBH +6.23%) rose after the medical device maker raised its earnings guidance. Williams Co. (WMB -10.74%) led the losses in Energy, with shares falling after being the subject of negative analyst commentary.
Treasuries finished modestly lower with the benchmark 10-year note down 3/32 to yield 2.38%. In commodities, NYMEX WTI crude fell 2.3% to $50.78/barrel. COMEX gold gained 0.2% to $1187.10/ounce. In FOREX, the Dollar Index advanced 0.1%. |
 Kenneth J. Gruneisen started out as a licensed stockbroker in August 1987, a couple of months prior to the historic stock market crash that took the Dow Jones Industrial Average down -22.6% in a single day. He has published daily fact-based fundamental and technical analysis on high-ranked stocks online for two decades. Through FACTBASEDINVESTING.COM, Kenneth provides educational articles, news, market commentary, and other information regarding proven investment systems that work in good times and bad.
Comments contained in the body of this report are technical opinions only and are not necessarily those of Gruneisen Growth Corp. The material herein has been obtained from sources believed to be reliable and accurate, however, its accuracy and completeness cannot be guaranteed. Our firm, employees, and customers may effect transactions, including transactions contrary to any recommendation herein, or have positions in the securities mentioned herein or options with respect thereto. Any recommendation contained in this report may not be suitable for all investors and it is not to be deemed an offer or solicitation on our part with respect to the purchase or sale of any securities. |
|
 |
Financial, Retail, Tech and Gold & Silver Indexes Rose
Kenneth J. Gruneisen - Passed the CAN SLIM® Master's Exam
The Broker/Dealer Index ($XBD +0.32%) and Bank Index ($BKX +0.66%) rose along with the Retail Index ($RLX +0.43%) on Tuesday. The Biotechnology Index ($BTK +0.55%) and the Semiconductor Index ($SOX +0.49%) both outpaced the Networking Index ($NWX +0.24%) with modest gains. The Gold & Silver Index ($XAU +1.29%) gained ground while the Integrated Oil Index ($XOI -0.24%) edged lower and the Oil Services Index ($OSX -1.49%) was a standout decliner. Charts courtesy www.stockcharts.com
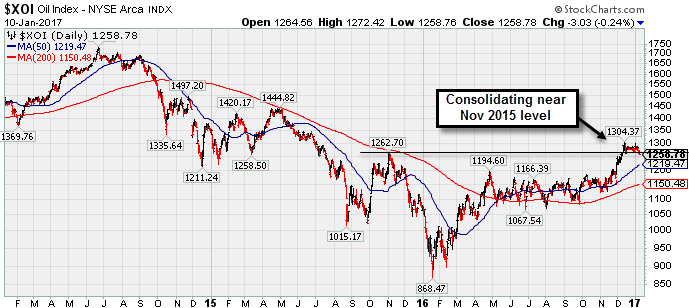 PICTURED: The Integrated Oil Index ($XOI -0.24%) is consolidating near its November 2015 level in recent weeks.
| Oil Services |
$OSX |
186.64 |
-2.83 |
-1.49% |
+1.55% |
| Integrated Oil |
$XOI |
1,258.78 |
-3.03 |
-0.24% |
-0.73% |
| Semiconductor |
$SOX |
923.06 |
+4.48 |
+0.49% |
+1.83% |
| Networking |
$NWX |
447.67 |
+1.07 |
+0.24% |
+0.35% |
| Broker/Dealer |
$XBD |
212.68 |
+0.68 |
+0.32% |
+3.60% |
| Retail |
$RLX |
1,377.45 |
+5.84 |
+0.43% |
+2.57% |
| Gold & Silver |
$XAU |
86.50 |
+1.10 |
+1.29% |
+9.69% |
| Bank |
$BKX |
92.74 |
+0.61 |
+0.66% |
+1.03% |
| Biotech |
$BTK |
3,325.52 |
+18.06 |
+0.55% |
+8.15% |
|
|
|
 |
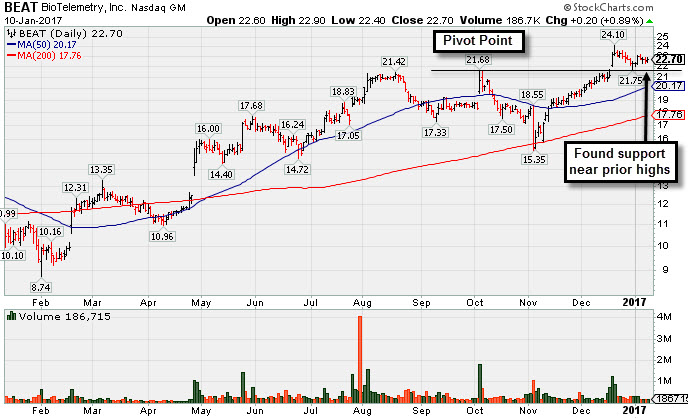
Volume Totals Cooling While Consolidating Above Prior Highs
Kenneth J. Gruneisen - Passed the CAN SLIM® Master's Exam
BioTelemetry Inc (BEAT +$0.20 or +0.89% to $22.70) is consolidating near its "max buy" level with volume totals cooling. Disciplined investors know to never chase stocks and buy them more than +5% above prior highs, and to preserve capital they always sell any stock that falls more than -8% from their purchase price.
Prior highs in the $21-22 area define initial support to watch above its 50-day moving average (DMA) line ($20.17). Volume totals have generally been cooling since it was last shown in this FSU section on 12/19/16 with an annotated graph under the headline, "Breakaway Gap Technically Clears 11-Week V Shaped Base". It was first highlighted in yellow with pivot point cited based on its 10/05/16 high plus 10 cents in the 12/19/16 mid-day report (read here).
It finished strong with +350% above average volume behind its gain after gapping up hitting a new 52-week high (N criteria). It rose from an 11-week "V shaped pattern, which is not as ideal as a more orderly base pattern. During its consolidation it found prompt support near its 200-day moving average (DMA) line, a reassuring sign that institutional owners stepped up near that long-term average.
It has the highest possible Earnings Per Share Rating of 99, well above the 80+ minimum guideline for buy candidates. Its quarterly and annual earnings history is a good match with the C and A criteria. Earnings per share rose +200%, +233%, +67%, and +62% in the Dec '15, Mar, Jun and Sep '16 quarters, respectively. During that same span the sales revenues increases were +7%, +12%, +18%, and +22%, showing encouraging acceleration.
The number of top-rated funds owning its shares rose from 194 in Dec '15 to 261 in Sep '16.Increasing ownership by top-rated funds is a reassuring sign concerning the I criteria, and it has a small supply (S criteria) of only 28.2 million shares outstanding.
|
|
|
Color Codes Explained :
Y - Better candidates highlighted by our
staff of experts.
G - Previously featured
in past reports as yellow but may no longer be buyable under the
guidelines.
***Last / Change / Volume data in this table is the closing quote data***
Symbol/Exchange
Company Name
Industry Group |
PRICE |
CHANGE
(%Change) |
Day High |
Volume
(% DAV)
(% 50 day avg vol) |
52 Wk Hi
% From Hi |
Featured
Date |
Price
Featured |
Pivot Featured |
|
Max Buy |
CSFL
-
NASDAQ
Centerstate Banks Inc
Banks-Southeast
|
$24.73
|
-0.08
-0.32% |
$24.88
|
1,387,797
521.73% of 50 DAV
50 DAV is 266,000
|
$25.83
-4.27%
|
10/10/2016
|
$18.20
|
PP = $18.37
|
|
MB = $19.29
|
 Most Recent Note - 1/10/2017 12:30:41 PM
G - Gapped down today after pricing a new Public Offering of shares. Volume totals had been cooling while holding its ground near all-time highs, extended from any sound base. Its 50 DMA line ($22.86) defines near-term support above prior highs in the $19 area.
>>> FEATURED STOCK ARTICLE : Bank Stock Perched Near Record Highs After Considerable Rally - 1/4/2017 |
View all notes |
Set NEW NOTE alert |
Company Profile |
SEC
News |
Chart |
Request a new note
C
A
S
I |
IESC
-
NASDAQ
I E S Holdings Inc
Bldg-Maintenance and Svc
|
$19.20
|
+0.75
4.07% |
$19.35
|
64,594
70.98% of 50 DAV
50 DAV is 91,000
|
$23.00
-16.52%
|
11/23/2016
|
$19.35
|
PP = $18.26
|
|
MB = $19.17
|
Most Recent Note - 1/10/2017 2:24:45 PM
G - Rebounding above its "max buy" level with a gain today and its color code is changed to green. Found prompt support near prior highs and its 50 DMA line coinciding in the $18 area.
>>> FEATURED STOCK ARTICLE : Consolidating After Strong Sep '16 Quarterly Earnings News - 12/21/2016 |
View all notes |
Set NEW NOTE alert |
Company Profile |
SEC
News |
Chart |
Request a new note
C
A
S
I |
BERY
-
NYSE
Berry Plastics Group Inc
CONSUMER NON-DURABLES - Packaging and Containers
|
$50.63
|
+0.27
0.54% |
$50.67
|
873,588
64.19% of 50 DAV
50 DAV is 1,361,000
|
$51.68
-2.03%
|
11/30/2016
|
$50.26
|
PP = $46.47
|
|
MB = $48.79
|
Most Recent Note - 1/9/2017 5:27:21 PM
G - Still extended from any sound base, consolidating with volume totals generally cooling since its 11/29/16 breakout. Insider buying reported in recent weeks is a reassuring sign. Prior highs in the $46 area and its 50 DMA line ($47.78) define support to watch on pullbacks.
>>> FEATURED STOCK ARTICLE : Orderly Consolidation Continues Well Above Support - 1/3/2017 |
View all notes |
Set NEW NOTE alert |
Company Profile |
SEC
News |
Chart |
Request a new note
C
A
S
I |
EVR
-
NYSE
Evercore Partners Inc
FINANCIAL SERVICES - Investment Banking
|
$72.50
|
+0.60
0.83% |
$72.85
|
341,569
71.76% of 50 DAV
50 DAV is 476,000
|
$72.65
-0.21%
|
1/5/2017
|
$71.40
|
PP = $72.07
|
|
MB = $75.67
|
Most Recent Note - 1/10/2017 4:44:59 PM
Y - Wedging higher with gains lacking volume after a new pivot point was cited based on its 12/08/16 high plus 10 cents. Gains above a pivot point must have a minimum of +40% above average volume to trigger a proper new (or add-on) technical buy signal. Its 50 DMA line ($66) defines important support above prior highs.
>>> FEATURED STOCK ARTICLE : Perched Near All-Time High Building New Flat Base - 1/5/2017 |
View all notes |
Set NEW NOTE alert |
Company Profile |
SEC
News |
Chart |
Request a new note
C
A
S
I |
HTHT
-
NASDAQ
China Lodging Group Ads
LEISURE - Lodging
|
$49.00
|
+0.97
2.02% |
$49.34
|
58,329
30.86% of 50 DAV
50 DAV is 189,000
|
$54.23
-9.64%
|
9/29/2016
|
$46.12
|
PP = $47.82
|
|
MB = $50.21
|
Most Recent Note - 1/10/2017 2:29:48 PM
G - Quietly rising from support at its 50 DMA line ($48.05). The prior low ($45.61 on 12/20/16) defines the next important near-term support level. Repeatedly noted with caution in prior reports - "Reported earnings +10% on +6% sales revenues for the Sep '16 quarter, below the +25% minimum earnings guideline (C criteria), raising concerns." See the latest FSU analysis for more details and a new annotated graph.
>>> FEATURED STOCK ARTICLE : Slump Below "Max Buy" Level But Fundamental Concerns Were Raised - 1/6/2017 |
View all notes |
Set NEW NOTE alert |
Company Profile |
SEC
News |
Chart |
Request a new note
C
A
S
I |
Symbol/Exchange
Company Name
Industry Group |
PRICE |
CHANGE
(%Change) |
Day High |
Volume
(% DAV)
(% 50 day avg vol) |
52 Wk Hi
% From Hi |
Featured
Date |
Price
Featured |
Pivot Featured |
|
Max Buy |
DW
-
NYSE
LCI Industries
MATERIALS and CONSTRUCTION - General Building Materials
|
$109.90
|
+2.60
2.42% |
$110.05
|
124,487
55.25% of 50 DAV
50 DAV is 225,300
|
$116.50
-5.67%
|
11/29/2016
|
$106.29
|
PP = $101.00
|
|
MB = $106.05
|
Most Recent Note - 1/10/2017 4:42:44 PM
G - Consolidating well above prior highs in the $101-103 area defining support to watch coinciding with its 50 DMA line. Drew Industries (DW) announced a new name LCI Industries (LCII) and new trading symbol effective as of the market open on January 3, 2017.
>>> FEATURED STOCK ARTICLE : Consolidating Well Above Prior Highs and 50-Day Moving Average - 12/30/2016 |
View all notes |
Set NEW NOTE alert |
Company Profile |
SEC
News |
Chart |
Request a new note
C
A
S
I |
LMAT
-
NASDAQ
Lemaitre Vascular Inc
Medical-Products
|
$26.59
|
+1.32
5.22% |
$26.90
|
214,990
142.38% of 50 DAV
50 DAV is 151,000
|
$25.87
2.78%
|
12/22/2016
|
$24.99
|
PP = $25.09
|
|
MB = $26.34
|
Most Recent Note - 1/10/2017 2:21:59 PM
G - Color code is changed to green after wedging above its "max buy" level with today's gain lacking great volume conviction. New pivot point was cited based on its 11/17/16 high plus 10 cents after an orderly base-on-base pattern and it was previously noted - "A volume-driven gain and strong close above the pivot point may clinch a new (or add-on) technical buy signal." Its 50 DMA line ($23.52) defines important support above prior lows.
>>> FEATURED STOCK ARTICLE : Built an Orderly Base-On-Base Pattern - 12/23/2016 |
View all notes |
Set NEW NOTE alert |
Company Profile |
SEC
News |
Chart |
Request a new note
C
A
S
I |
BEAT
-
NASDAQ
BioTelemetry Inc
Medical-Services
|
$22.70
|
+0.20
0.89% |
$22.90
|
185,364
57.75% of 50 DAV
50 DAV is 321,000
|
$24.10
-5.81%
|
12/19/2016
|
$22.91
|
PP = $21.78
|
|
MB = $22.87
|
Most Recent Note - 1/10/2017 4:40:27 PM
G - Holding its grounds near its "max buy" level with volume totals cooling. Prior highs in the $21-22 area define initial support to watch above its 50 DMA line.
>>> FEATURED STOCK ARTICLE : Volume Totals Cooling While Consolidating Above Prior Highs - 1/10/2017 |
View all notes |
Set NEW NOTE alert |
Company Profile |
SEC
News |
Chart |
Request a new note
C
A
S
I |
PATK
-
NASDAQ
Patrick Industries Inc
WHOLESALE - Building Materials Wholesale
|
$80.30
|
+0.15
0.19% |
$81.45
|
175,601
139.37% of 50 DAV
50 DAV is 126,000
|
$81.05
-0.93%
|
11/29/2016
|
$72.45
|
PP = $69.63
|
|
MB = $73.11
|
Most Recent Note - 1/10/2017 4:46:51 PM
G - Touched a new all-time high today. Stubbornly holding its ground while getting extended from its prior base. Prior highs in the $69 area and its 50 DMA line ($69.65) define support to watch on pullbacks.
>>> FEATURED STOCK ARTICLE : Stubbornly Held Ground and Rose Since Featured Again - 12/28/2016 |
View all notes |
Set NEW NOTE alert |
Company Profile |
SEC
News |
Chart |
Request a new note
C
A
S
I |
ANET
-
NYSE
Arista Networks Inc
TELECOMMUNICATIONS - Communication Equipment
|
$100.42
|
+0.90
0.90% |
$101.30
|
420,613
53.11% of 50 DAV
50 DAV is 792,000
|
$103.00
-2.50%
|
12/30/2016
|
$96.77
|
PP = $99.00
|
|
MB = $103.95
|
Most Recent Note - 1/10/2017 4:38:59 PM
Y - Consolidating after rallying from the previously noted advanced "3-weeks tight" base pattern hitting new all-time highs with a volume-driven gain on 1/04/17. Its 50 DMA line ($93.11) and prior lows in the $91 area define important support to watch on pullbacks.
>>> FEATURED STOCK ARTICLE : Holding Ground After Rally More Than 5% Beyond Prior Highs - 12/20/2016 |
View all notes |
Set NEW NOTE alert |
Company Profile |
SEC
News |
Chart |
Request a new note
C
A
S
I |
Symbol/Exchange
Company Name
Industry Group |
PRICE |
CHANGE
(%Change) |
Day High |
Volume
(% DAV)
(% 50 day avg vol) |
52 Wk Hi
% From Hi |
Featured
Date |
Price
Featured |
Pivot Featured |
|
Max Buy |
SFBS
-
NASDAQ
Servisfirst Bancshares
BANKING - Regional - Southeast Banks
|
$37.94
|
+0.63
1.69% |
$38.15
|
226,265
77.22% of 50 DAV
50 DAV is 293,000
|
$38.65
-1.84%
|
7/19/2016
|
$26.64
|
PP = $26.41
|
|
MB = $27.73
|
Most Recent Note - 1/9/2017 5:37:33 PM
G - Still holding its ground near all-time highs, extended from its prior base. Its 50 DMA line ($34.21) defines important support to watch on pullbacks. Do not be confused by 2-1 stock split effective 12/21/16 so the Featured Price, Pivot Point and Max Buy levels were adjusted accordingly
>>> FEATURED STOCK ARTICLE : Financial Firm Remains Extended Well Above Prior Highs - 12/14/2016 |
View all notes |
Set NEW NOTE alert |
Company Profile |
SEC
News |
Chart |
Request a new note
C
A
S
I |
|
|
|
THESE ARE NOT BUY RECOMMENDATIONS!
Comments contained in the body of this report are technical
opinions only. The material herein has been obtained
from sources believed to be reliable and accurate, however,
its accuracy and completeness cannot be guaranteed.
This site is not an investment advisor, hence it does
not endorse or recommend any securities or other investments.
Any recommendation contained in this report may not
be suitable for all investors and it is not to be deemed
an offer or solicitation on our part with respect to
the purchase or sale of any securities. All trademarks,
service marks and trade names appearing in this report
are the property of their respective owners, and are
likewise used for identification purposes only.
This report is a service available
only to active Paid Premium Members.
You may opt-out of receiving report notifications
at any time. Questions or comments may be submitted
by writing to Premium Membership Services 665 S.E. 10 Street, Suite 201 Deerfield Beach, FL 33441-5634 or by calling 1-800-965-8307
or 954-785-1121.
|
|
|