You are not logged in.
This means you
CAN ONLY VIEW reports that were published prior to Saturday, March 29, 2025.
You
MUST UPGRADE YOUR MEMBERSHIP if you want to see any current reports.
AFTER MARKET UPDATE - THURSDAY, JANUARY 19TH, 2017
Previous After Market Report Next After Market Report >>>
|
|
|
|
DOW |
-72.32 |
19,732.40 |
-0.37% |
|
Volume |
894,322,790 |
-2% |
|
Volume |
1,658,853,720 |
+9% |
|
NASDAQ |
-15.57 |
5,540.08 |
-0.28% |
|
Advancers |
739 |
25% |
|
Advancers |
848 |
28% |
|
S&P 500 |
-8.20 |
2,263.69 |
-0.36% |
|
Decliners |
2,203 |
75% |
|
Decliners |
2,215 |
72% |
|
Russell 2000 |
-12.81 |
1,345.74 |
-0.94% |
|
52 Wk Highs |
81 |
|
|
52 Wk Highs |
91 |
|
|
S&P 600 |
-8.61 |
823.96 |
-1.03% |
|
52 Wk Lows |
25 |
|
|
52 Wk Lows |
39 |
|
|
 |
Breadth Negative as Major Indices Slump Again
Kenneth J. Gruneisen - Passed the CAN SLIM® Master's Exam
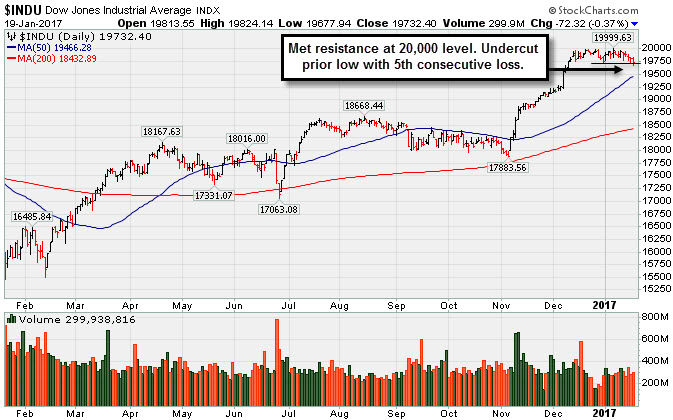
Stocks finished lower on Thursday. The Dow was down 72 points to 19732. The S&P 500 lost 8 points to 2263 and the Nasdaq Composite fell 15 points to 5540. Volume totals were mixed, lighter than the prior session total on the NYSE and higher on the Nasdaq exchange. Breadth was negative as decliners led advancers by a 3-1 margin on the NYSE and by more than a 2-1 margin on the Nasdaq exchange. There were 19 high-ranked companies from the Leaders List that made new 52-week highs and were listed on the BreakOuts Page, versus the total of 15 on the prior session. New 52-week highs outnumbered new 52-week lows on both the NYSE and the Nasdaq exchange.
PICTURED: The Dow Jones Industrial Average suffered a 5th consecutive loss and undercut a prior low. The Blue Chip index has been consolidating in a tight range after meeting resistance at the 20,000 level.
Near record high territory, the major averages (M criteria) are in a confirmed uptrend which has endured distributional pressure. New buying efforts should only be made in candidates with superior fundamental and technical characteristics. The Featured Stocks Page lists noteworthy high-ranked leaders.
The major averages declined on the session as investors digested quarterly earnings and the European Central Bank’s decision to leave interest rates unchanged. In prepared remarks, ECB President Mario Draghi stated there are no convincing signs yet of an upward trend in underlying inflation. On the domestic front, housing starts rebounded 11.3% in December, after a sharp 16.5% decline the previous month. In a separate release, initial jobless claims came in at 234,000, the lowest level in more than 43 years.
Nine of 11 sectors in the S&P 500 ended in negative territory. Financials finished lower with BB&T Corp (BBT -1.97%) ending lower. Bank of New York Mellon (BK -3.01%) fell despite beating analyst estimates on the top and bottom line. In earnings, Rent-A-Center (RCII -18.45%) sank after comparable store sales fell 14% in the quarter. Netflix (NFLX +3.86%) managed a "breakaway gap" for new highs but ended near the session low as the company reported better-than-expected subscription additions. Industrials shares outperformed in the session with CSX Corp (CSX +23.40%) hitting a new all-time high after reporting +21% earnings on +9% sales revenues for the Dec '16 quarter. That marked its first quarterly sales revenues increase in more than 2 years and its biggest earnings increase.
Treasuries finished lower with the benchmark 10-year note down 10/32 to yield 2.46%. In commodities, NYMEX WTI crude added 0.7% to $51.41/barrel. COMEX gold lost 0.6% to $1204.80/ounce. In FOREX, the Dollar Index advanced 0.2%. |
 Kenneth J. Gruneisen started out as a licensed stockbroker in August 1987, a couple of months prior to the historic stock market crash that took the Dow Jones Industrial Average down -22.6% in a single day. He has published daily fact-based fundamental and technical analysis on high-ranked stocks online for two decades. Through FACTBASEDINVESTING.COM, Kenneth provides educational articles, news, market commentary, and other information regarding proven investment systems that work in good times and bad.
Comments contained in the body of this report are technical opinions only and are not necessarily those of Gruneisen Growth Corp. The material herein has been obtained from sources believed to be reliable and accurate, however, its accuracy and completeness cannot be guaranteed. Our firm, employees, and customers may effect transactions, including transactions contrary to any recommendation herein, or have positions in the securities mentioned herein or options with respect thereto. Any recommendation contained in this report may not be suitable for all investors and it is not to be deemed an offer or solicitation on our part with respect to the purchase or sale of any securities. |
|
 |
Financial, Retail, Tech and Commodity-Linked Groups Fell
Kenneth J. Gruneisen - Passed the CAN SLIM® Master's Exam
The Broker/Dealer Index ($XBD -0.44%) and Bank Index ($BKX -0.71%) both fell while the Retail Index ($RLX -0.40%) also created a drag on the major indices on Thursday. The tech sector had a negative bias as the Semiconductor Index ($SOX -0.47%), Biotechnology Index ($BTK -0.75%), and Networking Index ($NWX -0.24%) ended unanimously lower. The Gold & Silver Index ($XAU -0.46%) pulled back and energy-linked shares fell as the Integrated Oil Index ($XOI -0.72%) and the Oil Services Index ($OSX -0.31%) both edged lower. Charts courtesy www.stockcharts.com
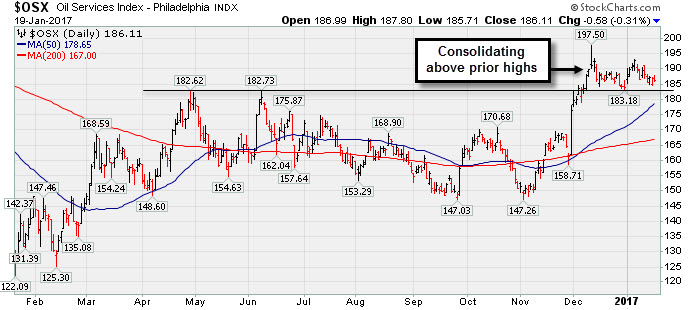 PICTURED: The Oil Services Index ($OSX -0.31%) has been consolidating above its highs from earlier in 2016.
| Oil Services |
$OSX |
186.11 |
-0.58 |
-0.31% |
+1.26% |
| Integrated Oil |
$XOI |
1,257.17 |
-9.11 |
-0.72% |
-0.85% |
| Semiconductor |
$SOX |
918.03 |
-4.33 |
-0.47% |
+1.28% |
| Networking |
$NWX |
440.66 |
-1.07 |
-0.24% |
-1.22% |
| Broker/Dealer |
$XBD |
209.31 |
-0.94 |
-0.44% |
+1.96% |
| Retail |
$RLX |
1,377.88 |
-4.69 |
-0.34% |
+2.60% |
| Gold & Silver |
$XAU |
87.56 |
-0.40 |
-0.45% |
+11.03% |
| Bank |
$BKX |
89.95 |
-0.64 |
-0.71% |
-2.00% |
| Biotech |
$BTK |
3,192.26 |
-24.15 |
-0.75% |
+3.81% |
|
|
|
 |
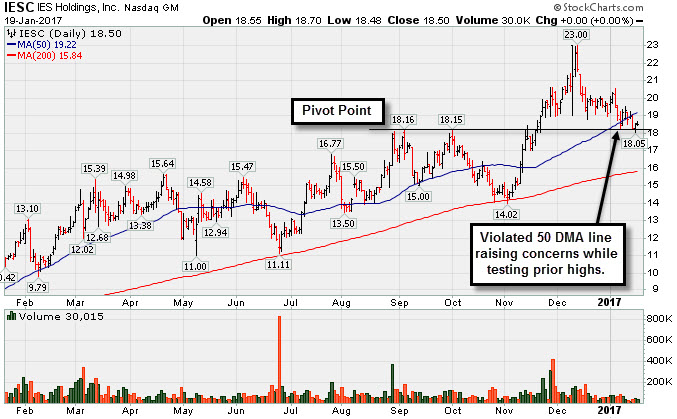
Violated 50-Day Moving Average Line and Now Testing Prior Highs
Kenneth J. Gruneisen - Passed the CAN SLIM® Master's Exam
I E S Holdings Inc (IESC $18.50) has recently posted small gains with light volume, remaining below its 50-day moving average (DMA) line. Prior highs in the $18 area define important support. More damaging losses would trigger a worrisome technical sell signal. Only a prompt rebound above the 50 DMA line ($19.22) would help its outlook improve. It was last shown in this FSU section on 12/21/16 with an annotated graph under the headline, "Consolidating After Strong Sep '16 Quarterly Earnings News".
The high-ranked Building - Maintenance & Service firm reported very strong Sep '16 quarterly sales revenues and earnings increases. It was highlighted in yellow in the 11/23/16 mid-day report as it returned to the Featured Stocks list while noted - "Fundamentals remain strong. Recent volume-driven gains helped it rally to new highs and above the new pivot point cited based on its 9/06/16 high plus 10 cents."
IESC showed bullish action after dropped from the Featured Stocks list on 10/27/16. Following damaging volume-driven losses it found support at its 200-day moving average (DMA) line. Members were previously reminded - "Under the fact-based system a stock which was previously sold can be bought back again if strength returns." The usual sell rules apply if a stock is repurchased, and in the Certification the teach investors to make a 10% larger purchase than on the prior entry.
Its strong earnings track record includes 5 consecutive quarterly earnings increase above the +25% minimum earnings guideline (C criteria). In addition to that fact its sales revenues growth rate showed encouraging acceleration, helping it better match the fact-based investment system's guidelines. Annual earnings (A criteria) growth has been strong for the past 3 years.
Today it has a Timeliness rating of B, and its Sponsorship rating is currently a C. The number of top rated funds owning its shares rose from 52 in Dec '15 to 144 in Dec '16, a reassuring sign concerning the I criteria. Its small supply of only 7.5 million shares (S criteria) in the public float can contribute to greater price volatility in the event of institutional buying or selling
|
|
|
Color Codes Explained :
Y - Better candidates highlighted by our
staff of experts.
G - Previously featured
in past reports as yellow but may no longer be buyable under the
guidelines.
***Last / Change / Volume data in this table is the closing quote data***
Symbol/Exchange
Company Name
Industry Group |
PRICE |
CHANGE
(%Change) |
Day High |
Volume
(% DAV)
(% 50 day avg vol) |
52 Wk Hi
% From Hi |
Featured
Date |
Price
Featured |
Pivot Featured |
|
Max Buy |
CSFL
-
NASDAQ
Centerstate Banks Inc
Banks-Southeast
|
$24.51
|
-0.10
-0.41% |
$24.95
|
236,366
76.49% of 50 DAV
50 DAV is 309,000
|
$25.83
-5.12%
|
10/10/2016
|
$18.20
|
PP = $18.37
|
|
MB = $19.29
|
Most Recent Note - 1/17/2017 2:33:38 PM
G - Completed a new Public Offering of shares on 1/10/17 during its orderly consolidation perched near all-time highs. Its 50 DMA line ($23.38) defines near-term support above prior highs in the $19 area.
>>> FEATURED STOCK ARTICLE : Bank Stock Perched Near Record Highs After Considerable Rally - 1/4/2017 |
View all notes |
Set NEW NOTE alert |
Company Profile |
SEC
News |
Chart |
Request a new note
C
A
S
I |
IESC
-
NASDAQ
I E S Holdings Inc
Bldg-Maintenance and Svc
|
$18.50
|
+0.00
0.00% |
$18.70
|
30,015
32.98% of 50 DAV
50 DAV is 91,000
|
$23.00
-19.57%
|
11/23/2016
|
$19.35
|
PP = $18.26
|
|
MB = $19.17
|
 Most Recent Note - 1/19/2017 5:44:52 PM
G - Remains below its 50 DMA line testing prior highs. More damaging losses would trigger a worrisome technical sell signal. A rebound above the 50 DMA line ($19.22) would help its outlook improve. See the latest FSU analysis for more details and a new annotated graph.
>>> FEATURED STOCK ARTICLE : Violated 50-Day Moving Average Line and Now Testing Prior Highs - 1/19/2017 |
View all notes |
Set NEW NOTE alert |
Company Profile |
SEC
News |
Chart |
Request a new note
C
A
S
I |
BERY
-
NYSE
Berry Plastics Group Inc
CONSUMER NON-DURABLES - Packaging and Containers
|
$50.75
|
-0.86
-1.67% |
$51.75
|
1,073,776
81.29% of 50 DAV
50 DAV is 1,321,000
|
$51.68
-1.80%
|
11/30/2016
|
$50.26
|
PP = $46.47
|
|
MB = $48.79
|
Most Recent Note - 1/18/2017 6:06:35 PM
G - Posted a gain with near average volume today for its best-ever close. Consolidating in an orderly fashion with volume totals cooling since its 11/29/16 breakout. Insider buying reported in recent weeks is a reassuring sign. Its 50 DMA line ($48.66) defines support to watch above prior highs in the $46 area.
>>> FEATURED STOCK ARTICLE : Orderly Consolidation Continues Well Above Support - 1/3/2017 |
View all notes |
Set NEW NOTE alert |
Company Profile |
SEC
News |
Chart |
Request a new note
C
A
S
I |
EVR
-
NYSE
Evercore Partners Inc
FINANCIAL SERVICES - Investment Banking
|
$72.25
|
-0.80
-1.10% |
$73.35
|
452,920
99.54% of 50 DAV
50 DAV is 455,000
|
$74.10
-2.50%
|
1/5/2017
|
$71.40
|
PP = $72.07
|
|
MB = $75.67
|
Most Recent Note - 1/17/2017 2:31:28 PM
Y - Recently wedged higher with gains lacking volume after a new pivot point was cited based on its 12/08/16 high plus 10 cents. Gains above a pivot point must have a minimum of +40% above average volume to trigger a proper new (or add-on) technical buy signal. Its 50 DMA line ($67.53 defines important support above prior highs.
>>> FEATURED STOCK ARTICLE : Perched Near All-Time High Building New Flat Base - 1/5/2017 |
View all notes |
Set NEW NOTE alert |
Company Profile |
SEC
News |
Chart |
Request a new note
C
A
S
I |
HTHT
-
NASDAQ
China Lodging Group Ads
LEISURE - Lodging
|
$50.00
|
-0.01
-0.02% |
$50.36
|
56,899
31.79% of 50 DAV
50 DAV is 179,000
|
$54.23
-7.80%
|
9/29/2016
|
$46.12
|
PP = $47.82
|
|
MB = $50.21
|
Most Recent Note - 1/18/2017 6:01:14 PM
G - Consolidating above support at its 50 DMA line ($48.82). The prior low ($45.61 on 12/20/16) defines the next important near-term support level. Repeatedly noted with caution in prior reports - "Reported earnings +10% on +6% sales revenues for the Sep '16 quarter, below the +25% minimum earnings guideline (C criteria), raising concerns." See the latest FSU analysis for more details and a new annotated graph.
>>> FEATURED STOCK ARTICLE : Slump Below "Max Buy" Level But Fundamental Concerns Were Raised - 1/6/2017 |
View all notes |
Set NEW NOTE alert |
Company Profile |
SEC
News |
Chart |
Request a new note
C
A
S
I |
Symbol/Exchange
Company Name
Industry Group |
PRICE |
CHANGE
(%Change) |
Day High |
Volume
(% DAV)
(% 50 day avg vol) |
52 Wk Hi
% From Hi |
Featured
Date |
Price
Featured |
Pivot Featured |
|
Max Buy |
DW
-
NYSE
LCI Industries
MATERIALS and CONSTRUCTION - General Building Materials
|
$107.70
|
-2.50
-2.27% |
$110.50
|
95,682
48.23% of 50 DAV
50 DAV is 198,400
|
$116.50
-7.55%
|
11/29/2016
|
$106.29
|
PP = $101.00
|
|
MB = $106.05
|
Most Recent Note - 1/17/2017 2:30:21 PM
G - Consolidating near its all-time high, well above support at prior highs in the $101-103 area and above its 50 DMA line ($104.43). Drew Industries (DW) announced a new name LCI Industries (LCII) and new trading symbol effective as of the market open on January 3, 2017.
>>> FEATURED STOCK ARTICLE : Consolidating Well Above Prior Highs and 50-Day Moving Average - 12/30/2016 |
View all notes |
Set NEW NOTE alert |
Company Profile |
SEC
News |
Chart |
Request a new note
C
A
S
I |
LMAT
-
NASDAQ
Lemaitre Vascular Inc
Medical-Products
|
$23.08
|
-0.63
-2.66% |
$23.71
|
102,238
69.55% of 50 DAV
50 DAV is 147,000
|
$27.04
-14.64%
|
12/22/2016
|
$24.99
|
PP = $25.09
|
|
MB = $26.34
|
Most Recent Note - 1/19/2017 5:41:08 PM
G - Slumped below its 50 DMA line with a 6th consecutive loss today raising concerns and triggering a technical sell signal. Color code is changed to green. Only a prompt rebound above its 50 DMA line ($23.93) would help its outlook improve.
>>> FEATURED STOCK ARTICLE : Built an Orderly Base-On-Base Pattern - 12/23/2016 |
View all notes |
Set NEW NOTE alert |
Company Profile |
SEC
News |
Chart |
Request a new note
C
A
S
I |
BEAT
-
NASDAQ
BioTelemetry Inc
Medical-Services
|
$22.35
|
+0.65
3.00% |
$22.35
|
328,478
109.49% of 50 DAV
50 DAV is 300,000
|
$24.10
-7.26%
|
12/19/2016
|
$22.91
|
PP = $21.78
|
|
MB = $22.87
|
Most Recent Note - 1/19/2017 5:42:52 PM
Y - Posted a gain today with slightly above average volume after consolidating near prior highs in the $21-22 area which define initial support to watch above its 50 DMA line ($20.74). More damaging losses leading to violations may trigger technical sell signals.
>>> FEATURED STOCK ARTICLE : Volume Totals Cooling While Consolidating Above Prior Highs - 1/10/2017 |
View all notes |
Set NEW NOTE alert |
Company Profile |
SEC
News |
Chart |
Request a new note
C
A
S
I |
PATK
-
NASDAQ
Patrick Industries Inc
WHOLESALE - Building Materials Wholesale
|
$78.40
|
-2.80
-3.45% |
$81.15
|
225,624
186.47% of 50 DAV
50 DAV is 121,000
|
$81.65
-3.98%
|
11/29/2016
|
$72.45
|
PP = $69.63
|
|
MB = $73.11
|
Most Recent Note - 1/19/2017 5:38:37 PM
G - Pulling back from all-time highs after getting extended from its prior base. Prior highs in the $69 area and its 50 DMA line ($72.60) define support to watch on pullbacks.
>>> FEATURED STOCK ARTICLE : Stubbornly Held Ground and Rose Since Featured Again - 12/28/2016 |
View all notes |
Set NEW NOTE alert |
Company Profile |
SEC
News |
Chart |
Request a new note
C
A
S
I |
ANET
-
NYSE
"Arista Networks, Inc"
TELECOMMUNICATIONS - Communication Equipment
|
$89.72
|
+1.01
1.14% |
$89.92
|
632,306
73.87% of 50 DAV
50 DAV is 856,000
|
$103.00
-12.89%
|
12/30/2016
|
$96.77
|
PP = $99.00
|
|
MB = $103.95
|
Most Recent Note - 1/18/2017 6:00:17 PM
G - Halted its slide today after a damaging gap down on the prior session violated its 50 DMA line triggering a technical sell signal. A prompt rebound above its 50 DMA line ($94.25) is needed for its outlook to improve. See the latest FSU analysis for more details and a new annotated graph.
>>> FEATURED STOCK ARTICLE : Technical Damages Raised Concern and Triggered Technical Sell Signal - 1/18/2017 |
View all notes |
Set NEW NOTE alert |
Company Profile |
SEC
News |
Chart |
Request a new note
C
A
S
I |
Symbol/Exchange
Company Name
Industry Group |
PRICE |
CHANGE
(%Change) |
Day High |
Volume
(% DAV)
(% 50 day avg vol) |
52 Wk Hi
% From Hi |
Featured
Date |
Price
Featured |
Pivot Featured |
|
Max Buy |
SFBS
-
NASDAQ
Servisfirst Bancshares
BANKING - Regional - Southeast Banks
|
$37.04
|
-0.17
-0.46% |
$37.26
|
89,186
30.23% of 50 DAV
50 DAV is 295,000
|
$38.65
-4.17%
|
7/19/2016
|
$26.64
|
PP = $26.41
|
|
MB = $27.73
|
Most Recent Note - 1/17/2017 2:37:47 PM
G - Consolidating near its high. Recent low and its 50 DMA line define important near-term support in the $35 area where subsequent violations would raise concerns.
>>> FEATURED STOCK ARTICLE : Stubbornly Holding Ground Near Highs - 1/12/2017 |
View all notes |
Set NEW NOTE alert |
Company Profile |
SEC
News |
Chart |
Request a new note
C
A
S
I |
|
|
|
THESE ARE NOT BUY RECOMMENDATIONS!
Comments contained in the body of this report are technical
opinions only. The material herein has been obtained
from sources believed to be reliable and accurate, however,
its accuracy and completeness cannot be guaranteed.
This site is not an investment advisor, hence it does
not endorse or recommend any securities or other investments.
Any recommendation contained in this report may not
be suitable for all investors and it is not to be deemed
an offer or solicitation on our part with respect to
the purchase or sale of any securities. All trademarks,
service marks and trade names appearing in this report
are the property of their respective owners, and are
likewise used for identification purposes only.
This report is a service available
only to active Paid Premium Members.
You may opt-out of receiving report notifications
at any time. Questions or comments may be submitted
by writing to Premium Membership Services 665 S.E. 10 Street, Suite 201 Deerfield Beach, FL 33441-5634 or by calling 1-800-965-8307
or 954-785-1121.
|
|
|