You are not logged in.
This means you
CAN ONLY VIEW reports that were published prior to Friday, April 4, 2025.
You
MUST UPGRADE YOUR MEMBERSHIP if you want to see any current reports.
AFTER MARKET UPDATE - FRIDAY, JANUARY 27TH, 2017
Previous After Market Report Next After Market Report >>>
|
|
|
|
DOW |
-7.13 |
20,093.78 |
-0.04% |
|
Volume |
853,100,490 |
-11% |
|
Volume |
1,528,739,260 |
-8% |
|
NASDAQ |
+5.60 |
5,660.78 |
+0.10% |
|
Advancers |
1,234 |
43% |
|
Advancers |
1,365 |
47% |
|
S&P 500 |
-1.99 |
2,294.69 |
-0.09% |
|
Decliners |
1,663 |
57% |
|
Decliners |
1,529 |
53% |
|
Russell 2000 |
-4.84 |
1,370.75 |
-0.35% |
|
52 Wk Highs |
129 |
|
|
52 Wk Highs |
136 |
|
|
S&P 600 |
-3.43 |
838.36 |
-0.41% |
|
52 Wk Lows |
18 |
|
|
52 Wk Lows |
33 |
|
|
 |
Major Indices Stay Perched at Record Highs
Kenneth J. Gruneisen - Passed the CAN SLIM® Master's Exam
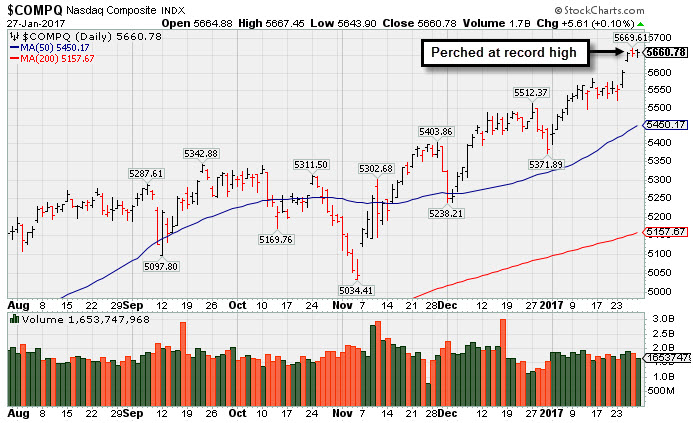
For the week, the Dow was up 1.3%, the S&P 500 added 0.9%, and the Nasdaq gained 1.9%. Stocks finished mixed on Friday. The Dow was down 7 points to 20093. The S&P 500 lost 2 points to 2294 and the Nasdaq Composite added 5 points to 5660. Volume totals were lighter than the prior session totals on the NYSE and on the Nasdaq exchange. Breadth was slightly negative as decliners led advancers by a 4-3 margin on the NYSE and by a narrower margin on the Nasdaq exchange. There were 47 high-ranked companies from the Leaders List that made new 52-week highs and were listed on the BreakOuts Page, versus the total of 73 on the prior session. New 52-week highs totals again contracted yet still solidly outnumbered new 52-week lows on both the NYSE and the Nasdaq exchange.
PICTURED: The Nasdaq Composite Index is perched at record highs. Its 50-day moving average (DMA) line and recent lows define near-term support to watch on pullbacks.
A solid expansion in leadership was behind the major averages' (M criteria) latest gains and the market is in a confirmed uptrend. New buying efforts should only be made in candidates with superior fundamental and technical characteristics. The Featured Stocks Page lists noteworthy high-ranked leaders.
The major averages fluctuated throughout the session Friday following a weaker-than-expected U.S. GDP report. The Commerce Department said the economy grew at a 1.9% annualized rate in the fourth-quarter, below a projected 2.2% increase. As a result, the economy expanded 1.6% in 2016, the weakest pace since 2011. In a separate release, a University of Michigan report revealed consumer confidence rose in January to a 13-year high.
Eight of 11 sectors in the S&P 500 ended in negative territory. Energy stocks led the losses with Chevron (CVX -2.37%) fell as the oil giant posted its first annual loss since 1980. In the consumer space, Colgate-Palmolive (CL -5.22%) fell after lowering its forward earnings guidance. Starbucks (SBUX -4.00%) sank as the coffee chain posted its lowest same-store sales growth since 2009. Technology stocks finished higher with Intel Corp (INTC +1.12%) rising. Microsoft (MSFT +2.35%) rose as the software giant’s revenue beat Street forecasts amid growing demand in cloud services. Shares of Alphabet (GOOGL -1.39%) fell after posting weaker-than-expected quarterly profit.
Treasuries advanced on the session with the benchmark 10-year note up 5/32 to yield 2.48%. In commodities, NYMEX WTI crude lost 1.2% to $53.11/barrel. In FOREX, the Dollar Index gained 0.2%. |
 Kenneth J. Gruneisen started out as a licensed stockbroker in August 1987, a couple of months prior to the historic stock market crash that took the Dow Jones Industrial Average down -22.6% in a single day. He has published daily fact-based fundamental and technical analysis on high-ranked stocks online for two decades. Through FACTBASEDINVESTING.COM, Kenneth provides educational articles, news, market commentary, and other information regarding proven investment systems that work in good times and bad.
Comments contained in the body of this report are technical opinions only and are not necessarily those of Gruneisen Growth Corp. The material herein has been obtained from sources believed to be reliable and accurate, however, its accuracy and completeness cannot be guaranteed. Our firm, employees, and customers may effect transactions, including transactions contrary to any recommendation herein, or have positions in the securities mentioned herein or options with respect thereto. Any recommendation contained in this report may not be suitable for all investors and it is not to be deemed an offer or solicitation on our part with respect to the purchase or sale of any securities. |
|
 |
Tech Sector and Gold & Silver Index Posted Gains
Kenneth J. Gruneisen - Passed the CAN SLIM® Master's Exam
The Retail Index ($RLX -0.32%) edged lower while the Broker/Dealer Index ($XBD -0.74%) and Bank Index ($BKX -0.53%) both posted modest losses on Friday. The tech sector had a positive bias as the Semiconductor Index ($SOX +1.26%) and the Biotechnology Index ($BTK +1.30%) both posted solid gains but the Networking Index ($NWX +0.11%) lagged. Commodity-linked groups were mixed as the Gold & Silver Index ($XAU +1.57%) rose but the Oil Services Index ($OSX -1.64%) and the Integrated Oil Index ($XOI -1.17%) both suffered losses. Charts courtesy www.stockcharts.com
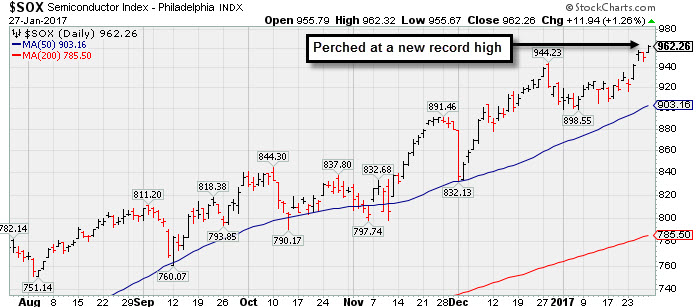 PICTURED: The Semiconductor Index ($SOX +1.26%) is perched at a new record high.
| Oil Services |
$OSX |
183.89 |
-3.07 |
-1.64% |
+0.05% |
| Integrated Oil |
$XOI |
1,250.71 |
-14.85 |
-1.17% |
-1.36% |
| Semiconductor |
$SOX |
962.26 |
+11.94 |
+1.26% |
+6.15% |
| Networking |
$NWX |
449.19 |
+0.49 |
+0.11% |
+0.69% |
| Broker/Dealer |
$XBD |
216.79 |
-1.61 |
-0.74% |
+5.60% |
| Retail |
$RLX |
1,396.44 |
-4.48 |
-0.32% |
+3.98% |
| Gold & Silver |
$XAU |
89.58 |
+1.38 |
+1.56% |
+13.59% |
| Bank |
$BKX |
92.85 |
-0.50 |
-0.54% |
+1.15% |
| Biotech |
$BTK |
3,185.70 |
+40.93 |
+1.30% |
+3.60% |
|
|
|
 |
Concerns Increase While Lingering Below 50-Day Moving Average
Kenneth J. Gruneisen - Passed the CAN SLIM® Master's Exam
Lemaitre Vascular Inc (LMAT +$0.28 or +1.21% to $23.42) has seen volume totals cooling for the past 2 weeks. However, the longer it lingers below its 50-day moving average (DMA) line the worse its outlook gets. A rebound above its 50 DMA line ($23.98) is needed for its outlook to improve.
LMAT was last shown in this FSU section on 12/23/16 with an annotated graph under the headline, " Built an Orderly Base-On-Base Pattern". A new pivot point was cited based on its 11/17/16 high plus 10 cents after an orderly base-on-base pattern. Its subsequent gain for new highs on 1/10/17 was backed by +46% above average volume, just above the minimum of +40% above average volume needed to trigger a proper technical buy signal. Although no resistance remained due to overhead supply, the stock immediately encountered some distributional pressure and slumped back into its prior base raising concerns.
The high-ranked Medical - Products firm was first highlighted in yellow with a pivot point based on its 9/20/16 high plus 10 cents in the 10/27/16 mid-day report (read here). It recently reported earnings +55% on +22% sales revenues for the Sep '16 quarter, marking its 3rd consecutive quarter above the +25% minimum earnings guideline (C criteria), helping it better match the fact-based investment system's fundamental guidelines. Earnings rose +18%, +38%, +40% and +55% in the Dec '15, Mar, Jun, and Sep '16 quarters, respectively, demonstrating encouraging sales revenues and earnings acceleration. Sales revenues rose +10%, +7%, +13% and +20% over that same span. Annual earnings (A criteria) history has been steadily improving since a downturn in FY '11.
Its current Up/Down Volume ratio of 0.9 is an unbiased indication that its shares were under slight distributional pressure over the past 50 days. The number of top-rated funds owning its share rose from 184 in Dec '15 to 202 in Dec '16, a reassuring sign concerning the I criteria. Its small supply of 13.2 million shares (S criteria) in the public float can contribute to greater price volatility in the event of institutional buying or selling. |
|
|
Color Codes Explained :
Y - Better candidates highlighted by our
staff of experts.
G - Previously featured
in past reports as yellow but may no longer be buyable under the
guidelines.
***Last / Change / Volume data in this table is the closing quote data***
Symbol/Exchange
Company Name
Industry Group |
PRICE |
CHANGE
(%Change) |
Day High |
Volume
(% DAV)
(% 50 day avg vol) |
52 Wk Hi
% From Hi |
Featured
Date |
Price
Featured |
Pivot Featured |
|
Max Buy |
THO
-
NYSE
Thor Industries Inc
AUTOMOTIVE - Recreational Vehicles
|
$105.19
|
-0.85
-0.80% |
$105.92
|
442,364
61.02% of 50 DAV
50 DAV is 725,000
|
$108.45
-3.00%
|
1/24/2017
|
$100.52
|
PP = $108.45
|
|
MB = $113.87
|
Most Recent Note - 1/25/2017 5:21:48 PM
Y - Posted a 2nd consecutive big gain with near average volume today while rallying from support at its 50 DMA line ($99). It was highlighted in yellow in the 1/24/17 mid-day report as a new pivot point was cited based on its 12/07/16 high plus 10 cents (read here) . Subsequent volume-driven gains for new highs are needed to trigger a technical buy signal. Reported earnings +54% on +66% sales revenues for the Oct '16 quarter. Three of the past 4 quarters were above the +25% minimum earnings guideline (C criteria) of the fact-based investment system. See the latest FSU analysis for more details and an annotated graph.
>>> FEATURED STOCK ARTICLE : Rose From Support at 50-Day Moving Average Line - 1/24/2017 |
View all notes |
Set NEW NOTE alert |
Company Profile |
SEC
News |
Chart |
Request a new note
C
A
S
I |
CSFL
-
NASDAQ
Centerstate Banks Inc
Banks-Southeast
|
$24.91
|
-0.60
-2.35% |
$25.49
|
333,376
110.76% of 50 DAV
50 DAV is 301,000
|
$26.30
-5.29%
|
10/10/2016
|
$18.20
|
PP = $18.37
|
|
MB = $19.29
|
 Most Recent Note - 1/27/2017 5:24:44 PM
G - Pulled back today with near average volume after hitting a new high with a volume-driven gain on the prior session. Completed a new Public Offering of shares on 1/10/17 during its orderly consolidation. Its 50 DMA line ($24.28) and recent lows define near-term support to watch.
>>> FEATURED STOCK ARTICLE : Bank Stock Perched Near Record Highs After Considerable Rally - 1/4/2017 |
View all notes |
Set NEW NOTE alert |
Company Profile |
SEC
News |
Chart |
Request a new note
C
A
S
I |
IESC
-
NASDAQ
I E S Holdings Inc
Bldg-Maintenance and Svc
|
$19.85
|
-0.30
-1.49% |
$20.40
|
26,664
30.65% of 50 DAV
50 DAV is 87,000
|
$23.00
-13.70%
|
11/23/2016
|
$19.35
|
PP = $18.26
|
|
MB = $19.17
|
Most Recent Note - 1/25/2017 5:17:55 PM
G - Gapped up for a 2nd consecutive session today and posted a 6th consecutive gain backed by below average volume. Recently found support near prior highs in the $18 area.
>>> FEATURED STOCK ARTICLE : Violated 50-Day Moving Average Line and Now Testing Prior Highs - 1/19/2017 |
View all notes |
Set NEW NOTE alert |
Company Profile |
SEC
News |
Chart |
Request a new note
C
A
S
I |
BERY
-
NYSE
Berry Plastics Group Inc
CONSUMER NON-DURABLES - Packaging and Containers
|
$51.53
|
-0.03
-0.06% |
$51.71
|
2,381,479
185.18% of 50 DAV
50 DAV is 1,286,000
|
$52.97
-2.72%
|
11/30/2016
|
$50.26
|
PP = $46.47
|
|
MB = $48.79
|
Most Recent Note - 1/27/2017 11:31:10 AM
G - Perched near all-time highs after wedging higher with recent gains lacking great volume conviction. Insider buying reported in recent weeks is a reassuring sign. Its 50 DMA line ($49.63) defines support to watch above recent lows in the $48.50 area.
>>> FEATURED STOCK ARTICLE : Orderly Consolidation Continues Well Above Support - 1/3/2017 |
View all notes |
Set NEW NOTE alert |
Company Profile |
SEC
News |
Chart |
Request a new note
C
A
S
I |
EVR
-
NYSE
Evercore Partners Inc
FINANCIAL SERVICES - Investment Banking
|
$77.50
|
+0.35
0.45% |
$77.60
|
287,362
67.46% of 50 DAV
50 DAV is 426,000
|
$77.35
0.19%
|
1/5/2017
|
$71.40
|
PP = $72.07
|
|
MB = $75.67
|
Most Recent Note - 1/23/2017 5:48:01 PM
Y - Wedged higher with today's gain lacking great volume conviction. Its 50 DMA line ($68.95) defines support above prior highs. Concerns remain because volume behind all gains has been light since a new pivot point was cited based on its 12/08/16 high plus 10 cents - "Gains above a pivot point must have a minimum of +40% above average volume to trigger a proper new (or add-on) technical buy signal.)
>>> FEATURED STOCK ARTICLE : Perched Near All-Time High Building New Flat Base - 1/5/2017 |
View all notes |
Set NEW NOTE alert |
Company Profile |
SEC
News |
Chart |
Request a new note
C
A
S
I |
Symbol/Exchange
Company Name
Industry Group |
PRICE |
CHANGE
(%Change) |
Day High |
Volume
(% DAV)
(% 50 day avg vol) |
52 Wk Hi
% From Hi |
Featured
Date |
Price
Featured |
Pivot Featured |
|
Max Buy |
HTHT
-
NASDAQ
China Lodging Group Ads
LEISURE - Lodging
|
$53.91
|
-0.18
-0.33% |
$54.28
|
105,485
61.69% of 50 DAV
50 DAV is 171,000
|
$55.00
-1.98%
|
9/29/2016
|
$46.12
|
PP = $47.82
|
|
MB = $50.21
|
Most Recent Note - 1/26/2017 1:08:35 PM
G - Hitting new all-time highs with today's 5th consecutive gain. Recently found support at its 50 DMA line ($49.56). Repeatedly noted with caution in prior reports - "Reported earnings +10% on +6% sales revenues for the Sep '16 quarter, below the +25% minimum earnings guideline (C criteria), raising concerns."
>>> FEATURED STOCK ARTICLE : Slump Below "Max Buy" Level But Fundamental Concerns Were Raised - 1/6/2017 |
View all notes |
Set NEW NOTE alert |
Company Profile |
SEC
News |
Chart |
Request a new note
C
A
S
I |
DW
-
NYSE
LCI Industries
MATERIALS and CONSTRUCTION - General Building Materials
|
$116.80
|
+0.90
0.78% |
$117.15
|
152,499
82.57% of 50 DAV
50 DAV is 184,700
|
$117.00
-0.17%
|
11/29/2016
|
$106.29
|
PP = $101.00
|
|
MB = $106.05
|
Most Recent Note - 1/23/2017 5:43:17 PM
G - Found support at its 50 DMA line ($106.10) and posted a gain today with average volume. Prior highs in the $103 area define the next important support level below its 50 DMA line. Subsequent violations may trigger technical sell signals. Drew Industries (DW) announced a new name LCI Industries (LCII) and new trading symbol effective as of the market open on January 3, 2017.
>>> FEATURED STOCK ARTICLE : Consolidating Well Above Prior Highs and 50-Day Moving Average - 12/30/2016 |
View all notes |
Set NEW NOTE alert |
Company Profile |
SEC
News |
Chart |
Request a new note
C
A
S
I |
LMAT
-
NASDAQ
Lemaitre Vascular Inc
Medical-Products
|
$23.42
|
+0.28
1.21% |
$23.65
|
78,539
60.88% of 50 DAV
50 DAV is 129,000
|
$27.04
-13.38%
|
12/22/2016
|
$24.99
|
PP = $25.09
|
|
MB = $26.34
|
Most Recent Note - 1/27/2017 5:22:23 PM
G - Volume totals have been cooling the past 2 weeks, but the longer it lingers below its 50 DMA line the worse it outlook gets. A rebound above its 50 DMA line ($23.98) is needed for its outlook to improve. See the latest FSU analysis for more details and a new annotated graph.
>>> FEATURED STOCK ARTICLE : Concerns Increase While Lingering Below 50-Day Moving Average - 1/27/2017 |
View all notes |
Set NEW NOTE alert |
Company Profile |
SEC
News |
Chart |
Request a new note
C
A
S
I |
BEAT
-
NASDAQ
BioTelemetry Inc
Medical-Services
|
$22.65
|
+0.15
0.67% |
$22.75
|
95,944
34.64% of 50 DAV
50 DAV is 277,000
|
$24.10
-6.02%
|
12/19/2016
|
$22.91
|
PP = $21.78
|
|
MB = $22.87
|
Most Recent Note - 1/26/2017 1:06:31 PM
Y - Consolidating above prior highs in the $21-22 area and above its 50 DMA line defining important near-term support to watch. Damaging losses leading to violations may trigger technical sell signals.
>>> FEATURED STOCK ARTICLE : Volume Totals Cooling While Consolidating Above Prior Highs - 1/10/2017 |
View all notes |
Set NEW NOTE alert |
Company Profile |
SEC
News |
Chart |
Request a new note
C
A
S
I |
PATK
-
NASDAQ
Patrick Industries Inc
WHOLESALE - Building Materials Wholesale
|
$83.40
|
+0.15
0.18% |
$83.50
|
47,181
38.99% of 50 DAV
50 DAV is 121,000
|
$83.25
0.18%
|
11/29/2016
|
$72.45
|
PP = $69.63
|
|
MB = $73.11
|
Most Recent Note - 1/26/2017 1:04:52 PM
G - Perched quietly at all-time highs, extended from its prior base. Its 50 DMA line ($74.77) defines support to watch on pullbacks.
>>> FEATURED STOCK ARTICLE : Stubbornly Held Ground and Rose Since Featured Again - 12/28/2016 |
View all notes |
Set NEW NOTE alert |
Company Profile |
SEC
News |
Chart |
Request a new note
C
A
S
I |
Symbol/Exchange
Company Name
Industry Group |
PRICE |
CHANGE
(%Change) |
Day High |
Volume
(% DAV)
(% 50 day avg vol) |
52 Wk Hi
% From Hi |
Featured
Date |
Price
Featured |
Pivot Featured |
|
Max Buy |
ESNT
-
NYSE
Essent Group Ltd
Finance-MrtgandRel Svc
|
$34.31
|
-0.33
-0.95% |
$34.78
|
617,524
88.09% of 50 DAV
50 DAV is 701,000
|
$34.77
-1.32%
|
1/25/2017
|
$34.09
|
PP = $34.04
|
|
MB = $35.74
|
Most Recent Note - 1/25/2017 5:15:22 PM
Y - Finished strong after highlighted in yellow with new pivot point cited based on its 12/12/16 high plus 10 cents. Hit new all-time highs with +107% above average volume triggering a technical buy signal. Found support above its 50 DMA line during its orderly consolidation. Quarterly earnings and sales revenues increases in comparisons through Sep '16 have been strong, Annual earnings (A criteria) history has been good since its $17 IPO on 10/31/13. Completed a new Public Offering on 11/19/14. See the latest FSU analysis for more details and a new annotated graph.
>>> FEATURED STOCK ARTICLE : Twice Average Volume Behind Big Breakout Gain - 1/25/2017 |
View all notes |
Set NEW NOTE alert |
Company Profile |
SEC
News |
Chart |
Request a new note
C
A
S
I |
ANET
-
NYSE
Arista Networks Inc
TELECOMMUNICATIONS - Communication Equipment
|
$93.78
|
+0.87
0.94% |
$93.94
|
348,162
43.74% of 50 DAV
50 DAV is 796,000
|
$103.00
-8.95%
|
12/30/2016
|
$96.77
|
PP = $99.00
|
|
MB = $103.95
|
Most Recent Note - 1/24/2017 5:43:57 PM
G - Rose today yet remains below its 50 DMA line after a damaging gap down on 1/17/17 triggering a technical sell signal. A rebound above its 50 DMA line ($94.67) is needed for its outlook to improve.
>>> FEATURED STOCK ARTICLE : Technical Damages Raised Concern and Triggered Technical Sell Signal - 1/18/2017 |
View all notes |
Set NEW NOTE alert |
Company Profile |
SEC
News |
Chart |
Request a new note
C
A
S
I |
VBTX
-
NASDAQ
Veritex Holdings Inc
BANKING - Regional - Southwest Banks
|
$27.09
|
-0.40
-1.46% |
$28.03
|
125,351
167.13% of 50 DAV
50 DAV is 75,000
|
$28.61
-5.31%
|
1/23/2017
|
$27.30
|
PP = $27.87
|
|
MB = $29.26
|
Most Recent Note - 1/27/2017 5:27:31 PM
Y - Met mild distributional pressure this week after its 1/25/17 gain was backed by +38% above average volume while trying to break out from a short flat base. Members were previously reminded - "A gain above the pivot point backed by at least +40% above average volume is needed to trigger a proper technical buy signal. Reported Dec '16 quarterly earnings +17% on +26% sales revenues, below the +25% minimum guideline (C criteria) for buy candidates, raising fundamental concerns. Completed a new Public Offering on 12/15/16 See the latest FSU analysis for more details and an annotated graph."
>>> FEATURED STOCK ARTICLE : Challenged Highs But Ended in Bottom Third of Intra-day Range - 1/23/2017 |
View all notes |
Set NEW NOTE alert |
Company Profile |
SEC
News |
Chart |
Request a new note
C
A
S
I |
SFBS
-
NASDAQ
Servisfirst Bancshares
BANKING - Regional - Southeast Banks
|
$38.93
|
-0.25
-0.64% |
$39.24
|
92,997
34.06% of 50 DAV
50 DAV is 273,000
|
$39.26
-0.84%
|
7/19/2016
|
$26.64
|
PP = $26.41
|
|
MB = $27.73
|
Most Recent Note - 1/24/2017 5:49:12 PM
G - Posted a gain on light volume today challenging prior highs. Recent low and its 50 DMA line define important near-term support in the $35-36 area where subsequent violations would raise concerns.
>>> FEATURED STOCK ARTICLE : Stubbornly Holding Ground Near Highs - 1/12/2017 |
View all notes |
Set NEW NOTE alert |
Company Profile |
SEC
News |
Chart |
Request a new note
C
A
S
I |
|
|
|
THESE ARE NOT BUY RECOMMENDATIONS!
Comments contained in the body of this report are technical
opinions only. The material herein has been obtained
from sources believed to be reliable and accurate, however,
its accuracy and completeness cannot be guaranteed.
This site is not an investment advisor, hence it does
not endorse or recommend any securities or other investments.
Any recommendation contained in this report may not
be suitable for all investors and it is not to be deemed
an offer or solicitation on our part with respect to
the purchase or sale of any securities. All trademarks,
service marks and trade names appearing in this report
are the property of their respective owners, and are
likewise used for identification purposes only.
This report is a service available
only to active Paid Premium Members.
You may opt-out of receiving report notifications
at any time. Questions or comments may be submitted
by writing to Premium Membership Services 665 S.E. 10 Street, Suite 201 Deerfield Beach, FL 33441-5634 or by calling 1-800-965-8307
or 954-785-1121.
|
|
|