You are not logged in.
This means you
CAN ONLY VIEW reports that were published prior to Saturday, March 29, 2025.
You
MUST UPGRADE YOUR MEMBERSHIP if you want to see any current reports.
AFTER MARKET UPDATE - WEDNESDAY, JANUARY 18TH, 2017
Previous After Market Report Next After Market Report >>>
|
|
|
|
DOW |
-22.05 |
19,804.72 |
-0.11% |
|
Volume |
912,815,640 |
-18% |
|
Volume |
1,524,935,930 |
-4% |
|
NASDAQ |
+16.92 |
5,555.65 |
+0.31% |
|
Advancers |
1,564 |
54% |
|
Advancers |
1,679 |
57% |
|
S&P 500 |
+4.00 |
2,271.89 |
+0.18% |
|
Decliners |
1,353 |
46% |
|
Decliners |
1,277 |
43% |
|
Russell 2000 |
+6.23 |
1,358.56 |
+0.46% |
|
52 Wk Highs |
79 |
|
|
52 Wk Highs |
82 |
|
|
S&P 600 |
+4.15 |
832.57 |
+0.50% |
|
52 Wk Lows |
13 |
|
|
52 Wk Lows |
30 |
|
|
 |
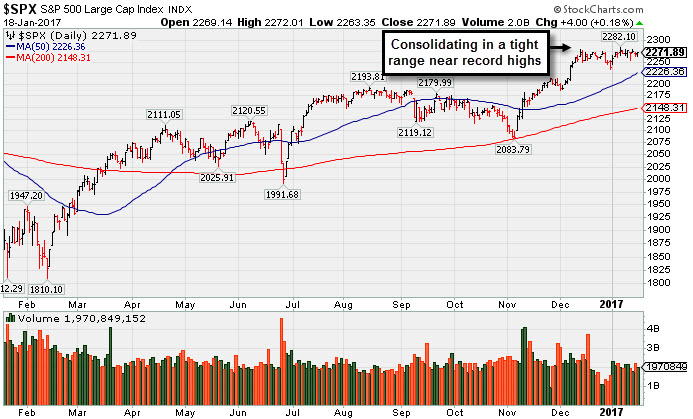
Mixed Indices Show Little Conviction Still Perched Near Record Highs
Kenneth J. Gruneisen - Passed the CAN SLIM® Master's Exam
Stocks finished mixed on Wednesday. The Dow was down 22 points to 19804. The S&P 500 added 4 points to 2271 and the Nasdaq Composite gained 16 points to 5555. Volume totals were lighter than the prior session totals on the NYSE and on the Nasdaq exchange. Breadth was slightly positive as advancers led decliners by an 8-7 margin on the NYSE and by a 4-3 margin on the Nasdaq exchange. There were 15 high-ranked companies from the Leaders List that made new 52-week highs and were listed on the BreakOuts Page, versus the total of 13 on the prior session. New 52-week highs totals contracted yet still outnumbered new 52-week lows on both the NYSE and the Nasdaq exchange.
PICTURED: The S&P 500 Index has been consolidating in a tight range near its record high. Its 50-day moving average (DMA) line defines near-term support above prior highs.
Near record high territory, the major averages (M criteria) are in a confirmed uptrend which has endured distributional pressure. New buying efforts should only be made in candidates with superior fundamental and technical characteristics. The Featured Stocks Page lists noteworthy high-ranked leaders.
The major averages fluctuated throughout the session Wednesday as investors digested commentary from Fed Chair Janet Yellen. In prepared remarks, Yellen stated that the U.S. economy is near the Federal Reserve’s target objectives. Treasury yields moved higher after the central bank reported the economy grew faster than expected at the end of last year, spurred by steady hiring. On the data front, a gauge of inflation showed that consumer prices rose 0.3% in December, in-line with expectations.
Six of 11 sectors in the S&P 500 finished in positive territory. Financials paced the gains with Bank of America (BAC +2.63%) rising. Goldman Sachs (GS -0.62%) fell despite the investment bank posting better-than-expected quarterly profit on strong fixed-income trading revenue. In earnings, Fastenal (FAST +5.81%) rose after the company raised its dividend by 6.7%. Shares of Target (TGT -5.77%) fell as the retailer reported disappointing holiday season sales and cut its full-year outlook. In the media space, Pearson PLC (PSO -28.63%) fell after lowering its 2017 guidance below Street consensus.
Treasuries retreated with the benchmark 10-year note down 26/32 to yield 2.42%. In commodities, NYMEX WTI crude fell 2.3% to $51.30/barrel. In FOREX, the Dollar Index climbed 0.9. |
 Kenneth J. Gruneisen started out as a licensed stockbroker in August 1987, a couple of months prior to the historic stock market crash that took the Dow Jones Industrial Average down -22.6% in a single day. He has published daily fact-based fundamental and technical analysis on high-ranked stocks online for two decades. Through FACTBASEDINVESTING.COM, Kenneth provides educational articles, news, market commentary, and other information regarding proven investment systems that work in good times and bad.
Comments contained in the body of this report are technical opinions only and are not necessarily those of Gruneisen Growth Corp. The material herein has been obtained from sources believed to be reliable and accurate, however, its accuracy and completeness cannot be guaranteed. Our firm, employees, and customers may effect transactions, including transactions contrary to any recommendation herein, or have positions in the securities mentioned herein or options with respect thereto. Any recommendation contained in this report may not be suitable for all investors and it is not to be deemed an offer or solicitation on our part with respect to the purchase or sale of any securities. |
|
 |
Financial and Tech Groups Rose
Kenneth J. Gruneisen - Passed the CAN SLIM® Master's Exam
The Broker/Dealer Index ($XBD +1.03%) and Bank Index ($BKX +0.75%) both posted gains while the Retail Index ($RLX -0.40%) created a drag on the major indices on Wednesday. The tech sector had a positive bias as the Semiconductor Index ($SOX +1.42%) and the Biotechnology Index ($BTK +1.28%) both outpaced the Networking Index ($NWX +0.09%). The Gold & Silver Index ($XAU -1.27%) pulled back and energy-linked shares fell as the Integrated Oil Index ($XOI -0.45%) and the Oil Services Index ($OSX -0.33%) both edged lower. Charts courtesy www.stockcharts.com
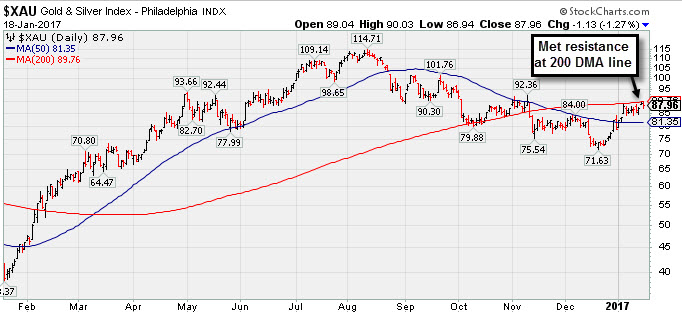 PICTURED: The Gold & Silver Index ($XAU -1.27%) rebounded from its December 2016 lows and is consolidating above its 50-day moving average (DMA) line, but it has recently been meeting resistance at its 200 DMA line.
| Oil Services |
$OSX |
186.69 |
-0.61 |
-0.33% |
+1.58% |
| Integrated Oil |
$XOI |
1,266.28 |
-5.73 |
-0.45% |
-0.13% |
| Semiconductor |
$SOX |
922.36 |
+12.88 |
+1.42% |
+1.75% |
| Networking |
$NWX |
441.73 |
+0.40 |
+0.09% |
-0.98% |
| Broker/Dealer |
$XBD |
210.24 |
+2.15 |
+1.03% |
+2.42% |
| Retail |
$RLX |
1,382.57 |
-5.50 |
-0.40% |
+2.95% |
| Gold & Silver |
$XAU |
87.96 |
-1.14 |
-1.28% |
+11.54% |
| Bank |
$BKX |
90.59 |
+0.68 |
+0.76% |
-1.31% |
| Biotech |
$BTK |
3,216.40 |
+40.57 |
+1.28% |
+4.60% |
|
|
|
 |
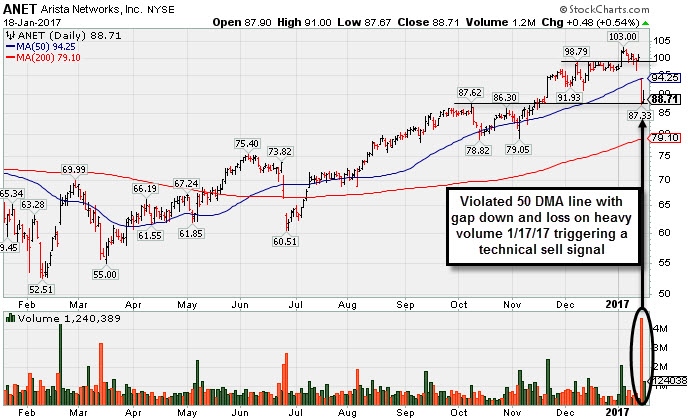
Technical Damages Raised Concern and Triggered Technical Sell Signal
Kenneth J. Gruneisen - Passed the CAN SLIM® Master's Exam
Arista Networks Inc (ANET +$0.48 or +0.54% to $88.71) gapped down on the prior session violating its 50-day moving average (DMA) line also undercutting prior lows in the $91 area. The damaging loss on heavy volume raised concerns and triggered a technical sell signal. It halted its slide near prior highs in the $87 area. However, a prompt rebound above its 50 DMA line ($94.25) is needed for its outlook to improve.
It was last shown in this FSU section on 12/20/16 with an annotated graph under the headline, "Holding Ground After Rally More Than 5% Beyond Prior Highs". It was highlighted in yellow with pivot point cited based on its 2015 high plus 10 cents in the 11/21/16 mid-day report (read here). Disciplined investors know that risk increases when chasing a stock more than +5% above its pivot point. In all cases, stocks that fall more than 8% from your purchase price should be sold to prevent a small loss from potentially becoming a more devastating loss.
ANET has shown strong and steady increases in quarterly sales revenues while earnings have routinely been well above the +25% minimum guideline (C criteria) through the Sep '16 quarter. Its annual earnings (A criteria) growth has been strong, however, its history is limited since its $43 IPO in June of 2014.
The number of top-rated funds owning its shares rose from 360 in Dec '15 to 439 in Dec '16, a reassuring sign concerning the I criteria. The high-ranked Computer - Networking firm has a Timeliness Rating of A and a Sponsorship Rating of C. Its small supply of 34.4 million shares (S criteria) in the public float may contribute to greater volatility in the event of institutional buying or selling.
|
|
|
Color Codes Explained :
Y - Better candidates highlighted by our
staff of experts.
G - Previously featured
in past reports as yellow but may no longer be buyable under the
guidelines.
***Last / Change / Volume data in this table is the closing quote data***
Symbol/Exchange
Company Name
Industry Group |
PRICE |
CHANGE
(%Change) |
Day High |
Volume
(% DAV)
(% 50 day avg vol) |
52 Wk Hi
% From Hi |
Featured
Date |
Price
Featured |
Pivot Featured |
|
Max Buy |
CSFL
-
NASDAQ
Centerstate Banks Inc
Banks-Southeast
|
$24.61
|
+0.12
0.49% |
$24.63
|
208,450
67.90% of 50 DAV
50 DAV is 307,000
|
$25.83
-4.74%
|
10/10/2016
|
$18.20
|
PP = $18.37
|
|
MB = $19.29
|
Most Recent Note - 1/17/2017 2:33:38 PM
G - Completed a new Public Offering of shares on 1/10/17 during its orderly consolidation perched near all-time highs. Its 50 DMA line ($23.38) defines near-term support above prior highs in the $19 area.
>>> FEATURED STOCK ARTICLE : Bank Stock Perched Near Record Highs After Considerable Rally - 1/4/2017 |
View all notes |
Set NEW NOTE alert |
Company Profile |
SEC
News |
Chart |
Request a new note
C
A
S
I |
IESC
-
NASDAQ
I E S Holdings Inc
Bldg-Maintenance and Svc
|
$18.50
|
+0.20
1.09% |
$18.55
|
41,524
46.14% of 50 DAV
50 DAV is 90,000
|
$23.00
-19.57%
|
11/23/2016
|
$19.35
|
PP = $18.26
|
|
MB = $19.17
|
 Most Recent Note - 1/18/2017 6:02:53 PM
G - Posted a small gain today with light volume, remaining below its 50 DMA line. More damaging losses would trigger a worrisome technical sell signal. Only a prompt rebound above the 50 DMA line ($19.14) would help its outlook improve.
>>> FEATURED STOCK ARTICLE : Consolidating After Strong Sep '16 Quarterly Earnings News - 12/21/2016 |
View all notes |
Set NEW NOTE alert |
Company Profile |
SEC
News |
Chart |
Request a new note
C
A
S
I |
BERY
-
NYSE
Berry Plastics Group Inc
CONSUMER NON-DURABLES - Packaging and Containers
|
$51.61
|
+0.71
1.39% |
$51.68
|
1,207,626
91.49% of 50 DAV
50 DAV is 1,320,000
|
$51.68
-0.14%
|
11/30/2016
|
$50.26
|
PP = $46.47
|
|
MB = $48.79
|
Most Recent Note - 1/18/2017 6:06:35 PM
G - Posted a gain with near average volume today for its best-ever close. Consolidating in an orderly fashion with volume totals cooling since its 11/29/16 breakout. Insider buying reported in recent weeks is a reassuring sign. Its 50 DMA line ($48.66) defines support to watch above prior highs in the $46 area.
>>> FEATURED STOCK ARTICLE : Orderly Consolidation Continues Well Above Support - 1/3/2017 |
View all notes |
Set NEW NOTE alert |
Company Profile |
SEC
News |
Chart |
Request a new note
C
A
S
I |
EVR
-
NYSE
Evercore Partners Inc
FINANCIAL SERVICES - Investment Banking
|
$73.05
|
+0.60
0.83% |
$73.10
|
324,060
70.91% of 50 DAV
50 DAV is 457,000
|
$74.10
-1.42%
|
1/5/2017
|
$71.40
|
PP = $72.07
|
|
MB = $75.67
|
Most Recent Note - 1/17/2017 2:31:28 PM
Y - Recently wedged higher with gains lacking volume after a new pivot point was cited based on its 12/08/16 high plus 10 cents. Gains above a pivot point must have a minimum of +40% above average volume to trigger a proper new (or add-on) technical buy signal. Its 50 DMA line ($67.53 defines important support above prior highs.
>>> FEATURED STOCK ARTICLE : Perched Near All-Time High Building New Flat Base - 1/5/2017 |
View all notes |
Set NEW NOTE alert |
Company Profile |
SEC
News |
Chart |
Request a new note
C
A
S
I |
HTHT
-
NASDAQ
China Lodging Group Ads
LEISURE - Lodging
|
$50.01
|
-1.32
-2.57% |
$51.99
|
90,891
50.78% of 50 DAV
50 DAV is 179,000
|
$54.23
-7.78%
|
9/29/2016
|
$46.12
|
PP = $47.82
|
|
MB = $50.21
|
Most Recent Note - 1/18/2017 6:01:14 PM
G - Consolidating above support at its 50 DMA line ($48.82). The prior low ($45.61 on 12/20/16) defines the next important near-term support level. Repeatedly noted with caution in prior reports - "Reported earnings +10% on +6% sales revenues for the Sep '16 quarter, below the +25% minimum earnings guideline (C criteria), raising concerns." See the latest FSU analysis for more details and a new annotated graph.
>>> FEATURED STOCK ARTICLE : Slump Below "Max Buy" Level But Fundamental Concerns Were Raised - 1/6/2017 |
View all notes |
Set NEW NOTE alert |
Company Profile |
SEC
News |
Chart |
Request a new note
C
A
S
I |
Symbol/Exchange
Company Name
Industry Group |
PRICE |
CHANGE
(%Change) |
Day High |
Volume
(% DAV)
(% 50 day avg vol) |
52 Wk Hi
% From Hi |
Featured
Date |
Price
Featured |
Pivot Featured |
|
Max Buy |
DW
-
NYSE
LCI Industries
MATERIALS and CONSTRUCTION - General Building Materials
|
$110.20
|
+0.70
0.64% |
$110.55
|
78,331
38.04% of 50 DAV
50 DAV is 205,900
|
$116.50
-5.41%
|
11/29/2016
|
$106.29
|
PP = $101.00
|
|
MB = $106.05
|
Most Recent Note - 1/17/2017 2:30:21 PM
G - Consolidating near its all-time high, well above support at prior highs in the $101-103 area and above its 50 DMA line ($104.43). Drew Industries (DW) announced a new name LCI Industries (LCII) and new trading symbol effective as of the market open on January 3, 2017.
>>> FEATURED STOCK ARTICLE : Consolidating Well Above Prior Highs and 50-Day Moving Average - 12/30/2016 |
View all notes |
Set NEW NOTE alert |
Company Profile |
SEC
News |
Chart |
Request a new note
C
A
S
I |
LMAT
-
NASDAQ
Lemaitre Vascular Inc
Medical-Products
|
$23.71
|
-0.14
-0.59% |
$24.16
|
76,459
51.66% of 50 DAV
50 DAV is 148,000
|
$27.04
-12.31%
|
12/22/2016
|
$24.99
|
PP = $25.09
|
|
MB = $26.34
|
Most Recent Note - 1/17/2017 2:40:39 PM
Y - Slumped back into the prior base raising concerns, enduring distributional pressure and testing support at its 50 DMA line ($23.82). More damaging losses would raise serious concerns and trigger a technical sell signal. Wedged to new highs with a gain backed by +46% above average volume on 1/10/17, rallying above the pivot point cited based on its 11/17/16 high plus 10 cents.
>>> FEATURED STOCK ARTICLE : Built an Orderly Base-On-Base Pattern - 12/23/2016 |
View all notes |
Set NEW NOTE alert |
Company Profile |
SEC
News |
Chart |
Request a new note
C
A
S
I |
BEAT
-
NASDAQ
BioTelemetry Inc
Medical-Services
|
$21.70
|
-0.10
-0.46% |
$21.80
|
258,820
81.91% of 50 DAV
50 DAV is 316,000
|
$24.10
-9.96%
|
12/19/2016
|
$22.91
|
PP = $21.78
|
|
MB = $22.87
|
Most Recent Note - 1/18/2017 6:05:20 PM
Y - Consolidating near prior highs in the $21-22 area which define initial support to watch above its 50 DMA line ($20.62). More damaging losses leading to violations may trigger technical sell signals.
>>> FEATURED STOCK ARTICLE : Volume Totals Cooling While Consolidating Above Prior Highs - 1/10/2017 |
View all notes |
Set NEW NOTE alert |
Company Profile |
SEC
News |
Chart |
Request a new note
C
A
S
I |
PATK
-
NASDAQ
Patrick Industries Inc
WHOLESALE - Building Materials Wholesale
|
$81.20
|
+0.45
0.56% |
$81.65
|
82,815
68.44% of 50 DAV
50 DAV is 121,000
|
$81.65
-0.55%
|
11/29/2016
|
$72.45
|
PP = $69.63
|
|
MB = $73.11
|
Most Recent Note - 1/17/2017 2:35:07 PM
G - Perched near all-time highs, stubbornly holding its ground, extended from its prior base. Prior highs in the $69 area and its 50 DMA line ($71.62) define support to watch on pullbacks.
>>> FEATURED STOCK ARTICLE : Stubbornly Held Ground and Rose Since Featured Again - 12/28/2016 |
View all notes |
Set NEW NOTE alert |
Company Profile |
SEC
News |
Chart |
Request a new note
C
A
S
I |
ANET
-
NYSE
"Arista Networks, Inc"
TELECOMMUNICATIONS - Communication Equipment
|
$88.71
|
+0.48
0.54% |
$91.00
|
1,240,389
145.62% of 50 DAV
50 DAV is 851,800
|
$103.00
-13.87%
|
12/30/2016
|
$96.77
|
PP = $99.00
|
|
MB = $103.95
|
Most Recent Note - 1/18/2017 6:00:17 PM
G - Halted its slide today after a damaging gap down on the prior session violated its 50 DMA line triggering a technical sell signal. A prompt rebound above its 50 DMA line ($94.25) is needed for its outlook to improve. See the latest FSU analysis for more details and a new annotated graph.
>>> FEATURED STOCK ARTICLE : Technical Damages Raised Concern and Triggered Technical Sell Signal - 1/18/2017 |
View all notes |
Set NEW NOTE alert |
Company Profile |
SEC
News |
Chart |
Request a new note
C
A
S
I |
Symbol/Exchange
Company Name
Industry Group |
PRICE |
CHANGE
(%Change) |
Day High |
Volume
(% DAV)
(% 50 day avg vol) |
52 Wk Hi
% From Hi |
Featured
Date |
Price
Featured |
Pivot Featured |
|
Max Buy |
SFBS
-
NASDAQ
Servisfirst Bancshares
BANKING - Regional - Southeast Banks
|
$37.21
|
+0.62
1.69% |
$37.36
|
107,499
36.44% of 50 DAV
50 DAV is 295,000
|
$38.65
-3.73%
|
7/19/2016
|
$26.64
|
PP = $26.41
|
|
MB = $27.73
|
Most Recent Note - 1/17/2017 2:37:47 PM
G - Consolidating near its high. Recent low and its 50 DMA line define important near-term support in the $35 area where subsequent violations would raise concerns.
>>> FEATURED STOCK ARTICLE : Stubbornly Holding Ground Near Highs - 1/12/2017 |
View all notes |
Set NEW NOTE alert |
Company Profile |
SEC
News |
Chart |
Request a new note
C
A
S
I |
|
|
|
THESE ARE NOT BUY RECOMMENDATIONS!
Comments contained in the body of this report are technical
opinions only. The material herein has been obtained
from sources believed to be reliable and accurate, however,
its accuracy and completeness cannot be guaranteed.
This site is not an investment advisor, hence it does
not endorse or recommend any securities or other investments.
Any recommendation contained in this report may not
be suitable for all investors and it is not to be deemed
an offer or solicitation on our part with respect to
the purchase or sale of any securities. All trademarks,
service marks and trade names appearing in this report
are the property of their respective owners, and are
likewise used for identification purposes only.
This report is a service available
only to active Paid Premium Members.
You may opt-out of receiving report notifications
at any time. Questions or comments may be submitted
by writing to Premium Membership Services 665 S.E. 10 Street, Suite 201 Deerfield Beach, FL 33441-5634 or by calling 1-800-965-8307
or 954-785-1121.
|
|
|