You are not logged in.
This means you
CAN ONLY VIEW reports that were published prior to Thursday, March 20, 2025.
You
MUST UPGRADE YOUR MEMBERSHIP if you want to see any current reports.
AFTER MARKET UPDATE - TUESDAY, FEBRUARY 2ND, 2021
Previous After Market Report Next After Market Report >>>
|
|
|
|
DOW |
+475.57 |
30,687.48 |
+1.57% |
|
Volume |
1,121,872,933 |
+7% |
|
Volume |
7,191,260,700 |
+3% |
|
NASDAQ |
+209.83 |
13,613.22 |
+1.57% |
|
Advancers |
2,406 |
76% |
|
Advancers |
2,821 |
74% |
|
S&P 500 |
+52.45 |
3,826.31 |
+1.39% |
|
Decliners |
754 |
24% |
|
Decliners |
1,015 |
26% |
|
Russell 2000 |
+25.28 |
2,151.44 |
+1.19% |
|
52 Wk Highs |
132 |
|
|
52 Wk Highs |
217 |
|
|
S&P 600 |
+21.54 |
1,212.08 |
+1.81% |
|
52 Wk Lows |
0 |
|
|
52 Wk Lows |
6 |
|
|
 |
Breadth Positive With More Leadership as Major Indices Rose
Kenneth J. Gruneisen - Passed the CAN SLIM® Master's Exam
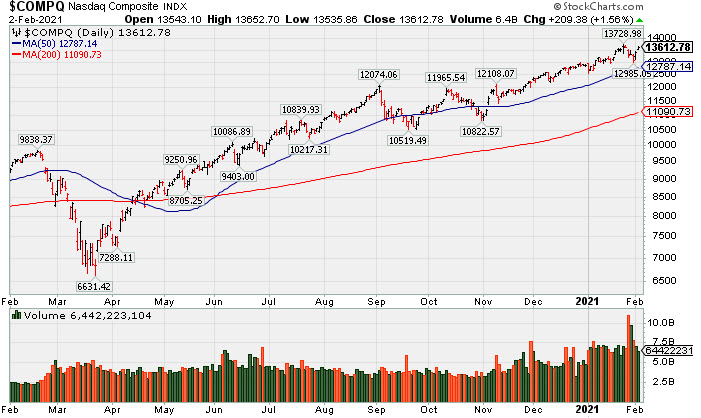
The Dow jumped 475 points, while the S&P 500 advanced 1.4%. The Nasdaq Composite gained 1.6%. The volume totals were higher than the prior session on the NYSE and on the Nasdaq exchange. Advancers led decliners by more than a 3-1 margin on the NYSE and nearly 3-1 on the Nasdaq exchange. There were 49 high-ranked companies from the Leaders List that hit new 52-week highs and were listed on the BreakOuts Page, versus the total of 31 on the prior session. New 52-week highs totals expanded and easily outnumbered the new 52-week lows totals which were in the single digits on both exchanges. The major indices clearly saw their uptrend come under pressure (M criteria) last week while leadership thinned. Investors are reminded to always make buying and selling decisions based based on the strict criteria and rules of the fact-based investment system. PICTURED: The Nasdaq Composite found support well above its 50-day moving average (DMA) line. More damaging volume-driven losses would raise concerns.
U.S. stocks rallied on Tuesday, posting back-to-back daily gains as investors assessed earnings results and awaited profit tallies from two of the S&P 500's largest companies (Amazon and Alphabet) after the closing bell.
Meanwhile, silver shed nearly 10% after climbing to an eight-year high on the best session in more than a decade on Monday. The sell-off in the precious metal tracked a retreat by a number of the small cap stocks recently favored by retail traders. Elsewhere in commodities, WTI crude jumped 2.3% to $54.78/barrel, rising to the highest level in over a year on signs of tightening global supplies. Treasuries declined amid the perceived “risk on” mood, with the yield on the 10-year note adding three basis points to 1.10%. Gold slipped 1.5% to $1833.10/ounce.
All 11 S&P 500 sectors ended in positive territory, with seven groups climbing more than 1%. Financials paced the gains amid a jump in Treasury yields. Industrials also outperformed with UPS (UPS +2.56%) after besting analyst profit and sales projections for the holiday quarter. In other earnings, Exxon Mobil (XOM +1.58%) rose after the oil giant tripled consensus earnings expectations but missed revenue estimates. Elsewhere, Alibaba (BABA -3.85%) fell despite beating Wall Street expectations on the top and bottom line amid growth in online users and profitability for the first time in its cloud computing division. In M&A news, shares of Hormel Foods (HRL +3.90%) rose on news that it may acquire Kraft Heinz’s (KHC -0.27%) Planters peanut brand. |
 Kenneth J. Gruneisen started out as a licensed stockbroker in August 1987, a couple of months prior to the historic stock market crash that took the Dow Jones Industrial Average down -22.6% in a single day. He has published daily fact-based fundamental and technical analysis on high-ranked stocks online for two decades. Through FACTBASEDINVESTING.COM, Kenneth provides educational articles, news, market commentary, and other information regarding proven investment systems that work in good times and bad.
Comments contained in the body of this report are technical opinions only and are not necessarily those of Gruneisen Growth Corp. The material herein has been obtained from sources believed to be reliable and accurate, however, its accuracy and completeness cannot be guaranteed. Our firm, employees, and customers may effect transactions, including transactions contrary to any recommendation herein, or have positions in the securities mentioned herein or options with respect thereto. Any recommendation contained in this report may not be suitable for all investors and it is not to be deemed an offer or solicitation on our part with respect to the purchase or sale of any securities. |
|
 |
Financial, Retail, Tech, and Energy Groups Rose; Gold & Silver Index Falls
Kenneth J. Gruneisen - Passed the CAN SLIM® Master's Exam
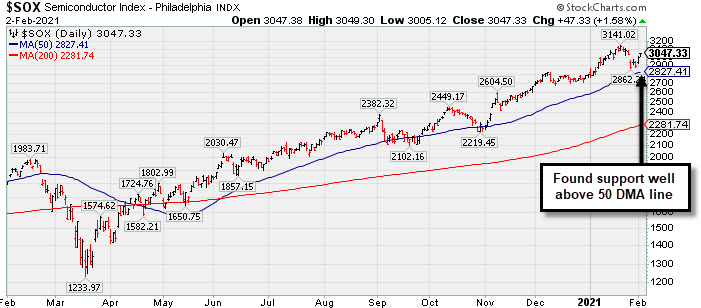
The Bank Index ($BKX +2.69%) and Broker/Dealer Index ($XBD +1.93%) both posted solid gains and the Retail Index ($RLX +1.43%) also helped boost the major indices. The tech sector had a positive bias as the Semiconductor Index ($SOX +1.60%) and Biotech Index ($BTK +1.21%) both posted solid gains, meanwhile, the Networking Index ($NWX -0.18%) ended slightly lower. The Oil Services Index ($OSX +0.60%) and Integrated Oil Index ($XOI +0.90%) edged higher, meanwhile, the Gold & Silver Index ($XAU -4.92%) was a standout decliner.
PICTURED: The Semiconductor Index ($SOX +1.60%) found support well above its 50-day moving average (DMA) line after last week's pullback.
| Oil Services |
$OSX |
47.55 |
+0.28 |
+0.60% |
+7.26% |
| Integrated Oil |
$XOI |
825.79 |
+7.34 |
+0.90% |
+4.20% |
| Semiconductor |
$SOX |
3,047.96 |
+47.97 |
+1.60% |
+9.03% |
| Networking |
$NWX |
781.80 |
-1.39 |
-0.18% |
+9.02% |
| Broker/Dealer |
$XBD |
398.43 |
+7.54 |
+1.93% |
+5.52% |
| Retail |
$RLX |
3,663.82 |
+51.58 |
+1.43% |
+2.82% |
| Gold & Silver |
$XAU |
139.12 |
-7.20 |
-4.92% |
-3.52% |
| Bank |
$BKX |
101.42 |
+2.66 |
+2.69% |
+3.59% |
| Biotech |
$BTK |
6,141.30 |
+73.66 |
+1.21% |
+7.01% |
|
|
|
 |
Extended From Prior Base Following Streak fo Volume-Driven Gains
Kenneth J. Gruneisen - Passed the CAN SLIM® Master's Exam
Axon Enterprise Inc (AXON +$0.38 or +0.23% to $166.53) is very extended from any sound base. The prior high ($134) defines important support coinciding with its 50-day moving average (DMA) line which acted as support during the recent consolidation. Fundamentals remain strong. Formerly this company's shares traded under the ticker symbol AAXN where prior notes and detailed analysis may be reviewed. It made considerable progress since last shown in this FSU section on 1/15/21 with an annotated graph under the headline, "Hit New Highs With Streak of Big Volume-Driven Gains".
The company has a small supply of only 63.5 million shares outstanding (S criteria) which can contribute to greater price volatility in the event of institutional buying or selling. The number of top-rated funds owning its shares rose from 400 in Sep '19 to 569 in Dec '20, a reassuring sign concerning the I criteria. AXON has a Timeliness Rating of B and an Accumulation/Distribution Rating of A+. The Security/Safety industry group currently has a Group Relative Strength Rating of B+ (73). AXON completed a new Pubic Offering on 6/17/20. Such offerings often hinder price progress temporarily, yet they help companies attract greater institutional ownership interest (I criteria).
It reported Sep '20 quarterly earnings +43% on +27% sales revenues versus the year ago period. Four of the past 5 quarterly comparisons versus the year ago periods showed earnings increases above the +25% minimum guideline (C criteria) with strong underlying sales revenues increases. Its annual earnings (A criteria) history has also been strong, helping it get an 84 Earnings Per Share Rating. |
|
|
Color Codes Explained :
Y - Better candidates highlighted by our
staff of experts.
G - Previously featured
in past reports as yellow but may no longer be buyable under the
guidelines.
***Last / Change / Volume data in this table is the closing quote data***
Symbol/Exchange
Company Name
Industry Group |
PRICE |
CHANGE
(%Change) |
Day High |
Volume
(% DAV)
(% 50 day avg vol) |
52 Wk Hi
% From Hi |
Featured
Date |
Price
Featured |
Pivot Featured |
|
Max Buy |
 CRL
-
NYSE
CRL
-
NYSE
Charles River Labs Intl
DRUGS - Biotechnology
|
$272.40
|
+6.40
2.41% |
$274.76
|
287,623
101.96% of 50 DAV
50 DAV is 282,100
|
$284.60
-4.29%
|
12/17/2020
|
$247.06
|
PP = $257.98
|
|
MB = $270.88
|
Most Recent Note - 2/1/2021 12:39:35 PM
Y - Losses last week tested important support at the prior high ($257) and its 50 DMA line ($251). Reported Sep '20 quarterly earnings +38% on +11% sales revenues versus the year ago period, above the +25% minimum earnings guideline (C criteria).
>>> FEATURED STOCK ARTICLE : Testing Important Support on Pullback - 1/29/2021 |
View all notes |
Set NEW NOTE alert |
Company Profile |
SEC
News |
Chart |
Request a new note
C
A
S
I |
AMD
-
NYSE
Advanced Micro Devices
ELECTRONICS - Semiconductor - Broad Line
|
$88.86
|
+1.20
1.37% |
$89.28
|
33,687,934
75.31% of 50 DAV
50 DAV is 44,730,800
|
$99.23
-10.45%
|
11/18/2020
|
$82.54
|
PP = $88.72
|
|
MB = $93.16
|
 Most Recent Note - 2/2/2021 5:34:58 PM
G - Posted a small gain today on very light volume. Fundamentals remain strong after it reported Dec '20 quarterly earnings +63% on +53% sales revenues versus the year ago period. Damaging volume-driven losses recently violated the 50 DMA line ($91.52) hurting its outlook. A rebound above the 50 DMA line is needed for its outlook to improve. Its current Relative Strength rating of 70 is still below the 80+ minimum guideline for buy candidates.
>>> FEATURED STOCK ARTICLE : Distributional Pressure Brings Pullback Below "Max Buy" Level - 1/13/2021 |
View all notes |
Set NEW NOTE alert |
Company Profile |
SEC
News |
Chart |
Request a new note
C
A
S
I |
AMRC
-
NYSE
Ameresco Inc Cl A
ENERGY - Alternative
|
$63.25
|
+3.99
6.73% |
$64.60
|
695,583
158.09% of 50 DAV
50 DAV is 440,000
|
$63.45
-0.32%
|
12/15/2020
|
$46.72
|
PP = $47.10
|
|
MB = $49.46
|
Most Recent Note - 2/2/2021 12:38:43 PM
G - Hitting a new all-time high with today's big gain. It did not form a sound base of sufficient length. Its 50-day moving average (DMA) line ($51.29) defines near-term support to watch above prior highs in the $46-47 area. See the latest FSU analysis for more details and an annotated graph.
>>> FEATURED STOCK ARTICLE : Rebounding After Retreat From Record High - 2/1/2021 |
View all notes |
Set NEW NOTE alert |
Company Profile |
SEC
News |
Chart |
Request a new note
C
A
S
I |
TREX
-
NYSE
Trex Company Inc
MATERIALS and CONSTRUCTION - General Building Materials
|
$96.96
|
+1.20
1.25% |
$97.79
|
694,785
100.55% of 50 DAV
50 DAV is 691,000
|
$104.35
-7.08%
|
6/26/2020
|
$54.53
|
PP = $66.47
|
|
MB = $69.79
|
Most Recent Note - 2/1/2021 4:48:34 PM
G - Rebounded toward its all-time high with today's big gain on average volume after a streak of 4 straight volume-driven losses. Its 50 DMA line ($84.15) and prior highs in the $80-81 area define important support to watch on pullbacks. Sep '20 quarterly earnings were +14% on +19% sales revenues versus the year ago period, below the +25% minimum guideline (C criteria) raising fundamental concerns.
>>> FEATURED STOCK ARTICLE : Hit New All-Time High With Gain Backed by Average Volume - 1/19/2021 |
View all notes |
Set NEW NOTE alert |
Company Profile |
SEC
News |
Chart |
Request a new note
C
A
S
I |
CLFD
-
NASDAQ
Clearfield Inc
TELECOMMUNICATIONS - Cables / Satalite Equipment
|
$31.81
|
-1.72
-5.13% |
$33.88
|
240,450
195.49% of 50 DAV
50 DAV is 123,000
|
$37.54
-15.26%
|
1/20/2021
|
$31.38
|
PP = $28.42
|
|
MB = $29.84
|
Most Recent Note - 2/1/2021 12:37:42 PM
G - Extended from any sound base after a streak of volume-driven gains. Prior highs in the $28 area define initial support to watch above its 50 DMA line ($26.52). Reported Dec '20 quarterly earnings +475% on +40% sales revenues versus the year ago period, continuing its strong earning track record.
>>> FEATURED STOCK ARTICLE : Perched Near Record High With Earnings Report Due Soon - 1/27/2021 |
View all notes |
Set NEW NOTE alert |
Company Profile |
SEC
News |
Chart |
Request a new note
C
A
S
I |
Symbol/Exchange
Company Name
Industry Group |
PRICE |
CHANGE
(%Change) |
Day High |
Volume
(% DAV)
(% 50 day avg vol) |
52 Wk Hi
% From Hi |
Featured
Date |
Price
Featured |
Pivot Featured |
|
Max Buy |
NOW
-
NYSE
Servicenow Inc
Computer Sftwr-Enterprse
|
$583.51
|
+24.95
4.47% |
$588.82
|
2,233,883
166.60% of 50 DAV
50 DAV is 1,340,900
|
$566.74
2.96%
|
8/20/2020
|
$453.34
|
PP = $454.79
|
|
MB = $477.53
|
Most Recent Note - 2/2/2021 12:08:06 PM
G - Hitting new 52-week and all-time highs with today's big volume-driven gain clearing a new 6-week flat base. A new pivot point is not being cited due to fundamental concerns noted as its impressive rally has continued. Gapped up on 1/28/21 promptly rebounding above its 50 DMA line ($535) and challenging its prior high. Fundamental concerns remain after it reported Dec '20 quarterly earnings +22% on +31% sales revenues versus the year ago period, its 2nd consecutive comparison below the +25% minimum guideline (C criteria) of the fact-based investment system.
>>> FEATURED STOCK ARTICLE : Gain Today and Rebound Above 50-Day Moving Average Line - 1/8/2021 |
View all notes |
Set NEW NOTE alert |
Company Profile |
SEC
News |
Chart |
Request a new note
C
A
S
I |
SMPL
-
NASDAQ
Simply Good Foods Co
Food-Confectionery
|
$29.86
|
+0.77
2.65% |
$29.97
|
428,271
34.30% of 50 DAV
50 DAV is 1,248,700
|
$32.03
-6.77%
|
12/28/2020
|
$30.40
|
PP = $31.44
|
|
MB = $33.01
|
Most Recent Note - 2/1/2021 4:46:20 PM
G - Posted another gain today with much lighter than average volume. Its Relative Strength Rating is 74, still below the 80+ minimum guideline. Its 50 DMA line ($26.68) and prior low ($26.78) define near term support in the area to watch.
>>> FEATURED STOCK ARTICLE : Relative Strength Rating Suffered During Stalling Action - 1/21/2021 |
View all notes |
Set NEW NOTE alert |
Company Profile |
SEC
News |
Chart |
Request a new note
C
A
S
I |
ALRM
-
NASDAQ
Alarm.com Holdings Inc
Security/Sfty
|
$96.50
|
+0.94
0.98% |
$97.19
|
391,634
84.77% of 50 DAV
50 DAV is 462,000
|
$108.67
-11.20%
|
11/6/2020
|
$71.88
|
PP = $74.76
|
|
MB = $78.50
|
Most Recent Note - 1/29/2021 5:10:29 PM
G - It was down again today with lighter than average volume, slumping near the 50 DMA line ($89.52) which defines important near-term support to watch.
>>> FEATURED STOCK ARTICLE : Encountered Distributional Pressure After Big Rally - 1/20/2021 |
View all notes |
Set NEW NOTE alert |
Company Profile |
SEC
News |
Chart |
Request a new note
C
A
S
I |
TEAM
-
NASDAQ
Atlassian Corp Plc
Comp Sftwr-Spec Enterprs
|
$248.79
|
+13.92
5.93% |
$249.50
|
1,436,171
89.99% of 50 DAV
50 DAV is 1,595,900
|
$250.03
-0.50%
|
10/12/2020
|
$193.77
|
PP = $199.60
|
|
MB = $209.58
|
Most Recent Note - 1/29/2021 12:50:46 PM
G - Sputtering below its 50 DMA line ($228) which acted as resistance after a violation raised concerns. Recent low ($208.62 on 1/27/21) defines important near-term support to watch. Its current Relative Strength Rating is 62, below the +80 minimum guideline for buy candidates. Earnings rose +7% on +26% sales revenues for the Sep '20 quarter versus the year ago period, below the +25% minimum earnings guideline (C criteria), raising fundamental concerns.
>>> FEATURED STOCK ARTICLE : Relative Strength Rating Remains Below 80+ Minimum Guideline - 1/11/2021 |
View all notes |
Set NEW NOTE alert |
Company Profile |
SEC
News |
Chart |
Request a new note
C
A
S
I |
SHOP
-
NYSE
Shopify Inc Cl A
Computer Sftwr-Enterprse
|
$1,235.35
|
+90.42
7.90% |
$1,238.27
|
1,719,230
133.90% of 50 DAV
50 DAV is 1,284,000
|
$1,285.19
-3.88%
|
2/2/2021
|
$1,218.72
|
PP = $1,285.28
|
|
MB = $1,349.54
|
Most Recent Note - 2/2/2021 12:43:11 PM
Y - New pivot point is cited based on its 12/22/20 high plus 10 cents. Posting a big gain today with volume running at an above average pace. Faces little resistance due to overhead supply up to the $1,285 level. Subsequent gains and a close above the pivot point backed by at least +40% above average volume may trigger a new (or add-on) technical buy signal. Found prompt support near its 50 DMA line ($1,123). Prior low ($1,076 on 1/06/21) defines the next important support to watch.
>>> FEATURED STOCK ARTICLE : Rebounded After Undercutting Prior Highs - 1/7/2021 |
View all notes |
Set NEW NOTE alert |
Company Profile |
SEC
News |
Chart |
Request a new note
C
A
S
I |
Symbol/Exchange
Company Name
Industry Group |
PRICE |
CHANGE
(%Change) |
Day High |
Volume
(% DAV)
(% 50 day avg vol) |
52 Wk Hi
% From Hi |
Featured
Date |
Price
Featured |
Pivot Featured |
|
Max Buy |
YETI
-
NYSE
Yeti Holdings Inc
Leisure-Products
|
$66.96
|
-0.18
-0.27% |
$68.73
|
1,177,126
87.52% of 50 DAV
50 DAV is 1,345,000
|
$80.89
-17.22%
|
11/5/2020
|
$57.25
|
PP = $55.14
|
|
MB = $57.90
|
Most Recent Note - 2/2/2021 5:37:54 PM
G - Recently sputtering below its 50 DMA line ($69.08) raising concerns and triggering a technical sell signal. Only a rebound above the 50 DMA line would help its outlook improve.
>>> FEATURED STOCK ARTICLE : 50-Day Moving Average and Prior Lows Define Near-Term Support - 1/22/2021 |
View all notes |
Set NEW NOTE alert |
Company Profile |
SEC
News |
Chart |
Request a new note
C
A
S
I |
BJ
-
NYSE
BJs Wholesale Club Hldgs
Retail-DiscountandVariety
|
$42.77
|
+0.29
0.68% |
$42.98
|
2,273,904
83.19% of 50 DAV
50 DAV is 2,733,400
|
$50.18
-14.77%
|
1/28/2021
|
$44.74
|
PP = $47.56
|
|
MB = $49.94
|
Most Recent Note - 1/29/2021 5:09:05 PM
Y - Suffered a 2nd consecutive loss today with above average volume. Finished weak on the prior session after highlighted in yellow with pivot point cited based on its 8/26/21 high. Abruptly retreated after a volume-driven breakout on the prior session capped a 7 session winning streak. See the latest FSU analysis for more details and an annotated graph.
>>> FEATURED STOCK ARTICLE : Pulled Back After Breakout Capped 7-Day Winning Streak - 1/28/2021 |
View all notes |
Set NEW NOTE alert |
Company Profile |
SEC
News |
Chart |
Request a new note
C
A
S
I |
DOCU
-
NASDAQ
Docusign Inc
Computer Sftwr-Enterprse
|
$239.84
|
+9.70
4.21% |
$242.08
|
3,047,929
85.52% of 50 DAV
50 DAV is 3,564,000
|
$290.23
-17.36%
|
1/12/2021
|
$253.50
|
PP = $256.10
|
|
MB = $268.91
|
Most Recent Note - 2/2/2021 12:46:06 PM
Y - Color code is changed to yellow as the gain today and rebound above the 50 DMA line ($235) helps its outlook improve. Faces some resistance due to overhead supply. The prior low ($216.50 on 1/04/21) defines the next important support to watch. Fundamentals remain strong.
>>> FEATURED STOCK ARTICLE : Twice Average Volume Behind Breakout Gain - 1/12/2021 |
View all notes |
Set NEW NOTE alert |
Company Profile |
SEC
News |
Chart |
Request a new note
C
A
S
I |
QTWO
-
NYSE
Q2 Holdings Inc
Computer Sftwr-Financial
|
$137.02
|
+5.97
4.56% |
$138.82
|
651,107
134.53% of 50 DAV
50 DAV is 484,000
|
$142.76
-4.02%
|
11/12/2020
|
$105.14
|
PP = $106.54
|
|
MB = $111.87
|
Most Recent Note - 2/2/2021 12:47:44 PM
G - Rebounding near the prior high with today's big gain, but it is extended from any sound base. Its 50 DMA line ($124) defines important near term support to watch on pullbacks.
>>> FEATURED STOCK ARTICLE : Perched Near All-Time High Stubbornly Holding Ground - 1/26/2021 |
View all notes |
Set NEW NOTE alert |
Company Profile |
SEC
News |
Chart |
Request a new note
C
A
S
I |
AXON
-
NASDAQ
Axon Enterprise Inc
Security/Sfty
|
$166.53
|
+0.38
0.23% |
$171.95
|
355,582
58.10% of 50 DAV
50 DAV is 612,000
|
$180.69
-7.84%
|
12/22/2020
|
$127.84
|
PP = $130.51
|
|
MB = $137.04
|
Most Recent Note - 2/2/2021 5:32:53 PM
G - Posted a 3rd consecutive small gain today with light volume, it is very extended from any sound base. Its 50 DMA line ($135.78) and prior high ($134) define important support to watch on pullbacks. Fundamentals remain strong. See the latest FSU analysis for more details and a new annotated graph. Formerly traded under the ticker symbol AAXN where prior notes and detailed analysis may be reviewed.
>>> FEATURED STOCK ARTICLE : Extended From Prior Base Following Streak fo Volume-Driven Gains - 2/2/2021 |
View all notes |
Set NEW NOTE alert |
Company Profile |
SEC
News |
Chart |
Request a new note
C
A
S
I |
Symbol/Exchange
Company Name
Industry Group |
PRICE |
CHANGE
(%Change) |
Day High |
Volume
(% DAV)
(% 50 day avg vol) |
52 Wk Hi
% From Hi |
Featured
Date |
Price
Featured |
Pivot Featured |
|
Max Buy |
|
|
|
THESE ARE NOT BUY RECOMMENDATIONS!
Comments contained in the body of this report are technical
opinions only. The material herein has been obtained
from sources believed to be reliable and accurate, however,
its accuracy and completeness cannot be guaranteed.
This site is not an investment advisor, hence it does
not endorse or recommend any securities or other investments.
Any recommendation contained in this report may not
be suitable for all investors and it is not to be deemed
an offer or solicitation on our part with respect to
the purchase or sale of any securities. All trademarks,
service marks and trade names appearing in this report
are the property of their respective owners, and are
likewise used for identification purposes only.
This report is a service available
only to active Paid Premium Members.
You may opt-out of receiving report notifications
at any time. Questions or comments may be submitted
by writing to Premium Membership Services 665 S.E. 10 Street, Suite 201 Deerfield Beach, FL 33441-5634 or by calling 1-800-965-8307
or 954-785-1121.
|
|
|