You are not logged in.
This means you
CAN ONLY VIEW reports that were published prior to Tuesday, March 25, 2025.
You
MUST UPGRADE YOUR MEMBERSHIP if you want to see any current reports.
AFTER MARKET UPDATE - MONDAY, JANUARY 4TH, 2021
Previous After Market Report Next After Market Report >>>
|
|
|
|
DOW |
-382.59 |
30,223.89 |
-1.25% |
|
Volume |
1,157,625,211 |
+44% |
|
Volume |
6,520,984,900 |
+36% |
|
NASDAQ |
-189.84 |
12,698.45 |
-1.47% |
|
Advancers |
909 |
29% |
|
Advancers |
1,571 |
43% |
|
S&P 500 |
-55.42 |
3,700.65 |
-1.48% |
|
Decliners |
2,175 |
71% |
|
Decliners |
2,100 |
57% |
|
Russell 2000 |
-28.94 |
1,945.91 |
-1.47% |
|
52 Wk Highs |
167 |
|
|
52 Wk Highs |
296 |
|
|
S&P 600 |
-12.00 |
1,106.93 |
-1.07% |
|
52 Wk Lows |
5 |
|
|
52 Wk Lows |
20 |
|
|
 |
Major Indices Start Year With Pullback From Record Highs
Kenneth J. Gruneisen - Passed the CAN SLIM® Master's Exam
The Dow and S&P 500 both fell from their all-time highs reached on Thursday, with the former slumping 382 points and the latter sliding 1.5%. The Nasdaq Composite also fell 1.5%, after posting its sharpest annual increase (+43.6%) since 2009. The volume totals were higher than the prior session volume totals on the NYSE and on the Nasdaq exchange. Breadth was negative as decliners led advancers by a 2-1 margin on the NYSE and 4-3 margin on the Nasdaq exchange. There were 59 high-ranked companies from the Leaders List that hit new 52-week highs and were listed on the BreakOuts Page, versus the total of 33 on the prior session. New 52-week highs totals expanded easily outnumbered the new 52-week lows totals on both exchanges. The major indices are in a confirmed uptrend (M criteria). Investors are reminded to always make buying and selling decisions based based on the strict criteria and rules of the fact-based investment system. PICTURED: The Dow Jones Industrial Average fell from its record high with a loss on higher volume.
Stocks ended firmly lower on the first trading session of the New Year, as spiking U.S. COVID-19 cases weighed on sentiment. Market participants also eyed tomorrow's special Senate run-off election in Georgia, which will determine the balance of power in the chamber.
Ten of 11 S&P 500 sectors finished in negative territory. Energy was the lone advancer, despite WTI crude falling 2.5% to $47.32/barrel. The Industrials group was a notable laggard, with shares of Boeing (BA -5.30%) fell after the jet maker was the subject of an analyst downgrade. In other corporate news, Tesla (TSLA +3.42%) rose after reporting it delivered a record number of vehicles in the fourth quarter. Teledyne Technologies (TDY -7.55%) fell on news it will acquire FLIR Systems (FLIR +19.19%) .
On the data front, a final reading on U.S. manufacturing activity for December from research firm Markit unexpectedly improved to 57.1 from the initial 56.5 reading. A separate update showed construction spending rose 0.9% in November. The balance of the week will feature a busy economic data slate, highlighted by Friday's monthly nonfarm labor report. Treasuries were mixed, with the yield on the 10-year note holding steady at 0.91%. |
 Kenneth J. Gruneisen started out as a licensed stockbroker in August 1987, a couple of months prior to the historic stock market crash that took the Dow Jones Industrial Average down -22.6% in a single day. He has published daily fact-based fundamental and technical analysis on high-ranked stocks online for two decades. Through FACTBASEDINVESTING.COM, Kenneth provides educational articles, news, market commentary, and other information regarding proven investment systems that work in good times and bad.
Comments contained in the body of this report are technical opinions only and are not necessarily those of Gruneisen Growth Corp. The material herein has been obtained from sources believed to be reliable and accurate, however, its accuracy and completeness cannot be guaranteed. Our firm, employees, and customers may effect transactions, including transactions contrary to any recommendation herein, or have positions in the securities mentioned herein or options with respect thereto. Any recommendation contained in this report may not be suitable for all investors and it is not to be deemed an offer or solicitation on our part with respect to the purchase or sale of any securities. |
|
 |
Gold & Silver Index Posts Standout Gain
Kenneth J. Gruneisen - Passed the CAN SLIM® Master's Exam
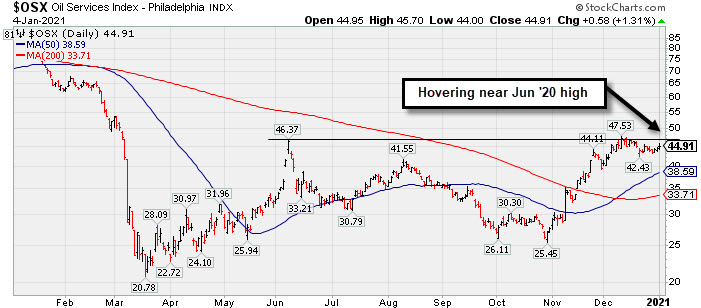
The Retail Index ($RLX -1.60%) ended lower and financial indexes weighed on the major indices as the Broker/Dealer Index ($XBD -1.37%) and Bank Index ($BKX -0.97%) fell. The Biotech Index ($BTK +0.04%) finished flat while the Semiconductor Index ($SOX -0.44%) edged lower and the Networking Index ($NWX -1.84%) led the tech sector's retreat. The Gold & Silver Index ($XAU +6.85%) posted a standout gain while the Oil Services Index ($OSX +1.31%) and Integrated Oil Index ($XOI +0.25%) each posted smaller gains.
PICTURED: The Oil Services Index ($OSX +1.31%) has been hovering near its June 2020 high.
| Oil Services |
$OSX |
44.91 |
+0.58 |
+1.31% |
+1.31% |
| Integrated Oil |
$XOI |
794.50 |
+2.02 |
+0.25% |
+0.26% |
| Semiconductor |
$SOX |
2,783.21 |
-12.29 |
-0.44% |
-0.44% |
| Networking |
$NWX |
703.90 |
-13.22 |
-1.84% |
-1.84% |
| Broker/Dealer |
$XBD |
372.42 |
-5.18 |
-1.37% |
-1.37% |
| Retail |
$RLX |
3,506.19 |
-57.07 |
-1.60% |
-1.60% |
| Gold & Silver |
$XAU |
154.07 |
+9.88 |
+6.85% |
+6.85% |
| Bank |
$BKX |
96.96 |
-0.95 |
-0.97% |
-0.97% |
| Biotech |
$BTK |
5,741.55 |
+2.54 |
+0.04% |
+0.04% |
|
|
|
 |
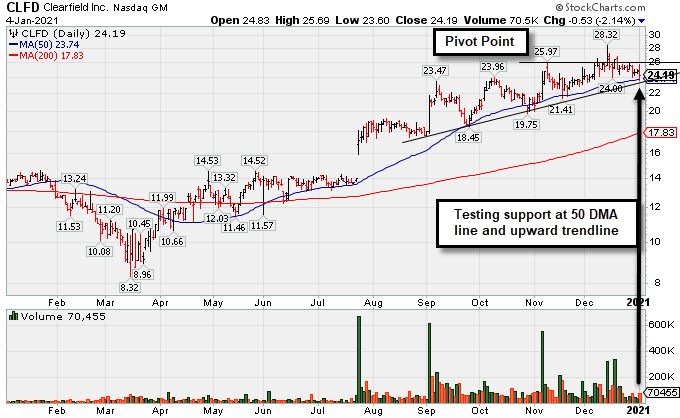
Distributional Pressure While Testing Important Chart Support
Kenneth J. Gruneisen - Passed the CAN SLIM® Master's Exam
Clearfield Inc (CLFD -$0.53 or -2.14% to $24.19) slumped further below the pivot point with today's big loss on near average volume. It tested near term support defined by its 50-day moving average (DMA) line ($23.7) and an upward trendline. More damaging losses may raise concerns and trigger a technical sell signal. It churned higher volume in recent weeks without making meaningful price progress, action indicative of distributional pressure.
The high-ranked TELECOMMUNICATIONS - Fiber Optics firm reported earnings +57% on +14% sales revenues for the Sep '20 quarter versus the year ago period, its 3rd consecutive quarterly earnings comparison above the +25% minimum guideline (C criteria). Annual earnings (A criteria) history has improved after a downturn in FY '17.
The number of top-rated funds owning its shares rose from 132 in Jun '20 to 134 in Sep '20. Its current Up/Down Volume Ratio of 1.7 is an unbiased indication its shares have been under accumulation over the past 50 days. It currently has a Timeliness Rating of B but a Sponsorship Rating of D. Its Accumulation/Distribution Rating is B.
|
|
|
Color Codes Explained :
Y - Better candidates highlighted by our
staff of experts.
G - Previously featured
in past reports as yellow but may no longer be buyable under the
guidelines.
***Last / Change / Volume data in this table is the closing quote data***
Symbol/Exchange
Company Name
Industry Group |
PRICE |
CHANGE
(%Change) |
Day High |
Volume
(% DAV)
(% 50 day avg vol) |
52 Wk Hi
% From Hi |
Featured
Date |
Price
Featured |
Pivot Featured |
|
Max Buy |
 CRL
-
NYSE
CRL
-
NYSE
Charles River Labs Intl
DRUGS - Biotechnology
|
$249.67
|
-0.19
-0.08% |
$255.45
|
351,035
117.01% of 50 DAV
50 DAV is 300,000
|
$257.88
-3.18%
|
12/17/2020
|
$247.06
|
PP = $257.98
|
|
MB = $270.88
|
Most Recent Note - 12/29/2020 5:06:36 PM
Y - Posted a small gain today with light volume. The pivot point cited is based on its 11/09/20 high plus 10 cents. Subsequent gains above its pivot point backed by at least +40% above average volume may trigger a new (or add-on) technical buy signal. Its 50 DMA line ($237) has been acting as support. Reported Sep '20 quarterly earnings +38% on +11% sales revenues versus the year ago period, above the +25% minimum earnings guideline (C criteria).
>>> FEATURED STOCK ARTICLE : CRL Consolidating Above 50-Day Moving Average Line - 12/14/2020 |
View all notes |
Set NEW NOTE alert |
Company Profile |
SEC
News |
Chart |
Request a new note
C
A
S
I |
AMD
-
NASDAQ
Advanced Micro Devices
ELECTRONICS - Semiconductor - Broad Line
|
$92.30
|
+0.59
0.64% |
$96.06
|
51,723,994
113.24% of 50 DAV
50 DAV is 45,677,000
|
$97.98
-5.80%
|
11/18/2020
|
$82.54
|
PP = $88.72
|
|
MB = $93.16
|
Most Recent Note - 12/28/2020 5:32:20 PM
Y - Color code is changed to yellow after recently pulling back below its "max buy" level. Its 50 DMA line ($86.36) defines important near term support to watch on pullbacks.
>>> FEATURED STOCK ARTICLE : Pulling Back From its Record High Hit Last Week - 12/21/2020 |
View all notes |
Set NEW NOTE alert |
Company Profile |
SEC
News |
Chart |
Request a new note
C
A
S
I |
TER
-
NASDAQ
Teradyne Inc
ELECTRONICS - Semiconductor Equipment and Mate
|
$119.19
|
-0.70
-0.58% |
$123.45
|
1,391,392
94.14% of 50 DAV
50 DAV is 1,478,000
|
$122.37
-2.60%
|
10/21/2020
|
$92.22
|
PP = $93.54
|
|
MB = $98.22
|
Most Recent Note - 12/30/2020 5:36:57 PM
G - Still perched near its all-time high, stubbornly holding its ground with volume totals cooling. Support to watch on pullbacks is its 50 DMA line ($106.47). See the latest FSU analysis for more details and a new annotated graph.
>>> FEATURED STOCK ARTICLE : Perched Near Record High Very Extended From Any Sound Base - 12/30/2020 |
View all notes |
Set NEW NOTE alert |
Company Profile |
SEC
News |
Chart |
Request a new note
C
A
S
I |
AMRC
-
NYSE
Ameresco Inc Cl A
ENERGY - Alternative
|
$50.91
|
-1.33
-2.55% |
$54.57
|
406,462
105.03% of 50 DAV
50 DAV is 387,000
|
$54.79
-7.08%
|
12/15/2020
|
$46.72
|
PP = $47.10
|
|
MB = $49.46
|
Most Recent Note - 12/29/2020 5:14:03 PM
G - Sputtered below its "max buy" level today but closed in the upper half of its intra-day range. Prior highs in the $46-47 area define initial support to watch on pullbacks.
>>> FEATURED STOCK ARTICLE : Gain From Ascending Base Pattern Backed by Above Average Volume - 12/15/2020 |
View all notes |
Set NEW NOTE alert |
Company Profile |
SEC
News |
Chart |
Request a new note
C
A
S
I |
TREX
-
NYSE
Trex Company Inc
MATERIALS and CONSTRUCTION - General Building Materials
|
$82.34
|
-1.38
-1.65% |
$85.41
|
599,365
78.86% of 50 DAV
50 DAV is 760,000
|
$87.88
-6.30%
|
6/26/2020
|
$54.53
|
PP = $66.47
|
|
MB = $69.79
|
Most Recent Note - 12/28/2020 5:25:53 PM
G - There was a "negative reversal" today after hitting yet another new 52-week high. Its 50 DMA line ($76) defines near-term support. Recently noted that it reported Sep '20 quarterly earnings +14% on +19% sales revenues versus the year ago period, below the +25% minimum guideline (C criteria) raising fundamental concerns.
>>> FEATURED STOCK ARTICLE : Hit New High With Light Volume Behind 4th Consecutive Gain - 12/22/2020 |
View all notes |
Set NEW NOTE alert |
Company Profile |
SEC
News |
Chart |
Request a new note
C
A
S
I |
Symbol/Exchange
Company Name
Industry Group |
PRICE |
CHANGE
(%Change) |
Day High |
Volume
(% DAV)
(% 50 day avg vol) |
52 Wk Hi
% From Hi |
Featured
Date |
Price
Featured |
Pivot Featured |
|
Max Buy |
CLFD
-
NASDAQ
Clearfield Inc
TELECOMMUNICATIONS - Cables / Satalite Equipment
|
$24.19
|
-0.53
-2.14% |
$25.69
|
70,455
70.46% of 50 DAV
50 DAV is 100,000
|
$28.32
-14.58%
|
11/17/2020
|
$22.06
|
PP = $26.07
|
|
MB = $27.37
|
 Most Recent Note - 1/4/2021 6:24:06 PM
Y - Slumped further below the pivot point with today's big loss on higher (near average) volume. Near term support is defined by its 50 DMA line ($23.74) and an upward trendline. Churned higher volume in recent weeks without making meaningful price progress, action indicative of distributional pressure. See the latest FSU analysis for more details and a new annotated graph.
>>> FEATURED STOCK ARTICLE : Distributional Pressure While Testing Important Chart Support - 1/4/2021 |
View all notes |
Set NEW NOTE alert |
Company Profile |
SEC
News |
Chart |
Request a new note
C
A
S
I |
NOW
-
NYSE
Servicenow Inc
Computer Sftwr-Enterprse
|
$526.83
|
-23.60
-4.29% |
$557.36
|
1,888,386
141.45% of 50 DAV
50 DAV is 1,335,000
|
$566.74
-7.04%
|
8/20/2020
|
$453.34
|
PP = $454.79
|
|
MB = $477.53
|
Most Recent Note - 1/4/2021 6:17:21 PM
G - Volume was above average behind today's big loss while retreating from near its all-time high and testing its 50 DMA line ($523). Found prompt support near its 50 DMA line during prior consolidations. Recently reported Sep '20 quarterly earnings +22% on +30% sales revenues versus the year ago period, below the +25% minimum guideline (C criteria) of the fact-based investment system.
>>> FEATURED STOCK ARTICLE : Hit New Record High With Light Volume Behind Gain - 12/17/2020 |
View all notes |
Set NEW NOTE alert |
Company Profile |
SEC
News |
Chart |
Request a new note
C
A
S
I |
SMPL
-
NASDAQ
Simply Good Foods Co
Food-Confectionery
|
$29.71
|
-1.65
-5.26% |
$32.03
|
1,341,337
95.67% of 50 DAV
50 DAV is 1,402,000
|
$31.50
-5.68%
|
12/28/2020
|
$30.40
|
PP = $31.44
|
|
MB = $33.01
|
Most Recent Note - 1/4/2021 6:08:53 PM
Y - There was a "negative reversal" today after hitting a new all-time high. Subsequent gains above its pivot point backed by at least +40% above average volume may trigger a technical buy signal. Gapped up and rallied on recent news it was added to the S&P 600 Small Cap Index. Completed a new Pubic Offering on 10/09/19. Reported earnings +33% on +60% sales revenues for the Aug '20 quarter versus the year ago period, its 3rd consecutive quarterly comparison above the +25% minimum earnings guideline (C criteria). Annual earnings history (A criteria) has been strong.
>>> FEATURED STOCK ARTICLE : Challenging All-Time High as it Joins Small Cap Index - 12/28/2020 |
View all notes |
Set NEW NOTE alert |
Company Profile |
SEC
News |
Chart |
Request a new note
C
A
S
I |
ALRM
-
NASDAQ
Alarm.com Holdings Inc
Security/Sfty
|
$100.45
|
-3.00
-2.90% |
$105.19
|
479,115
111.94% of 50 DAV
50 DAV is 428,000
|
$104.75
-4.11%
|
11/6/2020
|
$71.88
|
PP = $74.76
|
|
MB = $78.50
|
Most Recent Note - 1/4/2021 6:14:12 PM
G - Suffered a loss today on average volume. Very extended from any sound base. Its 50 DMA line ($76.97) and prior high ($74.66 on 7/23/20) define important near-term support to watch on pullbacks.
>>> FEATURED STOCK ARTICLE : Perched at High After Impressive Streak of Gains - 12/24/2020 |
View all notes |
Set NEW NOTE alert |
Company Profile |
SEC
News |
Chart |
Request a new note
C
A
S
I |
TEAM
-
NASDAQ
Atlassian Corp Plc Cl A
Comp Sftwr-Spec Enterprs
|
$231.56
|
-2.31
-0.99% |
$234.50
|
1,051,170
59.32% of 50 DAV
50 DAV is 1,772,000
|
$250.03
-7.39%
|
10/12/2020
|
$193.77
|
PP = $199.60
|
|
MB = $209.58
|
Most Recent Note - 12/29/2020 5:12:44 PM
G - Extended from any sound base, consolidating above its prior high and 50 DMA line which define near-term support in the $115-116 area. Showed resilience and strength after earnings rose +7% on +26% sales revenues for the Sep '20 quarter versus the year ago period, below the +25% minimum earnings guideline (C criteria), raising concerns.
>>> FEATURED STOCK ARTICLE : Extended From Any Base After Streak of Gains for New Highs - 12/18/2020 |
View all notes |
Set NEW NOTE alert |
Company Profile |
SEC
News |
Chart |
Request a new note
C
A
S
I |
Symbol/Exchange
Company Name
Industry Group |
PRICE |
CHANGE
(%Change) |
Day High |
Volume
(% DAV)
(% 50 day avg vol) |
52 Wk Hi
% From Hi |
Featured
Date |
Price
Featured |
Pivot Featured |
|
Max Buy |
SHOP
-
NYSE
Shopify Inc Cl A
Computer Sftwr-Enterprse
|
$1,092.40
|
-39.55
-3.49% |
$1,142.88
|
1,642,163
107.33% of 50 DAV
50 DAV is 1,530,000
|
$1,285.19
-15.00%
|
12/16/2020
|
$1,146.00
|
PP = $1,147.01
|
|
MB = $1,204.36
|
Most Recent Note - 1/4/2021 6:22:19 PM
Y - Suffered a big loss today with higher (near average) volume, slumping below prior highs in the $1,146-1,130 area and falling back into the prior base raising concerns. Its 50 DMA line ($1,045) defines the next important support to watch. Reported Sep '20 quarterly earnings of $1.13 per share versus a loss of 29 cents per share on +96% sales revenues versus the year ago period. The Ontario, Canada-based Computer Software - Enterprise firm's prior quarters showed big earnings and sales revenues growth. After years of losses it had strong earnings growth in FY '17-19 (A criteria).
>>> FEATURED STOCK ARTICLE : Volume-Driven Gain for New High After Long Consolidation - 12/16/2020 |
View all notes |
Set NEW NOTE alert |
Company Profile |
SEC
News |
Chart |
Request a new note
C
A
S
I |
YETI
-
NYSE
Yeti Holdings Inc
Leisure-Products
|
$68.48
|
+0.01
0.01% |
$70.25
|
927,105
77.13% of 50 DAV
50 DAV is 1,202,000
|
$74.82
-8.47%
|
11/5/2020
|
$57.25
|
PP = $55.14
|
|
MB = $57.90
|
Most Recent Note - 12/29/2020 5:04:21 PM
G - Slumped for a 2nd consecutive loss today after quietly wedging to new all-time highs with recent gains lacking great volume conviction. Its 50 DMA line ($61.03) defines initial support to watch above prior highs in the $55-54 area. See the latest FSU analysis for more details and a new annotated graph.
>>> FEATURED STOCK ARTICLE : Pulling Back After Recently Wedging to New Highs - 12/29/2020 |
View all notes |
Set NEW NOTE alert |
Company Profile |
SEC
News |
Chart |
Request a new note
C
A
S
I |
AAXN
-
NASDAQ
Axon Enterprise Inc
Security/Sfty
|
$116.85
|
-5.68
-4.64% |
$123.39
|
656,558
124.58% of 50 DAV
50 DAV is 527,000
|
$134.73
-13.27%
|
12/22/2020
|
$127.84
|
PP = $130.51
|
|
MB = $137.04
|
Most Recent Note - 1/4/2021 6:12:22 PM
G - Color code is changed to green after a big loss on higher volume today violated its 50 DMA line raising concerns and triggering a technical sell signal. A prompt rebound is needed for its outlook to improve. A subsequent gain and close above the pivot point backed by at least +40% above average volume may trigger a new (or add-on) technical buy signal. Fundamentals remain strong.
>>> FEATURED STOCK ARTICLE : New All-Time High With Today's 5th Consecutive Gain - 12/23/2020 |
View all notes |
Set NEW NOTE alert |
Company Profile |
SEC
News |
Chart |
Request a new note
C
A
S
I |
QTWO
-
NYSE
Q2 Holdings Inc
Computer Sftwr-Financial
|
$123.93
|
-2.60
-2.05% |
$127.00
|
322,868
74.74% of 50 DAV
50 DAV is 432,000
|
$130.59
-5.10%
|
11/12/2020
|
$105.14
|
PP = $106.54
|
|
MB = $111.87
|
Most Recent Note - 1/4/2021 6:19:18 PM
G - Pulled back with below average volume today, still hovering near its all-time high. Its 50 DMA line ($111.45) defines important near term support to watch above the prior high in the $106 area.
>>> FEATURED STOCK ARTICLE : Stubbornly Holding Ground Extended From Prior Base - 12/31/2020 |
View all notes |
Set NEW NOTE alert |
Company Profile |
SEC
News |
Chart |
Request a new note
C
A
S
I |
|
|
|
THESE ARE NOT BUY RECOMMENDATIONS!
Comments contained in the body of this report are technical
opinions only. The material herein has been obtained
from sources believed to be reliable and accurate, however,
its accuracy and completeness cannot be guaranteed.
This site is not an investment advisor, hence it does
not endorse or recommend any securities or other investments.
Any recommendation contained in this report may not
be suitable for all investors and it is not to be deemed
an offer or solicitation on our part with respect to
the purchase or sale of any securities. All trademarks,
service marks and trade names appearing in this report
are the property of their respective owners, and are
likewise used for identification purposes only.
This report is a service available
only to active Paid Premium Members.
You may opt-out of receiving report notifications
at any time. Questions or comments may be submitted
by writing to Premium Membership Services 665 S.E. 10 Street, Suite 201 Deerfield Beach, FL 33441-5634 or by calling 1-800-965-8307
or 954-785-1121.
|
|
|