You are not logged in.
This means you
CAN ONLY VIEW reports that were published prior to Tuesday, March 25, 2025.
You
MUST UPGRADE YOUR MEMBERSHIP if you want to see any current reports.
AFTER MARKET UPDATE - THURSDAY, DECEMBER 31ST, 2020
Previous After Market Report Next After Market Report >>>
|
|
|
|
DOW |
+196.92 |
30,606.48 |
+0.65% |
|
Volume |
806,636,339 |
+17% |
|
Volume |
4,801,047,100 |
-8% |
|
NASDAQ |
+22.36 |
12,892.36 |
+0.17% |
|
Advancers |
1,834 |
59% |
|
Advancers |
1,739 |
46% |
|
S&P 500 |
+24.03 |
3,756.07 |
+0.64% |
|
Decliners |
1,270 |
41% |
|
Decliners |
2,008 |
54% |
|
Russell 2000 |
-5.14 |
1,974.86 |
-0.26% |
|
52 Wk Highs |
153 |
|
|
52 Wk Highs |
200 |
|
|
S&P 600 |
+0.92 |
1,118.93 |
+0.08% |
|
52 Wk Lows |
5 |
|
|
52 Wk Lows |
20 |
|
|
 |
Major Indices Close Year Perched at Record Highs
Kenneth J. Gruneisen - Passed the CAN SLIM® Master's Exam
The Dow added 196 points to cap a 7.3% annual increase. The Nasdaq Composite inched 0.1% higher, capping the best year for the tech-heavy benchmark since 2009 (+43.6%). The volume totals were mixed, higher than the prior session volume total on the NYSE and lower on the Nasdaq exchange. Breadth was positive as advancers led decliners by a 3-2 margin on the NYSE while decliners led advancers by a narrow margin on the Nasdaq exchange. There were 33 high-ranked companies from the Leaders List that hit new 52-week highs and were listed on the BreakOuts Page, versus the total of 40 on the prior session. New 52-week highs totals expanded easily outnumbered the new 52-week lows totals on both exchanges. The major indices are in a confirmed uptrend (M criteria). Investors are reminded to always make buying and selling decisions based based on the strict criteria and rules of the fact-based investment system. PICTURED: The S&P 500 Index climbed +0.6% to finish off a 16.3% 2020 advance.
Stocks advanced on Thursday, with the Dow Jones Industrial Average finishing a tumultuous year at a fresh record high. It was a light day for market news, as investors continued to weigh lingering stimulus and vaccine optimism against record U.S. coronavirus hospitalizations.
Nine of 11 S&P 500 sectors finished the session higher with Utilities and Financials pacing the gains while Energy stocks lagged. In corporate news, Exxon Mobil (XOM -0.91%) after the energy giant announced an asset write-down of up to $20 billion. Meanwhile, Tesla (TSLA +1.57%) rose to top off a 741% 2020 rally which left the electric carmaker as the best performing S&P 500 stock.
On the data front, initial jobless claims unexpectedly fell to 787,000 in the week ended December 26, below the projected 835,000 and the previous week’s 803,000 claims. In fixed income, the yield on the benchmark 10-year note dipped one basis point to 0.91%, 100 basis points below where it started the year at 1.91%. In commodities, WTI crude finished essentially flat at $48.52, roughly 20% below where it started the year. COMEX gold added 0.5% to $1901.90.ounce, capping its best year since 2010 (+25%). |
 Kenneth J. Gruneisen started out as a licensed stockbroker in August 1987, a couple of months prior to the historic stock market crash that took the Dow Jones Industrial Average down -22.6% in a single day. He has published daily fact-based fundamental and technical analysis on high-ranked stocks online for two decades. Through FACTBASEDINVESTING.COM, Kenneth provides educational articles, news, market commentary, and other information regarding proven investment systems that work in good times and bad.
Comments contained in the body of this report are technical opinions only and are not necessarily those of Gruneisen Growth Corp. The material herein has been obtained from sources believed to be reliable and accurate, however, its accuracy and completeness cannot be guaranteed. Our firm, employees, and customers may effect transactions, including transactions contrary to any recommendation herein, or have positions in the securities mentioned herein or options with respect thereto. Any recommendation contained in this report may not be suitable for all investors and it is not to be deemed an offer or solicitation on our part with respect to the purchase or sale of any securities. |
|
 |
Financial, Semiconductor, and Oil Services Indexes Rose
Kenneth J. Gruneisen - Passed the CAN SLIM® Master's Exam
The Retail Index ($RLX -0.42%) edged lower while the Bank Index ($BKX +1.12%) and Broker/Dealer Index ($XBD +0.68%) both posted gains. The Semiconductor Index ($SOX +0.42%) and Networking Index ($NWX +0.28%) both edged lower while the Biotech Index ($BTK -0.67%) lost ground. The Oil Services Index ($OSX +0.40%) posted a small gain while the Integrated Oil Index ($XOI -1.23%) and the Gold & Silver Index ($XAU -2.00%) lost ground.
PICTURED: The Oil Services Index ($OSX +0.40%) is now consolidating above its 50-day moving average (DMA) line and holding its ground near its June high.
| Oil Services |
$OSX |
44.33 |
+0.18 |
+0.40% |
-43.38% |
| Integrated Oil |
$XOI |
792.48 |
-9.84 |
-1.23% |
-37.63% |
| Semiconductor |
$SOX |
2,795.50 |
+11.73 |
+0.42% |
+51.14% |
| Networking |
$NWX |
717.12 |
+1.97 |
+0.28% |
+22.92% |
| Broker/Dealer |
$XBD |
377.59 |
+2.57 |
+0.68% |
+30.03% |
| Retail |
$RLX |
3,563.26 |
-15.12 |
-0.42% |
+45.48% |
| Gold & Silver |
$XAU |
144.19 |
-2.95 |
-2.00% |
+34.86% |
| Bank |
$BKX |
97.91 |
+1.09 |
+1.12% |
-13.63% |
| Biotech |
$BTK |
5,739.02 |
-38.67 |
-0.67% |
+13.25% |
|
|
|
 |
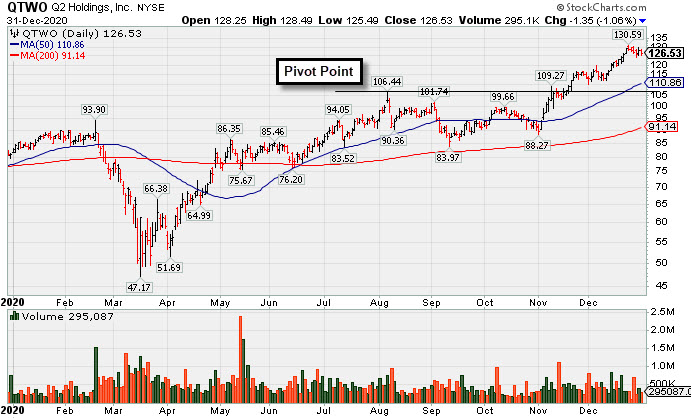
Stubbornly Holding Ground Extended From Prior Base
Kenneth J. Gruneisen - Passed the CAN SLIM® Master's Exam
Q2 Holdings Inc (QTWO -$1.35 or -1.06% to $126.53) is hovering above its "max buy" level and perched near its all-time high. The 50-day moving average (DMA) line ($110.86) prior high in the $106 area defines initial support to watch on pullbacks.
QTWO was last shown in the FSU section on 12/08/20 with an annotated graph under the headline, "Computer Software - Financial Firm Hovering Near Record High". It was highlighted in yellow with new pivot point cited based on its 8/06/20 high plus 10 cents in the 11/12/20 mid-day report (read here).
It has a 97 Earnings Per Share Rating. It showed great earning increases with strong underlying sales revenues growth for the Jun and Sep '20 quarters versus the year ago periods. Annual earnings growth has been strong. Completed new Public Offerings on 6/06/19 and 5/13/20. The company hails from the Computer Sftwr-Financial group. There are only 53.9 million shares outstanding (S criteria).
The number of top-rated funds owning its shares rose from 404 in Dec '19 to 466 in Sep '20, a reassuring sign concerning the I criteria. Its current Up/Down Volume Ratio of 1.3 is an unbiased indication its shares have been neutral concerning accumulation/distribution over the past 50 days.
|
|
|
Color Codes Explained :
Y - Better candidates highlighted by our
staff of experts.
G - Previously featured
in past reports as yellow but may no longer be buyable under the
guidelines.
***Last / Change / Volume data in this table is the closing quote data***
Symbol/Exchange
Company Name
Industry Group |
PRICE |
CHANGE
(%Change) |
Day High |
Volume
(% DAV)
(% 50 day avg vol) |
52 Wk Hi
% From Hi |
Featured
Date |
Price
Featured |
Pivot Featured |
|
Max Buy |
 CRL
-
NYSE
CRL
-
NYSE
Charles River Labs Intl
DRUGS - Biotechnology
|
$249.86
|
+1.27
0.51% |
$250.93
|
184,141
60.77% of 50 DAV
50 DAV is 303,000
|
$257.88
-3.11%
|
12/17/2020
|
$247.06
|
PP = $257.98
|
|
MB = $270.88
|
Most Recent Note - 12/29/2020 5:06:36 PM
Y - Posted a small gain today with light volume. The pivot point cited is based on its 11/09/20 high plus 10 cents. Subsequent gains above its pivot point backed by at least +40% above average volume may trigger a new (or add-on) technical buy signal. Its 50 DMA line ($237) has been acting as support. Reported Sep '20 quarterly earnings +38% on +11% sales revenues versus the year ago period, above the +25% minimum earnings guideline (C criteria).
>>> FEATURED STOCK ARTICLE : CRL Consolidating Above 50-Day Moving Average Line - 12/14/2020 |
View all notes |
Set NEW NOTE alert |
Company Profile |
SEC
News |
Chart |
Request a new note
C
A
S
I |
AMD
-
NASDAQ
Advanced Micro Devices
ELECTRONICS - Semiconductor - Broad Line
|
$91.71
|
-0.58
-0.63% |
$92.30
|
24,925,048
54.25% of 50 DAV
50 DAV is 45,942,000
|
$97.98
-6.40%
|
11/18/2020
|
$82.54
|
PP = $88.72
|
|
MB = $93.16
|
Most Recent Note - 12/28/2020 5:32:20 PM
Y - Color code is changed to yellow after recently pulling back below its "max buy" level. Its 50 DMA line ($86.36) defines important near term support to watch on pullbacks.
>>> FEATURED STOCK ARTICLE : Pulling Back From its Record High Hit Last Week - 12/21/2020 |
View all notes |
Set NEW NOTE alert |
Company Profile |
SEC
News |
Chart |
Request a new note
C
A
S
I |
TER
-
NASDAQ
Teradyne Inc
ELECTRONICS - Semiconductor Equipment and Mate
|
$119.89
|
-0.40
-0.33% |
$120.71
|
699,840
46.01% of 50 DAV
50 DAV is 1,521,000
|
$122.37
-2.03%
|
10/21/2020
|
$92.22
|
PP = $93.54
|
|
MB = $98.22
|
Most Recent Note - 12/30/2020 5:36:57 PM
G - Still perched near its all-time high, stubbornly holding its ground with volume totals cooling. Support to watch on pullbacks is its 50 DMA line ($106.47). See the latest FSU analysis for more details and a new annotated graph.
>>> FEATURED STOCK ARTICLE : Perched Near Record High Very Extended From Any Sound Base - 12/30/2020 |
View all notes |
Set NEW NOTE alert |
Company Profile |
SEC
News |
Chart |
Request a new note
C
A
S
I |
AMRC
-
NYSE
Ameresco Inc Cl A
ENERGY - Alternative
|
$52.24
|
+0.44
0.85% |
$52.97
|
279,988
72.16% of 50 DAV
50 DAV is 388,000
|
$54.79
-4.65%
|
12/15/2020
|
$46.72
|
PP = $47.10
|
|
MB = $49.46
|
Most Recent Note - 12/29/2020 5:14:03 PM
G - Sputtered below its "max buy" level today but closed in the upper half of its intra-day range. Prior highs in the $46-47 area define initial support to watch on pullbacks.
>>> FEATURED STOCK ARTICLE : Gain From Ascending Base Pattern Backed by Above Average Volume - 12/15/2020 |
View all notes |
Set NEW NOTE alert |
Company Profile |
SEC
News |
Chart |
Request a new note
C
A
S
I |
TREX
-
NYSE
Trex Company Inc
MATERIALS and CONSTRUCTION - General Building Materials
|
$83.72
|
-0.07
-0.08% |
$85.06
|
568,329
75.08% of 50 DAV
50 DAV is 757,000
|
$87.88
-4.73%
|
6/26/2020
|
$54.53
|
PP = $66.47
|
|
MB = $69.79
|
Most Recent Note - 12/28/2020 5:25:53 PM
G - There was a "negative reversal" today after hitting yet another new 52-week high. Its 50 DMA line ($76) defines near-term support. Recently noted that it reported Sep '20 quarterly earnings +14% on +19% sales revenues versus the year ago period, below the +25% minimum guideline (C criteria) raising fundamental concerns.
>>> FEATURED STOCK ARTICLE : Hit New High With Light Volume Behind 4th Consecutive Gain - 12/22/2020 |
View all notes |
Set NEW NOTE alert |
Company Profile |
SEC
News |
Chart |
Request a new note
C
A
S
I |
Symbol/Exchange
Company Name
Industry Group |
PRICE |
CHANGE
(%Change) |
Day High |
Volume
(% DAV)
(% 50 day avg vol) |
52 Wk Hi
% From Hi |
Featured
Date |
Price
Featured |
Pivot Featured |
|
Max Buy |
CLFD
-
NASDAQ
Clearfield Inc
TELECOMMUNICATIONS - Cables / Satalite Equipment
|
$24.72
|
+0.06
0.24% |
$25.06
|
38,453
37.70% of 50 DAV
50 DAV is 102,000
|
$28.32
-12.71%
|
11/17/2020
|
$22.06
|
PP = $26.07
|
|
MB = $27.37
|
Most Recent Note - 12/29/2020 3:41:59 PM
Y - Slumping further below the pivot point with today's big loss on below average volume. Near term support is defined by its 50 DMA line ($23.57) and an upward trendline. Churned higher volume in recent weeks without making meaningful price progress, action indicative of distributional pressure.
>>> FEATURED STOCK ARTICLE : Perched Near Pivot Point in Need of Confirming Gain on Volume - 12/10/2020 |
View all notes |
Set NEW NOTE alert |
Company Profile |
SEC
News |
Chart |
Request a new note
C
A
S
I |
NOW
-
NYSE
Servicenow Inc
Computer Sftwr-Enterprse
|
$550.43
|
+3.05
0.56% |
$551.08
|
664,940
49.70% of 50 DAV
50 DAV is 1,338,000
|
$566.74
-2.88%
|
8/20/2020
|
$453.34
|
PP = $454.79
|
|
MB = $477.53
|
Most Recent Note - 12/29/2020 5:08:13 PM
G - Volume totals have been cooling while still hovering near its all-time high. Found prompt support near its 50 DMA line ($522) and stubbornly held its ground in recent weeks. Recently reported Sep '20 quarterly earnings +22% on +30% sales revenues versus the year ago period, below the +25% minimum guideline (C criteria) of the fact-based investment system.
>>> FEATURED STOCK ARTICLE : Hit New Record High With Light Volume Behind Gain - 12/17/2020 |
View all notes |
Set NEW NOTE alert |
Company Profile |
SEC
News |
Chart |
Request a new note
C
A
S
I |
SMPL
-
NASDAQ
Simply Good Foods Co
Food-Confectionery
|
$31.36
|
+0.99
3.26% |
$31.50
|
1,373,084
99.07% of 50 DAV
50 DAV is 1,386,000
|
$30.75
1.98%
|
12/28/2020
|
$30.40
|
PP = $31.44
|
|
MB = $33.01
|
 Most Recent Note - 12/31/2020 7:57:09 PM
Y - Posted a gain today with average volume for a new all-time high. Color code was changed to yellow with pivot point cited based on its 9/09/19 high plus 10 cents. Subsequent gains above its pivot point backed by at least +40% above average volume may trigger a technical buy signal. Gapped up last week and rallied further on news it was added to the S&P 600 Small Cap Index. Completed a new Pubic Offering on 10/09/19. Reported earnings +33% on +60% sales revenues for the Aug '20 quarter versus the year ago period, its 3rd consecutive quarterly comparison above the +25% minimum earnings guideline (C criteria). Annual earnings history (A criteria) has been strong.
>>> FEATURED STOCK ARTICLE : Challenging All-Time High as it Joins Small Cap Index - 12/28/2020 |
View all notes |
Set NEW NOTE alert |
Company Profile |
SEC
News |
Chart |
Request a new note
C
A
S
I |
ALRM
-
NASDAQ
Alarm.com Holdings Inc
Security/Sfty
|
$103.45
|
-0.34
-0.33% |
$104.75
|
326,433
76.63% of 50 DAV
50 DAV is 426,000
|
$103.95
-0.48%
|
11/6/2020
|
$71.88
|
PP = $74.76
|
|
MB = $78.50
|
Most Recent Note - 12/30/2020 5:41:57 PM
G - Posted a big gain today with lighter than average volume for a best-ever close, very extended from any sound base. Its 50 DMA line ($75.30) and prior high ($74.66 on 7/23/20) define important near-term support to watch on pullbacks.
>>> FEATURED STOCK ARTICLE : Perched at High After Impressive Streak of Gains - 12/24/2020 |
View all notes |
Set NEW NOTE alert |
Company Profile |
SEC
News |
Chart |
Request a new note
C
A
S
I |
TEAM
-
NASDAQ
Atlassian Corp Plc Cl A
Comp Sftwr-Spec Enterprs
|
$233.87
|
-0.17
-0.07% |
$235.27
|
711,566
39.55% of 50 DAV
50 DAV is 1,799,000
|
$250.03
-6.46%
|
10/12/2020
|
$193.77
|
PP = $199.60
|
|
MB = $209.58
|
Most Recent Note - 12/29/2020 5:12:44 PM
G - Extended from any sound base, consolidating above its prior high and 50 DMA line which define near-term support in the $115-116 area. Showed resilience and strength after earnings rose +7% on +26% sales revenues for the Sep '20 quarter versus the year ago period, below the +25% minimum earnings guideline (C criteria), raising concerns.
>>> FEATURED STOCK ARTICLE : Extended From Any Base After Streak of Gains for New Highs - 12/18/2020 |
View all notes |
Set NEW NOTE alert |
Company Profile |
SEC
News |
Chart |
Request a new note
C
A
S
I |
Symbol/Exchange
Company Name
Industry Group |
PRICE |
CHANGE
(%Change) |
Day High |
Volume
(% DAV)
(% 50 day avg vol) |
52 Wk Hi
% From Hi |
Featured
Date |
Price
Featured |
Pivot Featured |
|
Max Buy |
SHOP
-
NYSE
Shopify Inc Cl A
Computer Sftwr-Enterprse
|
$1,131.95
|
-31.05
-2.67% |
$1,163.46
|
817,488
53.36% of 50 DAV
50 DAV is 1,532,000
|
$1,285.19
-11.92%
|
12/16/2020
|
$1,146.00
|
PP = $1,147.01
|
|
MB = $1,204.36
|
Most Recent Note - 12/31/2020 7:55:58 PM
Y - Volume totals have been cooling while consolidating after spiking to new all-time highs with volume-driven gains. Prior highs in the $1,146-1,130 area define initial support to watch above its 50 DMA line ($1,044). Reported Sep '20 quarterly earnings of $1.13 per share versus a loss of 29 cents per share on +96% sales revenues versus the year ago period. The Ontario, Canada-based Computer Software - Enterprise firm's prior quarters showed big earnings and sales revenues growth. After years of losses it had strong earnings growth in FY '17-19 (A criteria).
>>> FEATURED STOCK ARTICLE : Volume-Driven Gain for New High After Long Consolidation - 12/16/2020 |
View all notes |
Set NEW NOTE alert |
Company Profile |
SEC
News |
Chart |
Request a new note
C
A
S
I |
YETI
-
NYSE
Yeti Holdings Inc
Leisure-Products
|
$68.47
|
+0.28
0.41% |
$69.27
|
656,120
54.54% of 50 DAV
50 DAV is 1,203,000
|
$74.82
-8.49%
|
11/5/2020
|
$57.25
|
PP = $55.14
|
|
MB = $57.90
|
Most Recent Note - 12/29/2020 5:04:21 PM
G - Slumped for a 2nd consecutive loss today after quietly wedging to new all-time highs with recent gains lacking great volume conviction. Its 50 DMA line ($61.03) defines initial support to watch above prior highs in the $55-54 area. See the latest FSU analysis for more details and a new annotated graph.
>>> FEATURED STOCK ARTICLE : Pulling Back After Recently Wedging to New Highs - 12/29/2020 |
View all notes |
Set NEW NOTE alert |
Company Profile |
SEC
News |
Chart |
Request a new note
C
A
S
I |
AAXN
-
NASDAQ
Axon Enterprise Inc
Security/Sfty
|
$122.53
|
-1.35
-1.09% |
$123.88
|
353,962
66.29% of 50 DAV
50 DAV is 534,000
|
$134.73
-9.06%
|
12/22/2020
|
$127.84
|
PP = $130.51
|
|
MB = $137.04
|
Most Recent Note - 12/28/2020 5:28:41 PM
Y - Slumped for a big loss today with below average volume. Color code was changed to yellow after a 4-week square box base pattern as it was noted - "A solid gain and close above the pivot point backed by at least +40% above average volume may trigger a new (or add-on) technical buy signal. Its 50 DMA line ($116.42) defines near term support to watch on pullbacks. Recently reported Sep '20 quarterly earnings +43% on +27% sales revenues versus the year ago period."
>>> FEATURED STOCK ARTICLE : New All-Time High With Today's 5th Consecutive Gain - 12/23/2020 |
View all notes |
Set NEW NOTE alert |
Company Profile |
SEC
News |
Chart |
Request a new note
C
A
S
I |
QTWO
-
NYSE
Q2 Holdings Inc
Computer Sftwr-Financial
|
$126.53
|
-1.35
-1.06% |
$128.49
|
295,087
68.78% of 50 DAV
50 DAV is 429,000
|
$130.59
-3.11%
|
11/12/2020
|
$105.14
|
PP = $106.54
|
|
MB = $111.87
|
Most Recent Note - 12/29/2020 5:10:13 PM
G - Pulled back with lighter volume for a 4th consecutive small loss today, still hovering near its all-time high. Its 50 DMA line ($109.62) and prior high in the $106 area define important near term support to watch.
>>> FEATURED STOCK ARTICLE : Stubbornly Holding Ground Extended From Prior Base - 12/31/2020 |
View all notes |
Set NEW NOTE alert |
Company Profile |
SEC
News |
Chart |
Request a new note
C
A
S
I |
|
|
|
THESE ARE NOT BUY RECOMMENDATIONS!
Comments contained in the body of this report are technical
opinions only. The material herein has been obtained
from sources believed to be reliable and accurate, however,
its accuracy and completeness cannot be guaranteed.
This site is not an investment advisor, hence it does
not endorse or recommend any securities or other investments.
Any recommendation contained in this report may not
be suitable for all investors and it is not to be deemed
an offer or solicitation on our part with respect to
the purchase or sale of any securities. All trademarks,
service marks and trade names appearing in this report
are the property of their respective owners, and are
likewise used for identification purposes only.
This report is a service available
only to active Paid Premium Members.
You may opt-out of receiving report notifications
at any time. Questions or comments may be submitted
by writing to Premium Membership Services 665 S.E. 10 Street, Suite 201 Deerfield Beach, FL 33441-5634 or by calling 1-800-965-8307
or 954-785-1121.
|
|
|