You are not logged in.
This means you
CAN ONLY VIEW reports that were published prior to Sunday, April 13, 2025.
You
MUST UPGRADE YOUR MEMBERSHIP if you want to see any current reports.
AFTER MARKET UPDATE - WEDNESDAY, DECEMBER 22ND, 2021
Previous After Market Report Next After Market Report >>>
|
|
|
|
DOW |
+261.19 |
35,753.89 |
+0.74% |
|
Volume |
715,352,954 |
-26% |
|
Volume |
4,016,742,500 |
-11% |
|
NASDAQ |
+180.81 |
15,521.89 |
+1.18% |
|
Advancers |
2,448 |
74% |
|
Advancers |
2,787 |
60% |
|
S&P 500 |
+47.33 |
4,696.56 |
+1.02% |
|
Decliners |
840 |
26% |
|
Decliners |
1,819 |
39% |
|
Russell 2000 |
+18.96 |
2,221.90 |
+0.86% |
|
52 Wk Highs |
59 |
|
|
52 Wk Highs |
58 |
|
|
S&P 600 |
+15.08 |
1,378.93 |
+1.11% |
|
52 Wk Lows |
56 |
|
|
52 Wk Lows |
137 |
|
|
Leadership has kept a brief new rally sputtering. Great caution is still advised until additional follow-through strength solidly reconfirms an uptrend for the market (M criteria).
|
 |
Major Indices Rebounded Further With Lighter Volume
Kenneth J. Gruneisen - Passed the CAN SLIM® Master's Exam
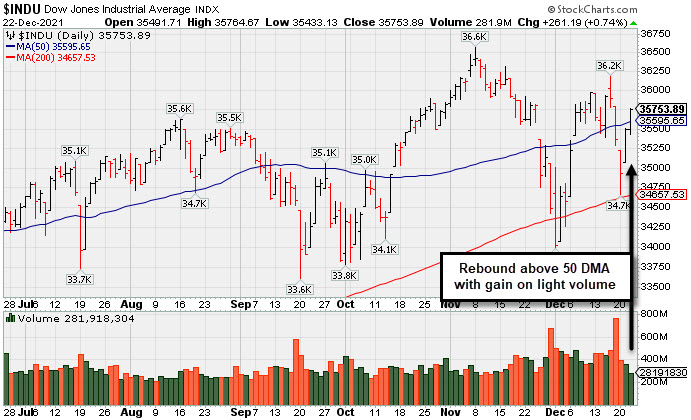
The S&P 500 rose 1% extending Tuesday’s relief rally. The Dow gained 261 points, while the Nasdaq Composite climbed 1.2%. The volume totals reported were lighter than the prior session on the NYSE and on the Nasdaq exchange. Breadth was clearly positive as advancers led decliners by almost a 3-1 margin on the NYSE and by a 3-2 margin on the Nasdaq exchange. Leadership improved as there were 27 high-ranked companies from the Leaders List that hit new 52-week highs and were listed on the BreakOuts Page, versus the total of 20 on the prior session. New 52-week highs just outnumbered new 52-week lows on the NYSE, but new lows still outnumbered new highs on the Nasdaq exchange. Weak action for the market averages (M criteria) put pressure immediately on the brief new rally. New buying efforts are to be carefully made under the fact-based investment system's strict criteria.
 PICTURED: The Dow Jones Industrial Average posted a 2nd consecutive gain with even lighter volume and rebounded above its 50-day moving average on Wednesday. The weak action of its prior losses did not undercut its prior low, technically keeping the latest brief rally alive, however, caution may still be advised. No rally is sustainable without a healthy crop of stocks leading the way and hitting new 52-week highs, so it will be very important in the near term to see an expansion and further technical improvements.
U.S. stocks finished firmly higher on Wednesday as investors weighed upbeat economic data updates against a backdrop of lingering headwinds. Treasuries fluctuated, with the yield on the 10-year note down two basis points (0.02%) to 1.45%.
On the data front, a third and final reading of U.S. third-quarter gross domestic product (GDP) was upwardly revised to reflect annualized economic growth of 2.3% from the previous 2.1% print. Another release revealed the Conference Board’s gauge of consumer confidence jumped more than anticipated in December to 115.8 from an upwardly revised 111.9. Rounding out the docket, existing home sales rose 1.9% in November to the highest level since January. In commodities, WTI crude climbed to a four week high, rising 2.5% to $72.93/barrel following a larger-than-anticipated drawdown of domestic stockpiles.
All 11 S&P 500 sectors closed in positive territory, with growth-related names outperforming. The Consumer Discretionary space paced the gains, with Tesla, Inc. (TSLA +7.49%) after CEO Elon Musk indicated he had reached his target of liquidating 10% of his shares in the electric vehicle maker for tax purposes. Meanwhile, Amazon.com Inc. (AMZN +0.36%) fluctuated following reports the company’s cloud computing business was under increased antitrust scrutiny from U.S. regulators. Elsewhere, Caterpillar, Inc. (CAT +1.94%) rose after being the subject of an analyst upgrade. Trading volume was more than 20% below the trailing 30-day average as some market participants got an early start to the long holiday weekend. |
 Kenneth J. Gruneisen started out as a licensed stockbroker in August 1987, a couple of months prior to the historic stock market crash that took the Dow Jones Industrial Average down -22.6% in a single day. He has published daily fact-based fundamental and technical analysis on high-ranked stocks online for two decades. Through FACTBASEDINVESTING.COM, Kenneth provides educational articles, news, market commentary, and other information regarding proven investment systems that work in good times and bad.
Comments contained in the body of this report are technical opinions only and are not necessarily those of Gruneisen Growth Corp. The material herein has been obtained from sources believed to be reliable and accurate, however, its accuracy and completeness cannot be guaranteed. Our firm, employees, and customers may effect transactions, including transactions contrary to any recommendation herein, or have positions in the securities mentioned herein or options with respect thereto. Any recommendation contained in this report may not be suitable for all investors and it is not to be deemed an offer or solicitation on our part with respect to the purchase or sale of any securities. |
|
 |
Retail, Financial, Tech, and Commodity-Linked Groups Rose
Kenneth J. Gruneisen - Passed the CAN SLIM® Master's Exam
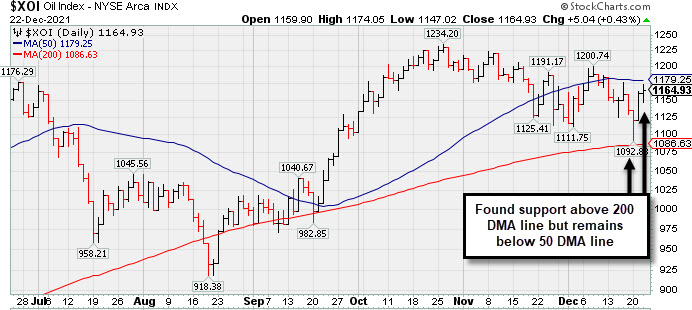
Gains from the Broker/Dealer Index ($XBD +0.93%), Retail Index ($RLX +0.48%), and Bank Index ($BKX +0.39%) had a positive influence on the major averages. The tech sector also had a positive bias as the Semiconductor Index ($SOX +0.90%) and Networking Index ($NWX +0.90%) both outpaced the Biotech Index ($BTK +0.34%). Commodity-linked groups also had a positive bias as the Gold & Silver Index ($XAU +1.27%) outpaced the Oil Services Index ($OSX +0.70%) and the Integrated Oil Index ($XOI +0.43%).
PICTURED: The Integrated Oil Index ($XOI +0.43%) found support above its 200-day moving average (DMA) line but remains below its 50 DMA line.
| Oil Services |
$OSX |
53.21 |
+0.37 |
+0.70% |
+20.04% |
| Integrated Oil |
$XOI |
1,164.93 |
+5.04 |
+0.43% |
+47.00% |
| Semiconductor |
$SOX |
3,891.92 |
+34.62 |
+0.90% |
+39.22% |
| Networking |
$NWX |
945.43 |
+8.43 |
+0.90% |
+31.84% |
| Broker/Dealer |
$XBD |
484.12 |
+4.44 |
+0.93% |
+28.21% |
| Retail |
$RLX |
4,203.18 |
+19.89 |
+0.48% |
+17.96% |
| Gold & Silver |
$XAU |
129.61 |
+1.62 |
+1.27% |
-10.11% |
| Bank |
$BKX |
130.56 |
+0.50 |
+0.39% |
+33.35% |
| Biotech |
$BTK |
5,603.38 |
+18.84 |
+0.34% |
-2.36% |
|
|
|
 |
Formed New 5-Week Base and Perched Near Pivot Point
Kenneth J. Gruneisen - Passed the CAN SLIM® Master's Exam
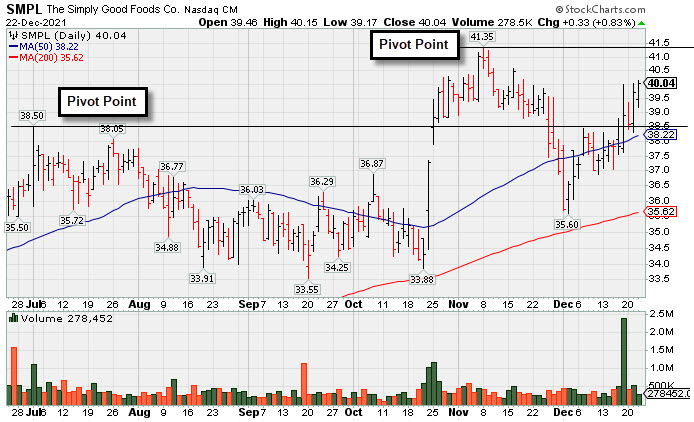
Simply Good Foods Co (SMPL +$0.33 or +0.83% to $40.04) is consolidating above its 50-day moving average (DMA) line ($38.22). It color code was changed to yellow with a new pivot point cited based on its 11/08/21 high plus 10 cents after a 6-week base. Subsequent gains above the pivot point backed by at least +40% above average volume may trigger a new (or add-on) technical buy signal. The prior low and 200 DMA line ($35.62) define the next important support where violations may trigger technical sell signals.
Recently it reported Aug '21 quarterly earnings +45% on +17% sales revenues versus the year ago period, well above the +25% minimum earnings guideline (C criteria). In 5 of the past 7 quarterly comparisons earnings were above the +25% minimum guideline (C criteria). Its annual earnings history (A criteria) has been strong. It currently has a 95 Earnings Per Share Rating.
Its current Relative Strength Rating is 89, above the 80+ minimum guideline for buy candidates. SMPL completed a new Pubic Offering on 10/09/19. The company has a Timeliness Rating of A and Sponsorship Rating of C. The number of top-rated funds owning its shares rose from 357 in Dec '20 to 427 in Sep '21. Its current Up/Down Volume Ratio of 1.5 is an unbiased indication its shares have been under accumulation pressure over the past 50 days.
Some leadership has been provided by other companies in the Food/Beverage Sector, however, the Food-Confectionery industry group has a Group Relative Strength Rating of 58 (B-) which is a concern regarding the L criteria. There are only 5 companies listed in the group.
|
|
|
Color Codes Explained :
Y - Better candidates highlighted by our
staff of experts.
G - Previously featured
in past reports as yellow but may no longer be buyable under the
guidelines.
***Last / Change / Volume data in this table is the closing quote data***
Symbol/Exchange
Company Name
Industry Group |
PRICE |
CHANGE
(%Change) |
Day High |
Volume
(% DAV)
(% 50 day avg vol) |
52 Wk Hi
% From Hi |
Featured
Date |
Price
Featured |
Pivot Featured |
|
Max Buy |
 BLDR
-
NYSE
BLDR
-
NYSE
Builders Firstsource Inc
Bldg-Constr Prds/Misc
|
$81.06
|
+2.37
3.01% |
$81.43
|
2,471,713
98.16% of 50 DAV
50 DAV is 2,518,000
|
$80.95
0.14%
|
8/12/2021
|
$52.38
|
PP = $54.09
|
|
MB = $56.79
|
 Most Recent Note - 12/22/2021 5:12:05 PM
G - Posted a 2nd consecutive gain today with near average volume and hit a new all-time high. Very extended from any sound base. Reported Sep '21 quarterly earnings +308% on +140% sales revenues versus the year ago period. It is well above its 50 DMA line ($67.95) defines near-term support to watch.
>>> FEATURED STOCK ARTICLE : Perched at Record High After +52% Rally in 4 Months - 12/10/2021 |
View all notes |
Set NEW NOTE alert |
Company Profile |
SEC
News |
Chart |
Request a new note
C
A
S
I |
KFRC
-
NASDAQ
Kforce Inc
Comml Svcs-Staffing
|
$74.39
|
+0.53
0.72% |
$74.81
|
87,966
79.25% of 50 DAV
50 DAV is 111,000
|
$81.47
-8.69%
|
9/10/2021
|
$59.53
|
PP = $64.48
|
|
MB = $67.70
|
Most Recent Note - 12/21/2021 6:06:19 PM
G - Prior low ($71.05 on 12/14/21) defines important near-term support after finding prompt support at its 50 DMA line ($72.25). Recently reported Sep '21 quarterly earnings +8% on +10% sales revenues versus the year ago period, below the +25% minimum earnings guideline (C criteria), raising fundamental concerns.
>>> FEATURED STOCK ARTICLE : Extended From Base and Latest Quarter Earnings Growth Sub Par - 11/19/2021 |
View all notes |
Set NEW NOTE alert |
Company Profile |
SEC
News |
Chart |
Request a new note
C
A
S
I |
REGN
-
NASDAQ
Regeneron Pharmaceutical
DRUGS - Biotechnology
|
$617.48
|
+10.67
1.76% |
$619.24
|
727,885
89.74% of 50 DAV
50 DAV is 811,100
|
$686.62
-10.07%
|
12/13/2021
|
$647.95
|
PP = $686.72
|
|
MB = $721.06
|
Most Recent Note - 12/22/2021 5:20:53 PM
Y - Posted a gain today with below average volume, it halted its slide after recent volume-driven losses undercut its 50 DMA line ($622) raising concerns. Color code was recently changed to yellow with new pivot point cited based on its 9/01/21 high plus 10 cents. Subsequent gains above the pivot point backed by at least +40% above average volume may trigger a technical buy signal. Its Relative Strength rating has slumped to 80, right at the 80+ minimum guideline for buy candidates.
>>> FEATURED STOCK ARTICLE : Consolidating Near All-Time High With Little Resistance Remaining - 12/13/2021 |
View all notes |
Set NEW NOTE alert |
Company Profile |
SEC
News |
Chart |
Request a new note
C
A
S
I |
LLY
-
NYSE
Eli Lilly & Co
Medical-Diversified
|
$266.50
|
+1.62
0.61% |
$266.56
|
2,687,799
84.68% of 50 DAV
50 DAV is 3,174,000
|
$283.91
-6.13%
|
12/16/2021
|
$279.28
|
PP = $275.97
|
|
MB = $289.77
|
Most Recent Note - 12/21/2021 6:07:42 PM
Y - Posted a quiet gain today after retreating from its all-time high. Finished strong after highlighted in yellow in the 12/16/21 mid-day report with pivot point cited based on its 8/17/21 high plus 10 cents. This giant Medical - Diversified firm triggered a technical buy signal as it powered to new all-time highs with +78% above average volume behind its 5th consecutive gain after a choppy 17-week consolidation. Reported Sep '21 quarterly earnings +38% on +18% sales revenues versus the year ago period, and 3 of the past 4 quarterly comparisons were above the +25% minimum earnings guideline (C criteria). Annual earnings (A criteria) improved steadily since a downturn in FY '14.
>>> FEATURED STOCK ARTICLE : Eli Lilly & Co Powered to New Highs With Volume - 12/16/2021 |
View all notes |
Set NEW NOTE alert |
Company Profile |
SEC
News |
Chart |
Request a new note
C
A
S
I |
CAMT
-
NASDAQ
Camtek Ltd
ELECTRONICS - Scientific and Technical Instrum
|
$43.00
|
+0.54
1.27% |
$43.26
|
155,658
59.87% of 50 DAV
50 DAV is 260,000
|
$49.60
-13.31%
|
11/9/2021
|
$45.43
|
PP = $46.11
|
|
MB = $48.42
|
Most Recent Note - 12/22/2021 5:13:37 PM
G - Posted a quiet gain today closing just above its 50 DMA line ($42.81). Faces some resistance due to overhead supply up to the $49 level. Fundamentals remain strong.
>>> FEATURED STOCK ARTICLE : Closed Above 50-Day Average After Big Gain With Light Volume - 12/15/2021 |
View all notes |
Set NEW NOTE alert |
Company Profile |
SEC
News |
Chart |
Request a new note
C
A
S
I |
Symbol/Exchange
Company Name
Industry Group |
PRICE |
CHANGE
(%Change) |
Day High |
Volume
(% DAV)
(% 50 day avg vol) |
52 Wk Hi
% From Hi |
Featured
Date |
Price
Featured |
Pivot Featured |
|
Max Buy |
AMD
-
NASDAQ
Advanced Micro Devices
ELECTRONICS - Semiconductor - Broad Line
|
$143.88
|
-0.37
-0.26% |
$144.50
|
46,556,706
81.13% of 50 DAV
50 DAV is 57,387,000
|
$164.46
-12.51%
|
10/27/2021
|
$124.91
|
PP = $122.59
|
|
MB = $128.72
|
Most Recent Note - 12/21/2021 5:57:32 PM
G - Posted a big gain today with average volume as it rallied off of Its 50 DMA line ($136.87). The prior low ($130.60 on 12/14/21) defines the next important near term support where a violations may trigger a more worrisome technical sell signal. Fundamentals remain strong after it reported Sep '21 quarterly earnings +78% on +54% sales revenues versus the year ago period.
>>> FEATURED STOCK ARTICLE : AMD Pulling Back After Considerable Rally - 12/1/2021 |
View all notes |
Set NEW NOTE alert |
Company Profile |
SEC
News |
Chart |
Request a new note
C
A
S
I |
UMC
-
NYSE
United Microelectrnc Adr
ELECTRONICS - Semiconductor - Integrated Cir
|
$11.63
|
+0.21
1.84% |
$11.63
|
5,247,978
64.62% of 50 DAV
50 DAV is 8,121,000
|
$12.68
-8.28%
|
12/1/2021
|
$12.60
|
PP = $12.72
|
|
MB = $13.36
|
Most Recent Note - 12/21/2021 6:02:20 PM
Y - Posted a gain today with lighter volume. Recently retesting support near its 50 DMA line ($11.09). More damaging losses would raise concerns. A gain and solid close above the pivot point may help clinch a proper new (or add-on) technical buy signal. Reported Sep '21 quarterly earnings +100% on +30% sales revenues versus the year ago period.
>>> FEATURED STOCK ARTICLE : Rebound Above 50-Day Moving Average Showed Resilience - 11/30/2021 |
View all notes |
Set NEW NOTE alert |
Company Profile |
SEC
News |
Chart |
Request a new note
C
A
S
I |
ENTG
-
NASDAQ
Entegris Inc
ELECTRONICS - Semiconductor Equipment and Mate
|
$133.47
|
+0.51
0.38% |
$133.51
|
1,097,978
93.44% of 50 DAV
50 DAV is 1,175,000
|
$158.00
-15.53%
|
8/4/2021
|
$125.33
|
PP = $126.51
|
|
MB = $132.84
|
Most Recent Note - 12/22/2021 5:17:39 PM
G - Posted a 2nd consecutive gain today with lighter volume after damaging volume-driven losses. A rebound above the 50 DMA line ($142.88) is needed for its outlook to improve. Fundamentals remain strong after it recently reported Sep '21 quarterly earnings +37% on +20% sales revenues versus the year ago period.
>>> FEATURED STOCK ARTICLE : Best Ever Close After Volume-Driven Gain - 11/29/2021 |
View all notes |
Set NEW NOTE alert |
Company Profile |
SEC
News |
Chart |
Request a new note
C
A
S
I |
DHR
-
NYSE
Danaher Corp
Medical-Diversified
|
$319.68
|
+5.76
1.83% |
$320.69
|
2,081,011
76.99% of 50 DAV
50 DAV is 2,703,000
|
$333.96
-4.28%
|
12/16/2021
|
$321.36
|
PP = $334.06
|
|
MB = $350.76
|
Most Recent Note - 12/22/2021 5:24:03 PM
Y - Posted a gain today with below average volume, consolidating above its 50 DMA line and still perched within striking distance of its 52-week high. Highlighted in yellow with pivot point cited base on its 9/10/21 high plus 10 cents in the 12/16/21 mid-day report. Subsequent gains above the pivot point with at least +40% above average volume may trigger a technical buy signal. Fundamentals remain strong.
>>> FEATURED STOCK ARTICLE : Consolidating Near Prior Highs Above 50-Day Moving Average - 12/17/2021 |
View all notes |
Set NEW NOTE alert |
Company Profile |
SEC
News |
Chart |
Request a new note
C
A
S
I |
SKY
-
NYSE
Skyline Champion Corp
Bldg-Mobile/Mfg andamp; RV
|
$75.70
|
+2.46
3.36% |
$76.00
|
454,605
94.51% of 50 DAV
50 DAV is 481,000
|
$85.92
-11.89%
|
11/3/2021
|
$72.19
|
PP = $66.92
|
|
MB = $70.27
|
Most Recent Note - 12/22/2021 5:09:04 PM
G - Lighter volume was behind today's 2nd gain as it rebounded further above the 50 DMA line ($73.25) helping its outlook improve after 6 consecutive damaging volume-driven losses. The next important near-term support to watch is prior highs in the $66 area. Fundamentals remain strong.
>>> FEATURED STOCK ARTICLE : Pulling Back From All-Time High After Recent Rally - 12/14/2021 |
View all notes |
Set NEW NOTE alert |
Company Profile |
SEC
News |
Chart |
Request a new note
C
A
S
I |
Symbol/Exchange
Company Name
Industry Group |
PRICE |
CHANGE
(%Change) |
Day High |
Volume
(% DAV)
(% 50 day avg vol) |
52 Wk Hi
% From Hi |
Featured
Date |
Price
Featured |
Pivot Featured |
|
Max Buy |
DHI
-
NYSE
D R Horton Inc
MATERIALS and CONSTRUCTION - Residential Construction
|
$105.58
|
+2.09
2.02% |
$105.82
|
2,501,796
90.03% of 50 DAV
50 DAV is 2,779,000
|
$110.45
-4.41%
|
12/6/2021
|
$104.40
|
PP = $106.99
|
|
MB = $112.34
|
Most Recent Note - 12/22/2021 5:15:49 PM
Y - Posted a 2nd consecutive gain with below average volume. Showed stalling action since highlighted in yellow with pivot point cited based on its 5/10/21 high plus 10 cents in the 12/06/21 mid-day report. Reported Sep '21 earnings +68% on +27% sales revenues versus the year-ago period, its 8th strong quarterly comparison above the +25% minimum guideline (C criteria). Annual earnings growth (A criteria) has been strong.
>>> FEATURED STOCK ARTICLE : Builder Built a Solid Base And Challenged Prior High - 12/6/2021 |
View all notes |
Set NEW NOTE alert |
Company Profile |
SEC
News |
Chart |
Request a new note
C
A
S
I |
TITN
-
NASDAQ
Titan Machinery Inc
SPECIALTY RETAIL
|
$31.80
|
+0.00
0.00% |
$31.90
|
102,006
58.62% of 50 DAV
50 DAV is 174,000
|
$38.58
-17.57%
|
11/23/2021
|
$36.22
|
PP = $35.34
|
|
MB = $37.11
|
Most Recent Note - 12/20/2021 12:01:21 PM
G - Gapped down today violating its 50 DMA line ($31.25) with a 3rd consecutive volume-driven loss triggering a technical sell signal. Only a prompt rebound above the 50 DMA line would help its outlook improve. Reported Oct '21 quarterly earnings +81% on +26% sales revenues over the year ago period, its 4th strong quarterly comparison.
>>> FEATURED STOCK ARTICLE : Strong Close With Gain Backed by +467% Above Average Volume - 11/23/2021 |
View all notes |
Set NEW NOTE alert |
Company Profile |
SEC
News |
Chart |
Request a new note
C
A
S
I |
CLFD
-
NASDAQ
Clearfield Inc
TELECOMMUNICATIONS - Cables / Satalite Equipment
|
$74.74
|
-1.08
-1.42% |
$76.00
|
126,347
95.72% of 50 DAV
50 DAV is 132,000
|
$76.07
-1.75%
|
12/16/2021
|
$72.76
|
PP = $72.10
|
|
MB = $75.71
|
Most Recent Note - 12/21/2021 12:29:25 PM
Y - Perched near its all-time high with today's 3rd consecutive gain after recently trading in a wider range intra-day. Color code was changed to yellow with new pivot point cited based on its 11/15/21 high plus 10 cents. Recently formed a "square box" base as it found support well above its 50 DMA line ($62.06) when consolidating. A gain and close above the pivot point backed by at least +40% above average volume may trigger a new (or add-on) technical buy signal. Reported Sep '21 quarterly earnings +141% on +66% sales revenues above the year ago period.
>>> FEATURED STOCK ARTICLE : Perched Near High Extended From Any Sound Base - 11/22/2021 |
View all notes |
Set NEW NOTE alert |
Company Profile |
SEC
News |
Chart |
Request a new note
C
A
S
I |
ODFL
-
NASDAQ
Old Dominion Fght Line
TRANSPORTATION - Trucking
|
$344.03
|
+4.59
1.35% |
$344.63
|
561,420
90.99% of 50 DAV
50 DAV is 617,000
|
$373.58
-7.91%
|
12/7/2021
|
$365.61
|
PP = $364.17
|
|
MB = $382.38
|
Most Recent Note - 12/20/2021 12:04:24 PM
G - Violated its 50 DMA line ($340) with today's loss triggering a technical sell signal and its color code is changed to green. Only a prompt rebound above the 50 DMA line would help its outlook improve.
>>> FEATURED STOCK ARTICLE : Perched at All Time High After Tight Consolidation Several Weeks - 12/7/2021 |
View all notes |
Set NEW NOTE alert |
Company Profile |
SEC
News |
Chart |
Request a new note
C
A
S
I |
SMPL
-
NASDAQ
Simply Good Foods Co
Food-Confectionery
|
$40.04
|
+0.33
0.83% |
$40.15
|
278,407
64.60% of 50 DAV
50 DAV is 431,000
|
$41.35
-3.17%
|
12/22/2021
|
$40.04
|
PP = $41.45
|
|
MB = $43.52
|
Most Recent Note - 12/22/2021 4:58:47 PM
Y - Color code is changed to yellow with new pivot point cited based on its 11/08/21 high plus 10 cents. Consolidating above its 50 DMA line ($38.22). The prior low and 200 DMA line ($35.62) define the next important support. See he latest FSU analysis for more details and a new annotated graph.
>>> FEATURED STOCK ARTICLE : Formed New 5-Week Base and Perched Near Pivot Point - 12/22/2021 |
View all notes |
Set NEW NOTE alert |
Company Profile |
SEC
News |
Chart |
Request a new note
C
A
S
I |
Symbol/Exchange
Company Name
Industry Group |
PRICE |
CHANGE
(%Change) |
Day High |
Volume
(% DAV)
(% 50 day avg vol) |
52 Wk Hi
% From Hi |
Featured
Date |
Price
Featured |
Pivot Featured |
|
Max Buy |
WDAY
-
NYSE
Workday Inc Cl A
Computer Sftwr-Enterprse
|
$277.88
|
-0.98
-0.35% |
$280.65
|
1,005,369
61.14% of 50 DAV
50 DAV is 1,644,400
|
$307.81
-9.72%
|
9/7/2021
|
$275.69
|
PP = $282.87
|
|
MB = $297.01
|
Most Recent Note - 12/22/2021 5:22:04 PM
G - Its Relative Strength Rating has fallen to 73, below the 80+ minimum guideline for buy candidates while recently sputtering just below its 50 DMA line ($281.47). A rebound above the 50 DMA line is needed for its outlook to improve. Prior low ($258.22 on 12/06/21) and 200 DMA line ($253.70) define the next important support to watch. Reported Oct '21 quarterly earnings +28% on +20% sales revenues versus the year ago period. Fundamentals remain strong.
>>> FEATURED STOCK ARTICLE : Getting Extended From Previously Noted Base - 11/16/2021 |
View all notes |
Set NEW NOTE alert |
Company Profile |
SEC
News |
Chart |
Request a new note
C
A
S
I |
TTD
-
NASDAQ
The Trade Desk Inc Cl A
Comml Svcs-Advertising
|
$93.49
|
-0.04
-0.04% |
$94.14
|
2,377,467
43.83% of 50 DAV
50 DAV is 5,424,000
|
$114.09
-18.06%
|
11/9/2021
|
$95.16
|
PP = $90.00
|
|
MB = $94.50
|
Most Recent Note - 12/21/2021 6:01:11 PM
G - Today's gain with below average volume helped it rebound above the prior high ($90) after finding prompt support near its 50 DMA line ($89.21). Recent resilience has helped its outlook improve, but it faces overhead supply up to the $114 level.
>>> FEATURED STOCK ARTICLE : Quietly Slumping Into Prior Base and Below 50-Day Moving Average - 12/20/2021 |
View all notes |
Set NEW NOTE alert |
Company Profile |
SEC
News |
Chart |
Request a new note
C
A
S
I |
MEDP
-
NASDAQ
Medpace Holdings Inc
Medical-Research Eqp/Svc
|
$221.78
|
+4.36
2.01% |
$222.11
|
167,844
98.73% of 50 DAV
50 DAV is 170,000
|
$231.00
-3.99%
|
9/10/2021
|
$196.32
|
PP = $196.22
|
|
MB = $206.03
|
Most Recent Note - 12/21/2021 6:11:26 PM
G - Found support near its 50 DMA line ($210) recently, and prior highs in the $199 area also define important near-term support to watch. More damaging losses may trigger a worrisome technical sell signal. Recently noted repeatedly - "Sep '21 earnings rose +18% on +28% sales revenues versus the year ago period, below the +25% minimum earnings guideline (C criteria), raising fundamental concerns.
>>> FEATURED STOCK ARTICLE : Medpace Hovering at High With Volume Totals Cooling - 11/17/2021 |
View all notes |
Set NEW NOTE alert |
Company Profile |
SEC
News |
Chart |
Request a new note
C
A
S
I |
AVTR
-
NYSE
Avantor Inc
Medical-Research Eqp/Svc
|
$41.10
|
+0.15
0.37% |
$41.64
|
3,491,659
85.39% of 50 DAV
50 DAV is 4,089,000
|
$44.37
-7.37%
|
6/10/2021
|
$32.94
|
PP = $34.09
|
|
MB = $35.79
|
Most Recent Note - 12/21/2021 5:55:21 PM
G - Posted a 3rd solid volume-driven gain in the span of 5 session, rebounding further above its 50 DMA line ($39) helping its technical stance improve. Faces overhead supply up to the $44 level. Prior lows in the high $36 area define important near-term support. Reported Sep '21 quarterly earnings +46% above the year ago period. Completed a Secondary Offering on 9/13/21. See the latest FSU analysis for more details and a new annotated graph.
>>> FEATURED STOCK ARTICLE : Rebounding With Volume-Driven Gains - 12/21/2021 |
View all notes |
Set NEW NOTE alert |
Company Profile |
SEC
News |
Chart |
Request a new note
C
A
S
I |
MIME
-
NASDAQ
Mimecast Limited
Computer Sftwr-Security
|
$79.11
|
+0.10
0.13% |
$79.33
|
2,276,472
156.78% of 50 DAV
50 DAV is 1,452,000
|
$85.48
-7.45%
|
10/18/2021
|
$68.17
|
PP = $71.55
|
|
MB = $75.13
|
Most Recent Note - 12/22/2021 5:10:31 PM
It will be dropped from the Featured Stocks list tonight. Holding its ground after a gap up on 12/07/21 M&A news. Found prompt support at its 50 DMA line.
>>> FEATURED STOCK ARTICLE : Extended From Latest Base While Fundamentals Remain Strong - 11/26/2021 |
View all notes |
Set NEW NOTE alert |
Company Profile |
SEC
News |
Chart |
Request a new note
C
A
S
I |
Symbol/Exchange
Company Name
Industry Group |
PRICE |
CHANGE
(%Change) |
Day High |
Volume
(% DAV)
(% 50 day avg vol) |
52 Wk Hi
% From Hi |
Featured
Date |
Price
Featured |
Pivot Featured |
|
Max Buy |
|
|
|
THESE ARE NOT BUY RECOMMENDATIONS!
Comments contained in the body of this report are technical
opinions only. The material herein has been obtained
from sources believed to be reliable and accurate, however,
its accuracy and completeness cannot be guaranteed.
This site is not an investment advisor, hence it does
not endorse or recommend any securities or other investments.
Any recommendation contained in this report may not
be suitable for all investors and it is not to be deemed
an offer or solicitation on our part with respect to
the purchase or sale of any securities. All trademarks,
service marks and trade names appearing in this report
are the property of their respective owners, and are
likewise used for identification purposes only.
This report is a service available
only to active Paid Premium Members.
You may opt-out of receiving report notifications
at any time. Questions or comments may be submitted
by writing to Premium Membership Services 665 S.E. 10 Street, Suite 201 Deerfield Beach, FL 33441-5634 or by calling 1-800-965-8307
or 954-785-1121.
|
|
|