***Last / Change / Volume data in this table is the closing quote data***
Symbol/Exchange
Company Name
Industry Group |
PRICE |
CHANGE
(%Change) |
Day High |
Volume
(% DAV)
(% 50 day avg vol) |
52 Wk Hi
% From Hi |
Featured
Date |
Price
Featured |
Pivot Featured |
|
Max Buy |
THO
-
NYSE
Thor Industries Inc
AUTOMOTIVE - Recreational Vehicles
|
$110.72
|
-0.57
-0.51% |
$110.88
|
312,145
58.34% of 50 DAV
50 DAV is 535,000
|
$111.81
-0.97%
|
1/24/2017
|
$100.52
|
PP = $108.45
|
|
MB = $113.87
|
Most Recent Note - 2/13/2017 5:47:38 PM
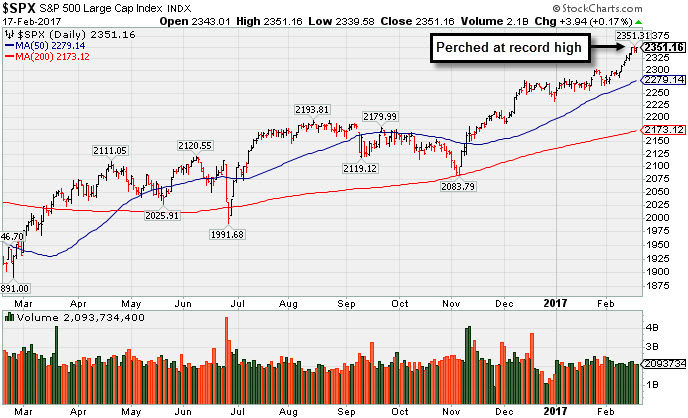
Y - Perched near record highs, stubbornly holding its ground with volume totals cooling. Gapped up on 2/08/17 and rallied above its pivot point with a gain backed by very near the +40% above average volume needed to trigger a proper technical buy signal.
>>> FEATURED STOCK ARTICLE : Rose From Support at 50-Day Moving Average Line - 1/24/2017 |
View all notes |
Set NEW NOTE alert |
Company Profile |
SEC
News |
Chart |
Request a new note
C
A
S
I |
SBCF
-
NASDAQ
Seacoast Banking Corp Fl
BANKING - Regional - Mid-Atlantic Banks
|
$23.70
|
-0.53
-2.19% |
$24.24
|
897,468
310.54% of 50 DAV
50 DAV is 289,000
|
$25.13
-5.69%
|
2/13/2017
|
$24.84
|
PP = $23.10
|
|
MB = $24.26
|
 Most Recent Note - 2/17/2017 12:04:51 PM
Y - Holding its ground stubbornly since its 2/13/17 gap up was highlighted in yellow with pivot point cited based on its 1/04/17 high plus 10 cents. Its solid volume-driven gain clinched a technical buy signal. Completed a new Public Offering on 2/15/17. Prior highs in the $23 area define initial support to watch. See the latest FSU analysis for more details and an annotated graph.
>>> FEATURED STOCK ARTICLE : Gap Up Gain and Strong Finish Triggered Technical Buy Signal - 2/13/2017 |
View all notes |
Set NEW NOTE alert |
Company Profile |
SEC
News |
Chart |
Request a new note
C
A
S
I |
CSFL
-
NASDAQ
Centerstate Banks Inc
Banks-Southeast
|
$25.36
|
-0.09
-0.35% |
$25.45
|
222,438
76.70% of 50 DAV
50 DAV is 290,000
|
$26.30
-3.57%
|
10/10/2016
|
$18.20
|
PP = $18.37
|
|
MB = $19.29
|
Most Recent Note - 2/13/2017 5:36:48 PM
G - Recently finding support after sputtering near its 50 DMA line ($24.83). Recent low ($23.80 on 2/08/17) defines important near-term support where further deterioration would trigger a technical sell signal. Completed a new Public Offering of shares on 1/10/17.
>>> FEATURED STOCK ARTICLE : Found Support Near 50-Day Average Following Offering - 2/6/2017 |
View all notes |
Set NEW NOTE alert |
Company Profile |
SEC
News |
Chart |
Request a new note
C
A
S
I |
IESC
-
NASDAQ
Integrated Electric Svcs
Bldg-Maintenance and Svc
|
$20.00
|
-0.20
-0.99% |
$20.20
|
55,706
85.97% of 50 DAV
50 DAV is 64,800
|
$23.00
-13.04%
|
11/23/2016
|
$19.35
|
PP = $18.26
|
|
MB = $19.17
|
Most Recent Note - 2/13/2017 5:51:18 PM
G - Consolidating above its 50 DMA line ($19.78) with a volume-driven loss today. Prior low ($18.05 on 1/18/17) defines important support near prior highs. Recently reported Dec '16 quarterly earnings -33% on +27% sales revenues, below the +25% minimum earnings guideline (C criteria), raising fundamental concerns.
>>> FEATURED STOCK ARTICLE : Violated 50-Day Moving Average Line and Now Testing Prior Highs - 1/19/2017 |
View all notes |
Set NEW NOTE alert |
Company Profile |
SEC
News |
Chart |
Request a new note
C
A
S
I |
NSP
-
NYSE
Insperity Inc
Comml Svcs-Outsourcing
|
$84.30
|
-1.60
-1.86% |
$85.10
|
189,657
132.63% of 50 DAV
50 DAV is 143,000
|
$86.35
-2.37%
|
2/14/2017
|
$84.30
|
PP = $82.28
|
|
MB = $86.39
|
Most Recent Note - 2/14/2017 6:06:56 PM
Y - Finished near the middle of its range today after highlighted in yellow with pivot point cited based on its 7/26/16 high plus 10 cents in the earlier mid-day report (read here) noted - "Spiked to new all-time highs today after a considerable volume-driven gain on the prior session triggering a technical buy signal. Reported earnings +76% on +12% sales revenues for the Dec '16 quarter, and prior quarters showed strong earnings increases above the +25% minimum guideline (C criteria). Annual earnings (A criteria) history has improved after a downturn in FY '13." See the latest FSU analysis for more details and a new annotated graph.
>>> FEATURED STOCK ARTICLE : Big Volume-Driven Gains Indicative of Institutional Demand - 2/14/2017 |
View all notes |
Set NEW NOTE alert |
Company Profile |
SEC
News |
Chart |
Request a new note
C
A
S
I |
Symbol/Exchange
Company Name
Industry Group |
PRICE |
CHANGE
(%Change) |
Day High |
Volume
(% DAV)
(% 50 day avg vol) |
52 Wk Hi
% From Hi |
Featured
Date |
Price
Featured |
Pivot Featured |
|
Max Buy |
BERY
-
NYSE
Berry Plastics Group Inc
CONSUMER NON-DURABLES - Packaging and Containers
|
$50.70
|
+0.39
0.78% |
$50.94
|
1,773,124
143.92% of 50 DAV
50 DAV is 1,232,000
|
$52.97
-4.29%
|
11/30/2016
|
$50.26
|
PP = $46.47
|
|
MB = $48.79
|
Most Recent Note - 2/13/2017 5:43:42 PM
G - Its Relative Strength Rating has slumped to 77, below the 80+ minimum for buy candidates under the fact-based investment system. Sputtering near recent lows in the $48.50 area defining near-term support. Damaging losses and violations would trigger a more worrisome technical sell signal. Reported earnings +43% on -7% sales revenues for the Dec '16 quarter. See the latest FSU analysis for more details and an annotated graph.
>>> FEATURED STOCK ARTICLE : Recent 50-Day Violation Raised Concerns - 2/7/2017 |
View all notes |
Set NEW NOTE alert |
Company Profile |
SEC
News |
Chart |
Request a new note
C
A
S
I |
EVR
-
NYSE
Evercore Partners Inc
FINANCIAL SERVICES - Investment Banking
|
$80.45
|
+0.30
0.37% |
$80.60
|
461,662
110.18% of 50 DAV
50 DAV is 419,000
|
$81.75
-1.59%
|
1/5/2017
|
$71.40
|
PP = $72.07
|
|
MB = $75.67
|
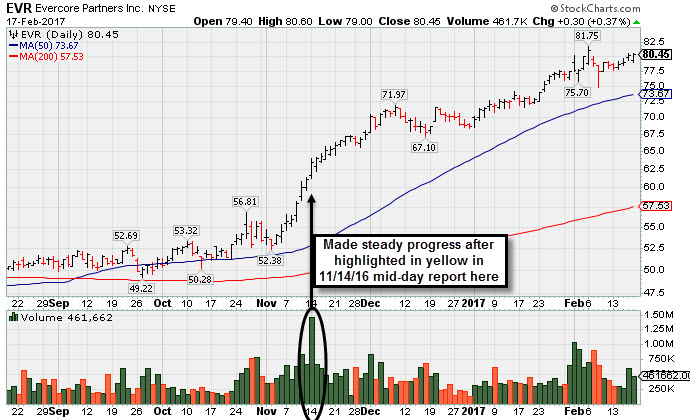
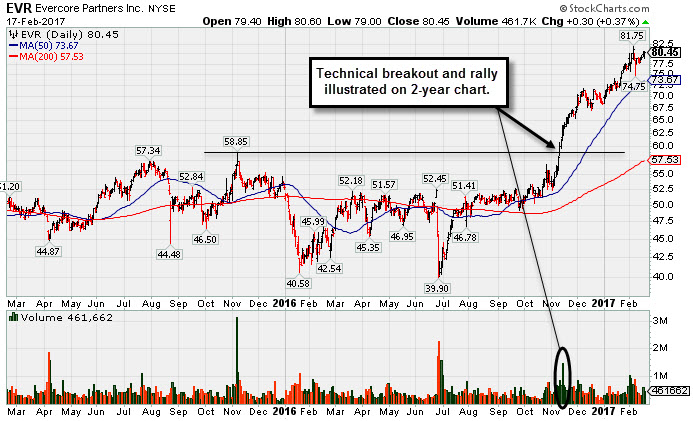
Most Recent Note - 2/17/2017 6:04:47 PM
G - Holding its ground stubbornly while extended from its prior base. Recently reported Dec '16 quarterly earnings +17% on +9% sales revenues, below the +25% minimum earnings guideline (C criteria), raising fundamental concerns. See the latest FSU analysis for more details and a new annotated graph.
>>> FEATURED STOCK ARTICLE : Holding Ground After Latest Earnings Were Below +25% Guideline - 2/17/2017 |
View all notes |
Set NEW NOTE alert |
Company Profile |
SEC
News |
Chart |
Request a new note
C
A
S
I |
NTES
-
NASDAQ
Netease Inc Adr
INTERNET - Internet Information Providers
|
$297.25
|
-1.48
-0.50% |
$297.93
|
1,956,795
194.51% of 50 DAV
50 DAV is 1,006,000
|
$299.68
-0.81%
|
2/10/2017
|
$259.30
|
PP = $272.68
|
|
MB = $286.31
|
Most Recent Note - 2/17/2017 11:59:15 AM
Y - Triggered a technical buy signal with a big "breakaway gap" backed by heavy volume on the prior session. Reported earnings +57% on +43% sales revenues for the Dec '16 quarter, continuing its strong earnings track record. NTES was highlighted in yellow with new pivot point cited based on its 10/14/16 high plus 10 cents in the 2/10/17 mid-day report (read here) when noted - "Subsequent volume driven gains for new highs may trigger a technical buy signal. Due to report Dec '16 earnings on 2/15/17 and volume and volatility often increase near earnings news. Gradually rebounding after dropped from the Featured Stocks list on 12/12/16."
>>> FEATURED STOCK ARTICLE : Rebounding With Earnings News Due Soon - 2/10/2017 |
View all notes |
Set NEW NOTE alert |
Company Profile |
SEC
News |
Chart |
Request a new note
C
A
S
I |
STMP
-
NASDAQ
Stamps.com Inc
INTERNET - Internet Software and Services
|
$131.50
|
+2.95
2.29% |
$131.90
|
268,852
131.15% of 50 DAV
50 DAV is 205,000
|
$132.30
-0.60%
|
2/16/2017
|
$129.45
|
PP = $123.85
|
|
MB = $130.04
|
Most Recent Note - 2/16/2017 5:24:29 PM
Y - It was highlighted in yellow with pivot point cited based on its 3/07/16 high plus 10 cents in the earlier mid-day report while noted - "Subsequent volume-driven gains may help clinch a convincing technical buy signal. Recently it has been wedging to new highs with gains lacking great volume conviction. Due to report Dec'16 earnings on 2/23/17. Reported earnings +104% on +79% sales revenues for the Sep '16 quarter, continuing its strong growth track record. Went through a deep and choppy consolidation after dropped from the Featured Stocks list on 1/15/16.
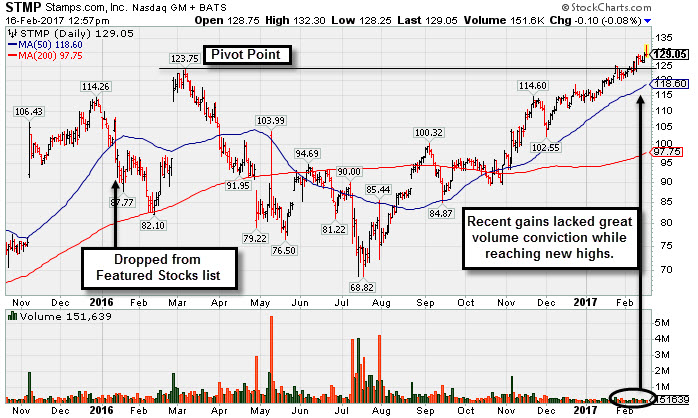 " See the latest FSU analysis for more details and a new annotated graph. " See the latest FSU analysis for more details and a new annotated graph.
>>> FEATURED STOCK ARTICLE : Recent Gains Have Lacked Heavy Volume Indicative of Accumulation - 2/16/2017 |
View all notes |
Set NEW NOTE alert |
Company Profile |
SEC
News |
Chart |
Request a new note
C
A
S
I |
HTHT
-
NASDAQ
China Lodging Group Ads
LEISURE - Lodging
|
$55.98
|
-1.32
-2.30% |
$58.62
|
80,366
52.53% of 50 DAV
50 DAV is 153,000
|
$59.20
-5.44%
|
9/29/2016
|
$46.12
|
PP = $47.82
|
|
MB = $50.21
|
Most Recent Note - 2/16/2017 12:23:34 PM
G - Challenging its 52-week high with today's gain backed by above average volume. Prior highs in the $54 area define near-term support above its 50 DMA line. Repeatedly noted with caution in prior reports - "Reported earnings +10% on +6% sales revenues for the Sep '16 quarter, below the +25% minimum earnings guideline (C criteria), raising concerns." See the latest FSU analysis for more details and a new annotated graph.
>>> FEATURED STOCK ARTICLE : Mostly Bullish Action Continues Since Latest Earnings Report - 2/9/2017 |
View all notes |
Set NEW NOTE alert |
Company Profile |
SEC
News |
Chart |
Request a new note
C
A
S
I |
Symbol/Exchange
Company Name
Industry Group |
PRICE |
CHANGE
(%Change) |
Day High |
Volume
(% DAV)
(% 50 day avg vol) |
52 Wk Hi
% From Hi |
Featured
Date |
Price
Featured |
Pivot Featured |
|
Max Buy |
LMAT
-
NASDAQ
Lemaitre Vascular Inc
Medical-Products
|
$23.80
|
+0.61
2.63% |
$24.00
|
83,929
78.44% of 50 DAV
50 DAV is 107,000
|
$27.04
-11.97%
|
12/22/2016
|
$24.99
|
PP = $25.09
|
|
MB = $26.34
|
Most Recent Note - 2/16/2017 5:29:15 PM
G - Met resistance at its 50 DMA line this week while rebounding. A rally above its 50 DMA line ($23.82) would help its outlook to improve.
>>> FEATURED STOCK ARTICLE : Concerns Increase While Lingering Below 50-Day Moving Average - 1/27/2017 |
View all notes |
Set NEW NOTE alert |
Company Profile |
SEC
News |
Chart |
Request a new note
C
A
S
I |
BEAT
-
NASDAQ
BioTelemetry Inc
Medical-Services
|
$24.95
|
+0.10
0.40% |
$25.10
|
289,848
97.92% of 50 DAV
50 DAV is 296,000
|
$25.94
-3.83%
|
2/14/2017
|
$25.10
|
PP = $24.55
|
|
MB = $25.78
|
Most Recent Note - 2/15/2017 12:10:48 PM
Y - Gapped up today hitting another new high. Yesterday in the mid-day report it was highlighted in yellow with new pivot point cited based on its 2/06/17 high plus 10 cents after a saucer-with-handle base above its prior base. The volume-driven gain above its pivot point was backed by +121% above average volume triggering a new (or add-on) technical buy signal. Prior highs in the $24 area and its 50 DMA line ($22.49) define important near-term support.
>>> FEATURED STOCK ARTICLE : Volume Totals Cooling While Consolidating Above Prior Highs - 1/10/2017 |
View all notes |
Set NEW NOTE alert |
Company Profile |
SEC
News |
Chart |
Request a new note
C
A
S
I |
PATK
-
NASDAQ
Patrick Industries Inc
WHOLESALE - Building Materials Wholesale
|
$78.35
|
-2.65
-3.27% |
$81.00
|
156,290
128.11% of 50 DAV
50 DAV is 122,000
|
$86.10
-9.00%
|
11/29/2016
|
$72.45
|
PP = $69.63
|
|
MB = $73.11
|
Most Recent Note - 2/16/2017 12:43:55 PM
G - Reported earnings +14% on +30% sales revenues for the Dec '16 quarter, below the +25% minimum earnings guideline (C criteria) raising fundamental concerns. Finding support at its 50 DMA line ($79.05) after it tested recent lows in the $76 area. More damaging losses may trigger a technical sell signal.
>>> FEATURED STOCK ARTICLE : Perched Near All-Time High Extended From Prior Base - 1/31/2017 |
View all notes |
Set NEW NOTE alert |
Company Profile |
SEC
News |
Chart |
Request a new note
C
A
S
I |
ESNT
-
NYSE
Essent Group Ltd
Finance-MrtgandRel Svc
|
$35.68
|
-0.54
-1.49% |
$36.17
|
913,994
139.12% of 50 DAV
50 DAV is 657,000
|
$38.10
-6.35%
|
1/25/2017
|
$34.09
|
PP = $34.04
|
|
MB = $35.74
|
Most Recent Note - 2/16/2017 5:34:21 PM
G - It is still extended from any sound base. Its 50 DMA line and prior highs define important near-term support in the $33-34 area. Reported earnings +42% on +30% sales revenues for the Dec '16 quarter, continuing its strong earnings track record.
>>> FEATURED STOCK ARTICLE : Twice Average Volume Behind Big Breakout Gain - 1/25/2017 |
View all notes |
Set NEW NOTE alert |
Company Profile |
SEC
News |
Chart |
Request a new note
C
A
S
I |
ANET
-
NYSE
Arista Networks Inc
TELECOMMUNICATIONS - Communication Equipment
|
$119.06
|
+18.89
18.86% |
$119.45
|
5,909,700
811.77% of 50 DAV
50 DAV is 728,000
|
$103.00
15.59%
|
12/30/2016
|
$96.77
|
PP = $99.00
|
|
MB = $103.95
|
Most Recent Note - 2/17/2017 11:38:34 AM
Y - Hitting a new 52-week high with today's big "breakaway gap" after reporting earnings +30% on +34% sales revenues for the Dec '16 quarter. . Color code was changed to yellow as it was noted - "Recovered impressively and faces no resistance due to overhead supply, but it has not formed a sound base after its gap down on 1/17/17."
>>> FEATURED STOCK ARTICLE : Technical Damages Raised Concern and Triggered Technical Sell Signal - 1/18/2017 |
View all notes |
Set NEW NOTE alert |
Company Profile |
SEC
News |
Chart |
Request a new note
C
A
S
I |
Symbol/Exchange
Company Name
Industry Group |
PRICE |
CHANGE
(%Change) |
Day High |
Volume
(% DAV)
(% 50 day avg vol) |
52 Wk Hi
% From Hi |
Featured
Date |
Price
Featured |
Pivot Featured |
|
Max Buy |
VBTX
-
NASDAQ
Veritex Holdings Inc
BANKING - Regional - Southwest Banks
|
$29.11
|
+0.35
1.22% |
$29.22
|
62,776
62.15% of 50 DAV
50 DAV is 101,000
|
$29.33
-0.75%
|
1/23/2017
|
$27.30
|
PP = $27.87
|
|
MB = $29.26
|
Most Recent Note - 2/14/2017 6:08:36 PM
Y - Posted a solid gain today with above average volume and finished near the session high. Prior highs in the $27 area define initial support above its 50 DMA line ($26.05).
>>> FEATURED STOCK ARTICLE : Challenged Highs But Ended in Bottom Third of Intra-day Range - 1/23/2017 |
View all notes |
Set NEW NOTE alert |
Company Profile |
SEC
News |
Chart |
Request a new note
C
A
S
I |
SFBS
-
NASDAQ
Servisfirst Bancshares
BANKING - Regional - Southeast Banks
|
$41.87
|
-0.43
-1.02% |
$42.45
|
192,973
82.82% of 50 DAV
50 DAV is 233,000
|
$42.35
-1.13%
|
7/19/2016
|
$26.64
|
PP = $26.41
|
|
MB = $27.73
|
Most Recent Note - 2/13/2017 1:00:04 PM
G - Hitting another new all-time high today. Recently reported earnings +8% on +20% sales revenues for the Dec '16 quarter, below the +25% minimum guideline (C criteria), raising fundamental concerns. Its 50 DMA line ($37.52) defines important near-term support above recent lows in the $36 area. Subsequent violations would trigger technical sell signals.
>>> FEATURED STOCK ARTICLE : Stubbornly Holding Ground Near Highs - 1/12/2017 |
View all notes |
Set NEW NOTE alert |
Company Profile |
SEC
News |
Chart |
Request a new note
C
A
S
I |
LITE
-
NASDAQ
Lumentum Holdings Inc
TELECOMMUNICATIONS - Cables / Satalite Equipment
|
$51.10
|
-0.75
-1.45% |
$51.40
|
1,279,018
105.44% of 50 DAV
50 DAV is 1,213,000
|
$52.00
-1.73%
|
2/8/2017
|
$44.60
|
PP = $44.80
|
|
MB = $47.04
|
Most Recent Note - 2/16/2017 5:27:08 PM
G - Hit another new high today, getting very extended from its prior base with a spurt of volume-driven gains. Prior highs in the $44-45 area define initial support to watch on pullbacks.
>>> FEATURED STOCK ARTICLE : Gap Up Gain and Strong Finish Triggered Technical Buy Signal - 2/8/2017 |
View all notes |
Set NEW NOTE alert |
Company Profile |
SEC
News |
Chart |
Request a new note
C
A
S
I |
LCII
-
NYSE
L C I Industries
MATERIALS and CONSTRUCTION - General Building Materials
|
$108.95
|
-0.90
-0.82% |
$109.70
|
129,188
75.99% of 50 DAV
50 DAV is 170,000
|
$117.15
-7.00%
|
11/29/2016
|
$106.29
|
PP = $101.00
|
|
MB = $106.05
|
Most Recent Note - 2/14/2017 12:28:22 PM
G - Rebounded from the session's early lows after dipping further below its 50 DMA line and also undercutting the prior low ($105.05 on 1/20/17) raising concerns. Further deterioration may trigger a more worrisome technical sell signal. A rebound above the 50 DMA line ($109.67) is needed for its outlook to improve. Fundamentals through Dec '16 remain strong.
>>> FEATURED STOCK ARTICLE : Distributional Action While Retreating From Highs - 1/30/2017 |
View all notes |
Set NEW NOTE alert |
Company Profile |
SEC
News |
Chart |
Request a new note
C
A
S
I |