You are not logged in.
This means you
CAN ONLY VIEW reports that were published prior to Wednesday, April 30, 2025.
You
MUST UPGRADE YOUR MEMBERSHIP if you want to see any current reports.
AFTER MARKET UPDATE - WEDNESDAY, FEBRUARY 15TH, 2017
Previous After Market Report Next After Market Report >>>
|
|
|
|
DOW |
+107.45 |
20,611.86 |
+0.52% |
|
Volume |
974,603,980 |
+3% |
|
Volume |
1,913,468,050 |
+10% |
|
NASDAQ |
+36.87 |
5,819.44 |
+0.64% |
|
Advancers |
1,739 |
59% |
|
Advancers |
1,822 |
64% |
|
S&P 500 |
+11.67 |
2,349.25 |
+0.50% |
|
Decliners |
1,206 |
41% |
|
Decliners |
1,019 |
36% |
|
Russell 2000 |
+7.56 |
1,404.21 |
+0.54% |
|
52 Wk Highs |
267 |
|
|
52 Wk Highs |
269 |
|
|
S&P 600 |
+4.72 |
857.91 |
+0.55% |
|
52 Wk Lows |
15 |
|
|
52 Wk Lows |
33 |
|
|
 |
Rally Continues With Volume Higher Behind Gains
Kenneth J. Gruneisen - Passed the CAN SLIM® Master's Exam
Stocks finished higher on Wednesday. The Dow was up 107 points to 20611. The S&P 500 added 11 points to 2349 and the Nasdaq Composite gained 36 points to 5819. Volume totals were higher than the prior session totals on the NYSE and on the Nasdaq exchange, a sign of increasing institutional buying demand. Breadth was positive as advancers led decliners by nearly a 3-2 margin on the NYSE and by a 9-5 margin on the Nasdaq exchange. There were 70 high-ranked companies from the Leaders List that made new 52-week highs and were listed on the BreakOuts Page, versus the total of 56 on the prior session. New 52-week highs totals expanded and solidly outnumbered new 52-week lows on both the NYSE and the Nasdaq exchange.
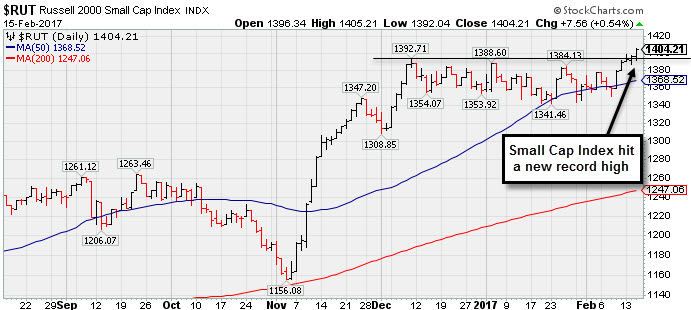
PICTURED: The Russell 2000 Small Cap Index rallied for a new record high with a 5th consecutive gain that puts the index up +2.9% year-to-date.
Leadership remains healthy as the major averages' (M criteria) have maintained an upward trend. New buying efforts should only be made in candidates with superior fundamental and technical characteristics. The Featured Stocks Page lists noteworthy high-ranked leaders.
The major averages advanced on Wednesday, notching fresh record highs for a fifth session amid stronger-than-expected economic data. A gauge of inflation showed that consumer prices rose 0.6% in January, the fastest pace in nearly four years. In the 12 months through January, the CPI expanded 2.5%, the biggest year-on-year gain since March 2012. Separately, retail sales increased 0.4%, following a solid 1% gain the previous month.
Seven of 11 sectors in the S&P 500 ended in positive territory. Health Care shares outperformed with Mylan (MYL +4.15%) rose. Financials continued their recent run of strength as Charles Schwab (SCHW +2.18%) rose Airline stocks led Industrials higher with Southwest Airlines (LUV +3.58%) rising. In the consumer space, Procter & Gamble (PG +3.71%) rose amid reports Nelson Peltz's firm disclosed a stake worth $5.3 billion in the company. Groupon (GRPN +22.75%) rallied after posting strong results in the quarter. Shares of American International Group (AIG -9.03%) fell hard as the insurer's net loss widened to $3.04 billion from $1.84 billion a year earlier.
Treasuries finished lower with the benchmark 10-year note down 8/32 to yield 2.50%. In commodities, NYMEX WTI crude lost 0.3% to $53.06/barrel. In FOREX, the Dollar Index fell 0.2%. |
 Kenneth J. Gruneisen started out as a licensed stockbroker in August 1987, a couple of months prior to the historic stock market crash that took the Dow Jones Industrial Average down -22.6% in a single day. He has published daily fact-based fundamental and technical analysis on high-ranked stocks online for two decades. Through FACTBASEDINVESTING.COM, Kenneth provides educational articles, news, market commentary, and other information regarding proven investment systems that work in good times and bad.
Comments contained in the body of this report are technical opinions only and are not necessarily those of Gruneisen Growth Corp. The material herein has been obtained from sources believed to be reliable and accurate, however, its accuracy and completeness cannot be guaranteed. Our firm, employees, and customers may effect transactions, including transactions contrary to any recommendation herein, or have positions in the securities mentioned herein or options with respect thereto. Any recommendation contained in this report may not be suitable for all investors and it is not to be deemed an offer or solicitation on our part with respect to the purchase or sale of any securities. |
|
 |
Financial, Retail, and Tech Groups Rose
Kenneth J. Gruneisen - Passed the CAN SLIM® Master's Exam
The Broker/Dealer Index ($XBD +1.07%) and the Bank Index ($BKX +0.99%) rose and again underpinned the major indices' advance on Wednesday. A modest gain from the Retail Index ($RLX +0.62%) continued to help the market's positive bias. The tech sector again was led by the Biotechnology Index ($BTK +1.18%) while the Semiconductor Index ($SOX +0.62%) posted a smaller gain but the Networking Index ($NWX +0.00%) finished flat. Commodity-linked groups were weaker as the Oil Services Index ($OSX -1.24%), Integrated Oil Index ($XOI -0.45%), and the Gold & Silver Index ($XAU -0.91%) each lost ground. Charts courtesy www.stockcharts.com
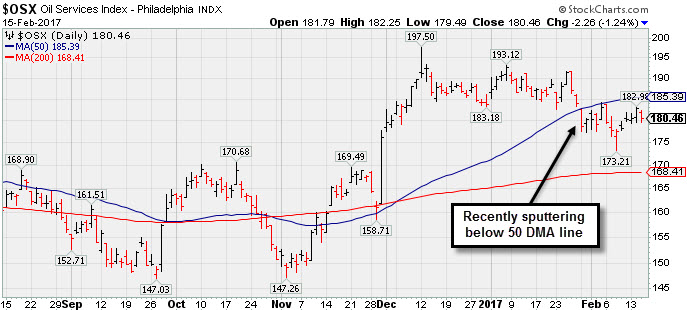 PICTURED: The Oil Services Index ($OSX -1.24%) has been sputtering below its 50-day moving average (DMA) line.
| Oil Services |
$OSX |
180.46 |
-2.27 |
-1.24% |
-1.81% |
| Integrated Oil |
$XOI |
1,224.31 |
-5.52 |
-0.45% |
-3.44% |
| Semiconductor |
$SOX |
970.54 |
+7.91 |
+0.82% |
+7.07% |
| Networking |
$NWX |
463.88 |
-0.01 |
-0.00% |
+3.99% |
| Broker/Dealer |
$XBD |
227.65 |
+2.42 |
+1.07% |
+10.90% |
| Retail |
$RLX |
1,430.30 |
+8.85 |
+0.62% |
+6.50% |
| Gold & Silver |
$XAU |
93.40 |
-0.87 |
-0.92% |
+18.44% |
| Bank |
$BKX |
96.89 |
+0.95 |
+0.99% |
+5.56% |
| Biotech |
$BTK |
3,459.88 |
+40.32 |
+1.18% |
+12.52% |
|
|
|
 |
Seriously Applying the Fact-Based System Now
Kenneth J. Gruneisen - Passed the CAN SLIM® Master's Exam
Asset Management Services Using the Fact-Based Investment System You can have professional help in limiting your losses and maximizing your gains in all market environments. For help with how your portfolio is managed click here and indicate "Find a Broker". Account minimum $250,000. |
|
|
Color Codes Explained :
Y - Better candidates highlighted by our
staff of experts.
G - Previously featured
in past reports as yellow but may no longer be buyable under the
guidelines.
***Last / Change / Volume data in this table is the closing quote data***
Symbol/Exchange
Company Name
Industry Group |
PRICE |
CHANGE
(%Change) |
Day High |
Volume
(% DAV)
(% 50 day avg vol) |
52 Wk Hi
% From Hi |
Featured
Date |
Price
Featured |
Pivot Featured |
|
Max Buy |
THO
-
NYSE
Thor Industries Inc
AUTOMOTIVE - Recreational Vehicles
|
$111.32
|
+1.54
1.40% |
$111.81
|
437,438
80.26% of 50 DAV
50 DAV is 545,000
|
$111.40
-0.07%
|
1/24/2017
|
$100.52
|
PP = $108.45
|
|
MB = $113.87
|
Most Recent Note - 2/13/2017 5:47:38 PM
Y - Perched near record highs, stubbornly holding its ground with volume totals cooling. Gapped up on 2/08/17 and rallied above its pivot point with a gain backed by very near the +40% above average volume needed to trigger a proper technical buy signal.
>>> FEATURED STOCK ARTICLE : Rose From Support at 50-Day Moving Average Line - 1/24/2017 |
View all notes |
Set NEW NOTE alert |
Company Profile |
SEC
News |
Chart |
Request a new note
C
A
S
I |
SBCF
-
NASDAQ
Seacoast Banking Corp Fl
BANKING - Regional - Mid-Atlantic Banks
|
$24.20
|
+0.23
0.96% |
$24.22
|
2,986,392
1,298.43% of 50 DAV
50 DAV is 230,000
|
$25.13
-3.70%
|
2/13/2017
|
$24.84
|
PP = $23.10
|
|
MB = $24.26
|
 Most Recent Note - 2/15/2017 12:44:26 PM
Y - Consolidating since its 2/13/17 gap up was highlighted in yellow with pivot point cited based on its 1/04/17 high plus 10 cents. Its solid volume-driven gain clinched a technical buy signal. Prior highs in the $23 area define initial support to watch. See the latest FSU analysis for more details and an annotated graph.
>>> FEATURED STOCK ARTICLE : Gap Up Gain and Strong Finish Triggered Technical Buy Signal - 2/13/2017 |
View all notes |
Set NEW NOTE alert |
Company Profile |
SEC
News |
Chart |
Request a new note
C
A
S
I |
CSFL
-
NASDAQ
Centerstate Banks Inc
Banks-Southeast
|
$25.42
|
+0.17
0.67% |
$25.45
|
186,850
62.08% of 50 DAV
50 DAV is 301,000
|
$26.30
-3.35%
|
10/10/2016
|
$18.20
|
PP = $18.37
|
|
MB = $19.29
|
Most Recent Note - 2/13/2017 5:36:48 PM
G - Recently finding support after sputtering near its 50 DMA line ($24.83). Recent low ($23.80 on 2/08/17) defines important near-term support where further deterioration would trigger a technical sell signal. Completed a new Public Offering of shares on 1/10/17.
>>> FEATURED STOCK ARTICLE : Found Support Near 50-Day Average Following Offering - 2/6/2017 |
View all notes |
Set NEW NOTE alert |
Company Profile |
SEC
News |
Chart |
Request a new note
C
A
S
I |
IESC
-
NASDAQ
Integrated Electric Svcs
Bldg-Maintenance and Svc
|
$20.40
|
-0.10
-0.49% |
$20.70
|
63,776
96.63% of 50 DAV
50 DAV is 66,000
|
$23.00
-11.30%
|
11/23/2016
|
$19.35
|
PP = $18.26
|
|
MB = $19.17
|
Most Recent Note - 2/13/2017 5:51:18 PM
G - Consolidating above its 50 DMA line ($19.78) with a volume-driven loss today. Prior low ($18.05 on 1/18/17) defines important support near prior highs. Recently reported Dec '16 quarterly earnings -33% on +27% sales revenues, below the +25% minimum earnings guideline (C criteria), raising fundamental concerns.
>>> FEATURED STOCK ARTICLE : Violated 50-Day Moving Average Line and Now Testing Prior Highs - 1/19/2017 |
View all notes |
Set NEW NOTE alert |
Company Profile |
SEC
News |
Chart |
Request a new note
C
A
S
I |
NSP
-
NYSE
Insperity Inc
Comml Svcs-Outsourcing
|
$84.55
|
-0.25
-0.29% |
$85.50
|
323,508
234.43% of 50 DAV
50 DAV is 138,000
|
$86.35
-2.08%
|
2/14/2017
|
$84.30
|
PP = $82.28
|
|
MB = $86.39
|
Most Recent Note - 2/14/2017 6:06:56 PM
Y - Finished near the middle of its range today after highlighted in yellow with pivot point cited based on its 7/26/16 high plus 10 cents in the earlier mid-day report (read here) noted - "Spiked to new all-time highs today after a considerable volume-driven gain on the prior session triggering a technical buy signal. Reported earnings +76% on +12% sales revenues for the Dec '16 quarter, and prior quarters showed strong earnings increases above the +25% minimum guideline (C criteria). Annual earnings (A criteria) history has improved after a downturn in FY '13." See the latest FSU analysis for more details and a new annotated graph.
>>> FEATURED STOCK ARTICLE : Big Volume-Driven Gains Indicative of Institutional Demand - 2/14/2017 |
View all notes |
Set NEW NOTE alert |
Company Profile |
SEC
News |
Chart |
Request a new note
C
A
S
I |
Symbol/Exchange
Company Name
Industry Group |
PRICE |
CHANGE
(%Change) |
Day High |
Volume
(% DAV)
(% 50 day avg vol) |
52 Wk Hi
% From Hi |
Featured
Date |
Price
Featured |
Pivot Featured |
|
Max Buy |
BERY
-
NYSE
Berry Plastics Group Inc
CONSUMER NON-DURABLES - Packaging and Containers
|
$49.62
|
+0.24
0.49% |
$49.83
|
1,063,720
86.22% of 50 DAV
50 DAV is 1,233,700
|
$52.97
-6.32%
|
11/30/2016
|
$50.26
|
PP = $46.47
|
|
MB = $48.79
|
Most Recent Note - 2/13/2017 5:43:42 PM
G - Its Relative Strength Rating has slumped to 77, below the 80+ minimum for buy candidates under the fact-based investment system. Sputtering near recent lows in the $48.50 area defining near-term support. Damaging losses and violations would trigger a more worrisome technical sell signal. Reported earnings +43% on -7% sales revenues for the Dec '16 quarter. See the latest FSU analysis for more details and an annotated graph.
>>> FEATURED STOCK ARTICLE : Recent 50-Day Violation Raised Concerns - 2/7/2017 |
View all notes |
Set NEW NOTE alert |
Company Profile |
SEC
News |
Chart |
Request a new note
C
A
S
I |
EVR
-
NYSE
Evercore Partners Inc
FINANCIAL SERVICES - Investment Banking
|
$79.05
|
+0.30
0.38% |
$79.65
|
267,988
63.35% of 50 DAV
50 DAV is 423,000
|
$81.75
-3.30%
|
1/5/2017
|
$71.40
|
PP = $72.07
|
|
MB = $75.67
|
Most Recent Note - 2/13/2017 5:48:40 PM
G - Consolidating after getting very extended from its prior base. Recently reported Dec '16 quarterly earnings +17% on +9% sales revenues, below the +25% minimum earnings guideline (C criteria), raising fundamental concerns.
>>> FEATURED STOCK ARTICLE : Perched Near All-Time High Building New Flat Base - 1/5/2017 |
View all notes |
Set NEW NOTE alert |
Company Profile |
SEC
News |
Chart |
Request a new note
C
A
S
I |
NTES
-
NASDAQ
Netease Inc Adr
INTERNET - Internet Information Providers
|
$261.85
|
+5.73
2.24% |
$263.05
|
1,135,637
120.81% of 50 DAV
50 DAV is 940,000
|
$272.58
-3.94%
|
2/10/2017
|
$259.30
|
PP = $272.68
|
|
MB = $286.31
|
Most Recent Note - 2/10/2017 5:07:23 PM
Y - It was highlighted in yellow with new pivot point cited based on its 10/14/16 high plus 10 cents in the earlier mid-day report. Subsequent volume driven gains for new highs may trigger a technical buy signal. Due to report Dec '16 earnings on 2/15/17 and volume and volatility often increase near earnings news. Gradually rebounding after dropped from the Featured Stocks list on 12/12/16, Fundamentals remain strong but it was last noted - "Through the Sep '16 quarter it showed sales revenues and earnings increases above the +25% minimum guideline (C criteria), but deceleration in sequential quarterly comparisons is cause for concern." See the latest FSU analysis for more details and a new annotated graph.
>>> FEATURED STOCK ARTICLE : Rebounding With Earnings News Due Soon - 2/10/2017 |
View all notes |
Set NEW NOTE alert |
Company Profile |
SEC
News |
Chart |
Request a new note
C
A
S
I |
HTHT
-
NASDAQ
China Lodging Group Ads
LEISURE - Lodging
|
$55.81
|
+2.00
3.72% |
$56.02
|
136,024
90.08% of 50 DAV
50 DAV is 151,000
|
$59.20
-5.73%
|
9/29/2016
|
$46.12
|
PP = $47.82
|
|
MB = $50.21
|
Most Recent Note - 2/9/2017 6:42:45 PM
G - Consolidating above prior highs in the $54 area defining near-term support above its 50 DMA line. Repeatedly noted with caution in prior reports - "Reported earnings +10% on +6% sales revenues for the Sep '16 quarter, below the +25% minimum earnings guideline (C criteria), raising concerns." See the latest FSU analysis for more details and a new annotated graph.
>>> FEATURED STOCK ARTICLE : Mostly Bullish Action Continues Since Latest Earnings Report - 2/9/2017 |
View all notes |
Set NEW NOTE alert |
Company Profile |
SEC
News |
Chart |
Request a new note
C
A
S
I |
LMAT
-
NASDAQ
Lemaitre Vascular Inc
Medical-Products
|
$23.53
|
-0.15
-0.63% |
$23.78
|
47,779
43.83% of 50 DAV
50 DAV is 109,000
|
$27.04
-12.97%
|
12/22/2016
|
$24.99
|
PP = $25.09
|
|
MB = $26.34
|
Most Recent Note - 2/13/2017 5:40:24 PM
G - Challenged its 50 DMA line with below average volume behind today's 5th consecutive gain. Its Relative Strength Rating has improved to 87, above the 80+ minimum guideline for buy candidates. Its 50 DMA line ($23.78) may act as resistance, and a rebound above it would help its outlook to improve.
>>> FEATURED STOCK ARTICLE : Concerns Increase While Lingering Below 50-Day Moving Average - 1/27/2017 |
View all notes |
Set NEW NOTE alert |
Company Profile |
SEC
News |
Chart |
Request a new note
C
A
S
I |
Symbol/Exchange
Company Name
Industry Group |
PRICE |
CHANGE
(%Change) |
Day High |
Volume
(% DAV)
(% 50 day avg vol) |
52 Wk Hi
% From Hi |
Featured
Date |
Price
Featured |
Pivot Featured |
|
Max Buy |
BEAT
-
NASDAQ
BioTelemetry Inc
Medical-Services
|
$25.10
|
+0.45
1.83% |
$25.94
|
790,588
281.35% of 50 DAV
50 DAV is 281,000
|
$25.50
-1.57%
|
2/14/2017
|
$25.10
|
PP = $24.55
|
|
MB = $25.78
|
Most Recent Note - 2/15/2017 12:10:48 PM
Y - Gapped up today hitting another new high. Yesterday in the mid-day report it was highlighted in yellow with new pivot point cited based on its 2/06/17 high plus 10 cents after a saucer-with-handle base above its prior base. The volume-driven gain above its pivot point was backed by +121% above average volume triggering a new (or add-on) technical buy signal. Prior highs in the $24 area and its 50 DMA line ($22.49) define important near-term support.
>>> FEATURED STOCK ARTICLE : Volume Totals Cooling While Consolidating Above Prior Highs - 1/10/2017 |
View all notes |
Set NEW NOTE alert |
Company Profile |
SEC
News |
Chart |
Request a new note
C
A
S
I |
PATK
-
NASDAQ
Patrick Industries Inc
WHOLESALE - Building Materials Wholesale
|
$84.25
|
+1.00
1.20% |
$85.35
|
116,241
99.35% of 50 DAV
50 DAV is 117,000
|
$86.10
-2.15%
|
11/29/2016
|
$72.45
|
PP = $69.63
|
|
MB = $73.11
|
Most Recent Note - 2/9/2017 6:54:00 PM
G - Gapped up today and rallied for new all-time highs, getting more extended from its prior base. Its 50 DMA line and recent lows in the $76 area define support to watch.
>>> FEATURED STOCK ARTICLE : Perched Near All-Time High Extended From Prior Base - 1/31/2017 |
View all notes |
Set NEW NOTE alert |
Company Profile |
SEC
News |
Chart |
Request a new note
C
A
S
I |
ESNT
-
NYSE
Essent Group Ltd
Finance-MrtgandRel Svc
|
$36.39
|
-0.17
-0.46% |
$36.59
|
874,998
132.17% of 50 DAV
50 DAV is 662,000
|
$38.10
-4.49%
|
1/25/2017
|
$34.09
|
PP = $34.04
|
|
MB = $35.74
|
Most Recent Note - 2/10/2017 12:16:55 PM
G - Reported earnings +42% on +30% sales revenues for the Dec '16 quarter, continuing its strong earnings track record. Hit a new high today, and it is very extended from any sound base. Its 50 DMA line and prior highs define important near-term support in the $33-34 area.
>>> FEATURED STOCK ARTICLE : Twice Average Volume Behind Big Breakout Gain - 1/25/2017 |
View all notes |
Set NEW NOTE alert |
Company Profile |
SEC
News |
Chart |
Request a new note
C
A
S
I |
ANET
-
NYSE
Arista Networks Inc
TELECOMMUNICATIONS - Communication Equipment
|
$100.67
|
-0.05
-0.05% |
$101.32
|
715,620
100.65% of 50 DAV
50 DAV is 711,000
|
$103.00
-2.26%
|
12/30/2016
|
$96.77
|
PP = $99.00
|
|
MB = $103.95
|
Most Recent Note - 2/13/2017 5:33:21 PM
G - Making gradual progress above its 50 DMA line ($95.88) rebounding toward prior highs following the damaging gap down noted on 1/17/17. It has not formed a sound base.
>>> FEATURED STOCK ARTICLE : Technical Damages Raised Concern and Triggered Technical Sell Signal - 1/18/2017 |
View all notes |
Set NEW NOTE alert |
Company Profile |
SEC
News |
Chart |
Request a new note
C
A
S
I |
VBTX
-
NASDAQ
Veritex Holdings Inc
BANKING - Regional - Southwest Banks
|
$28.31
|
-0.04
-0.14% |
$28.47
|
40,920
40.51% of 50 DAV
50 DAV is 101,000
|
$29.33
-3.48%
|
1/23/2017
|
$27.30
|
PP = $27.87
|
|
MB = $29.26
|
Most Recent Note - 2/14/2017 6:08:36 PM
Y - Posted a solid gain today with above average volume and finished near the session high. Prior highs in the $27 area define initial support above its 50 DMA line ($26.05).
>>> FEATURED STOCK ARTICLE : Challenged Highs But Ended in Bottom Third of Intra-day Range - 1/23/2017 |
View all notes |
Set NEW NOTE alert |
Company Profile |
SEC
News |
Chart |
Request a new note
C
A
S
I |
Symbol/Exchange
Company Name
Industry Group |
PRICE |
CHANGE
(%Change) |
Day High |
Volume
(% DAV)
(% 50 day avg vol) |
52 Wk Hi
% From Hi |
Featured
Date |
Price
Featured |
Pivot Featured |
|
Max Buy |
SFBS
-
NASDAQ
Servisfirst Bancshares
BANKING - Regional - Southeast Banks
|
$42.09
|
+0.26
0.62% |
$42.25
|
159,812
66.87% of 50 DAV
50 DAV is 239,000
|
$42.34
-0.59%
|
7/19/2016
|
$26.64
|
PP = $26.41
|
|
MB = $27.73
|
Most Recent Note - 2/13/2017 1:00:04 PM
G - Hitting another new all-time high today. Recently reported earnings +8% on +20% sales revenues for the Dec '16 quarter, below the +25% minimum guideline (C criteria), raising fundamental concerns. Its 50 DMA line ($37.52) defines important near-term support above recent lows in the $36 area. Subsequent violations would trigger technical sell signals.
>>> FEATURED STOCK ARTICLE : Stubbornly Holding Ground Near Highs - 1/12/2017 |
View all notes |
Set NEW NOTE alert |
Company Profile |
SEC
News |
Chart |
Request a new note
C
A
S
I |
LITE
-
NASDAQ
Lumentum Holdings Inc
TELECOMMUNICATIONS - Cables / Satalite Equipment
|
$49.45
|
-1.05
-2.08% |
$50.75
|
1,592,420
133.93% of 50 DAV
50 DAV is 1,189,000
|
$51.25
-3.51%
|
2/8/2017
|
$44.60
|
PP = $44.80
|
|
MB = $47.04
|
Most Recent Note - 2/13/2017 1:31:04 PM
G - Getting extended from its prior base with volume running at an above average pace behind today's 5th consecutive gain. Prior highs in the $44-45 area define initial support to watch on pullbacks. See the latest FSU analysis for more details and an annotated graph.
>>> FEATURED STOCK ARTICLE : Gap Up Gain and Strong Finish Triggered Technical Buy Signal - 2/8/2017 |
View all notes |
Set NEW NOTE alert |
Company Profile |
SEC
News |
Chart |
Request a new note
C
A
S
I |
LCII
-
NYSE
L C I Industries
MATERIALS and CONSTRUCTION - General Building Materials
|
$108.70
|
+0.25
0.23% |
$108.80
|
105,732
61.12% of 50 DAV
50 DAV is 173,000
|
$117.15
-7.21%
|
11/29/2016
|
$106.29
|
PP = $101.00
|
|
MB = $106.05
|
Most Recent Note - 2/14/2017 12:28:22 PM
G - Rebounded from the session's early lows after dipping further below its 50 DMA line and also undercutting the prior low ($105.05 on 1/20/17) raising concerns. Further deterioration may trigger a more worrisome technical sell signal. A rebound above the 50 DMA line ($109.67) is needed for its outlook to improve. Fundamentals through Dec '16 remain strong.
>>> FEATURED STOCK ARTICLE : Distributional Action While Retreating From Highs - 1/30/2017 |
View all notes |
Set NEW NOTE alert |
Company Profile |
SEC
News |
Chart |
Request a new note
C
A
S
I |
|
|
|
THESE ARE NOT BUY RECOMMENDATIONS!
Comments contained in the body of this report are technical
opinions only. The material herein has been obtained
from sources believed to be reliable and accurate, however,
its accuracy and completeness cannot be guaranteed.
This site is not an investment advisor, hence it does
not endorse or recommend any securities or other investments.
Any recommendation contained in this report may not
be suitable for all investors and it is not to be deemed
an offer or solicitation on our part with respect to
the purchase or sale of any securities. All trademarks,
service marks and trade names appearing in this report
are the property of their respective owners, and are
likewise used for identification purposes only.
This report is a service available
only to active Paid Premium Members.
You may opt-out of receiving report notifications
at any time. Questions or comments may be submitted
by writing to Premium Membership Services 665 S.E. 10 Street, Suite 201 Deerfield Beach, FL 33441-5634 or by calling 1-800-965-8307
or 954-785-1121.
|
|
|