You are not logged in.
This means you
CAN ONLY VIEW reports that were published prior to Thursday, March 20, 2025.
You
MUST UPGRADE YOUR MEMBERSHIP if you want to see any current reports.
AFTER MARKET UPDATE - WEDNESDAY, DECEMBER 13TH, 2017
Previous After Market Report Next After Market Report >>>
|
|
|
|
DOW |
+80.63 |
24,585.43 |
+0.33% |
|
Volume |
875,312,220 |
+2% |
|
Volume |
1,893,312,363 |
+2% |
|
NASDAQ |
+13.48 |
6,875.80 |
+0.20% |
|
Advancers |
1,658 |
56% |
|
Advancers |
1,442 |
60% |
|
S&P 500 |
-1.26 |
2,662.85 |
-0.05% |
|
Decliners |
1,285 |
44% |
|
Decliners |
959 |
40% |
|
Russell 2000 |
+8.33 |
1,524.45 |
+0.55% |
|
52 Wk Highs |
139 |
|
|
52 Wk Highs |
101 |
|
|
S&P 600 |
+4.27 |
927.62 |
+0.46% |
|
52 Wk Lows |
31 |
|
|
52 Wk Lows |
48 |
|
|
 |
Dow Jones Industrial Average Hits Another New Record
Kenneth J. Gruneisen - Passed the CAN SLIM® Master's Exam
The major averages were mixed Wednesday. The Dow rallied 80 points to 24585. The S&P 500 slipped 1 point to 2662. The Nasdaq Composite advanced 13 points to 6875. Volume totals reported were higher than the prior session totals on the NYSE and on the Nasdaq exchange. Advancers led decliners by a 4-3 margin on the NYSE and by a 7-5 margin on the Nasdaq exchange. There were 47 high-ranked companies from the Leaders List that made new 52-week highs and were listed on the BreakOuts Page, versus the total of 36 on the prior session. New 52-week highs outnumbered new 52-week lows on the NYSE and on the Nasdaq exchange. The Featured Stocks Page provides the latest analysis on noteworthy high-ranked leaders. Charts used courtesy of www.stockcharts.com
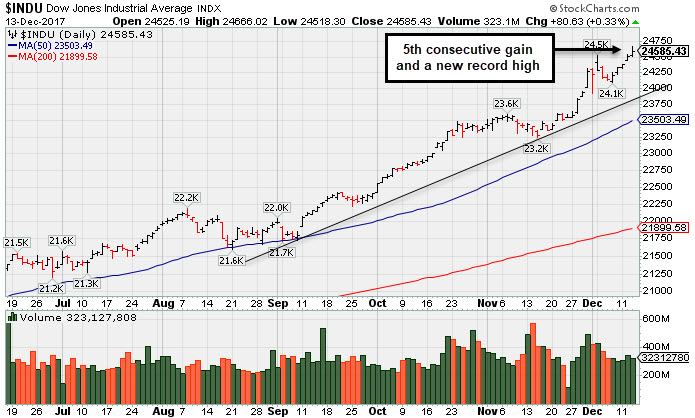 PICTURED: The Dow Jones Industrial Average posted a 5th consecutive gain and hit a new record high, finishing the session up +24.4% year-to-date. A multi-month upward trendline defines near term support above its 50-day moving average (DMA) line.
The major averages (M criteria) are in a confirmed uptrend. Investors should only consider stocks meeting all key criteria of the fact-based investment system as they trigger technical buy signals.
Stocks were mostly higher while bond yields and the dollar fell following the Federal Reserve’s final policy meeting of 2017. The central bank opted to raise its benchmark interest rate for the third time this year, while also suggesting an expectation of three more rate hikes in 2018. Investors also got impactful news on the tax reform front, with multiple sources reporting House and Senate Republicans have agreed on a reconciled version of the legislation, setting the stage for vote early next week. On the data front, a gauge of inflation revealed core consumer prices rose 1.7% year-over-year in November, below expectations of a 1.8% increase.
Seven of 11 sectors in the S&P 500 closed higher with Consumer Staples and Health Care shares outperforming. Industrials also beat the tape with Caterpillar (CAT +3.59%) rising. Financials lagged following the Fed meeting, with the sector dropping more than 1.2%.
Following the busy day of macro headlines, the U.S. Dollar Index retreated 0.7% while gold jumped 1.3% to 1254.50/ounce. Treasuries strengthened along the curve, with the yield on the benchmark 10-year note dipping five basis points to 2.34%, and the rate-sensitive two-year note yield falling four basis points to 1.78%. |
 Kenneth J. Gruneisen started out as a licensed stockbroker in August 1987, a couple of months prior to the historic stock market crash that took the Dow Jones Industrial Average down -22.6% in a single day. He has published daily fact-based fundamental and technical analysis on high-ranked stocks online for two decades. Through FACTBASEDINVESTING.COM, Kenneth provides educational articles, news, market commentary, and other information regarding proven investment systems that work in good times and bad.
Comments contained in the body of this report are technical opinions only and are not necessarily those of Gruneisen Growth Corp. The material herein has been obtained from sources believed to be reliable and accurate, however, its accuracy and completeness cannot be guaranteed. Our firm, employees, and customers may effect transactions, including transactions contrary to any recommendation herein, or have positions in the securities mentioned herein or options with respect thereto. Any recommendation contained in this report may not be suitable for all investors and it is not to be deemed an offer or solicitation on our part with respect to the purchase or sale of any securities. |
|
 |
Gold & Silver Index Outpaced Retail and Tech Groups
Kenneth J. Gruneisen - Passed the CAN SLIM® Master's Exam
The Broker/Dealer Index ($XBD -1.23%) and Bank Index ($BKX -1.36%) both fell on Wednesday, yet the Retail Index ($RLX +0.41%) finished higher. The tech sector had a positive bias as the Biotechnology Index ($BTK +1.31%) and Networking Index ($NWX +0.67%) posted gains but the Semiconductor Index ($SOX -0.01%) finished flat. The Oil Services Index ($OSX -1.57%) fell while the Integrated Oil Index ($XOI +0.12%) was little changed. The Gold & Silver Index ($XAU +3.89%) was a standout gainer. Charts courtesy wwwstockcharts.com
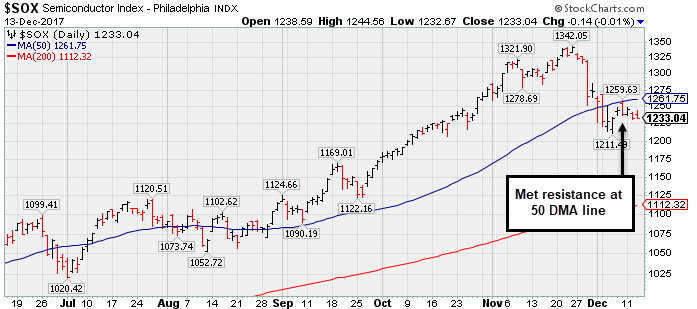 PICTURED: The Semiconductor Index ($SOX -0.01%) recently met resistance at its 50-day moving average (DMA) line when trying to rebound.
| Oil Services |
$OSX |
134.55 |
-2.15 |
-1.57% |
-26.79% |
| Integrated Oil |
$XOI |
1,278.90 |
+1.53 |
+0.12% |
+0.86% |
| Semiconductor |
$SOX |
1,233.04 |
-0.14 |
-0.01% |
+36.03% |
| Networking |
$NWX |
493.77 |
+3.26 |
+0.67% |
+10.69% |
| Broker/Dealer |
$XBD |
263.21 |
-3.29 |
-1.23% |
+28.22% |
| Retail |
$RLX |
1,699.10 |
+6.98 |
+0.41% |
+26.52% |
| Gold & Silver |
$XAU |
79.89 |
+2.99 |
+3.89% |
+1.31% |
| Bank |
$BKX |
105.88 |
-1.45 |
-1.35% |
+15.35% |
| Biotech |
$BTK |
4,201.07 |
+54.16 |
+1.31% |
+36.62% |
|
|
|
 |
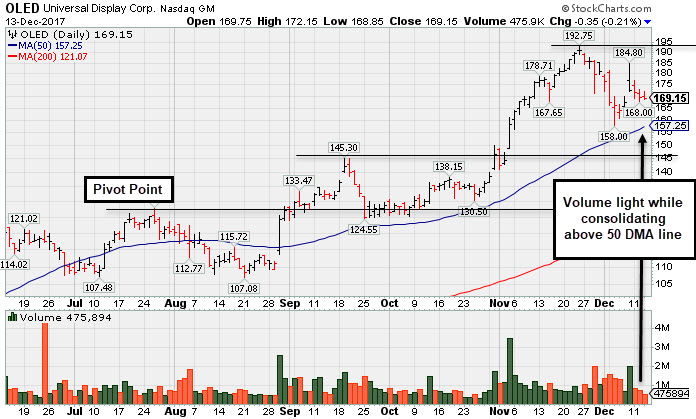
Consolidating After +50% Rally Since First Featured 8/31/17
Kenneth J. Gruneisen - Passed the CAN SLIM® Master's Exam
Universal Display Corp (OLED -$0.35 or -0.21% to $169.15) gapped up on 12/08/17, rallying on news of a new supply agreement. It has not formed a sound base pattern. Its 50-day moving average (DMA) line ($157.25) defines important near-term support above the prior high in the $145 area.
Recently it reported Sep '17 quarterly earnings of 28 cents per share versus a year-ago loss of 3 cents per share on sales revenues +104%.It reported +115% earnings on +59% sales revenues for the Jun '17 quarter, then marking its 3rd consecutive strong quarter above the +25% minimum guideline (C criteria), helping it better match with the fact-based investment system's fundamental guidelines. Its annual earnings (A criteria) history has been strong.
The high-ranked Electronic Products firm has earned a current Timeliness rating of A and a Sponsorship rating of B. The number of top-rated funds owning its shares rose from 355 in Sep '16 to 415 in Sep '17. Its current Up/Down Volume Ratio of 1.8 is an unbiased indication its shares have been under accumulation over the past 50 days (I criteria). Its small supply of only 40.9 million shares (S criteria) in the public float can contribute to greater volatility in the event of institutional buying or selling.
It encountered distributional pressure while retreating from its all-time high hit since last shown in this FSU section on 11/17/17 with an annotated graph under the headline, "Electronic Products Firm Perched at Record High". OLED has traded up as much as +50.3% since first highlighted in yellow at $128.22 in the 8/31/17 mid-day report (read here) with a pivot point cited based on its 7/26/17 high while then rallying from a 12-week "double bottom" base pattern. |
|
|
Color Codes Explained :
Y - Better candidates highlighted by our
staff of experts.
G - Previously featured
in past reports as yellow but may no longer be buyable under the
guidelines.
***Last / Change / Volume data in this table is the closing quote data***
Symbol/Exchange
Company Name
Industry Group |
PRICE |
CHANGE
(%Change) |
Day High |
Volume
(% DAV)
(% 50 day avg vol) |
52 Wk Hi
% From Hi |
Featured
Date |
Price
Featured |
Pivot Featured |
|
Max Buy |
THO
-
NYSE
Thor Industries Inc
AUTOMOTIVE - Recreational Vehicles
|
$151.08
|
+1.68
1.12% |
$152.78
|
457,698
68.21% of 50 DAV
50 DAV is 671,000
|
$156.86
-3.68%
|
8/14/2017
|
$106.67
|
PP = $110.01
|
|
MB = $115.51
|
 Most Recent Note - 12/13/2017 5:42:48 PM
G - Still hovering near its all-time high, very extended from any sound base. Its 50 DMA line ($136.60) and prior highs in the $138 area define near-term support to watch. Reported earnings +63% on +31% sales revenues for the Oct '17 quarter, continuing its strong earnings track record.
>>> FEATURED STOCK ARTICLE : Very Extended From Prior Base and Hovering Near Record High - 12/7/2017 |
View all notes |
Set NEW NOTE alert |
Company Profile |
SEC
News |
Chart |
Request a new note
C
A
S
I |
PFBC
-
NASDAQ
Preferred Bank Los Angls
BANKING - Regional - Pacific Banks
|
$61.68
|
-0.30
-0.48% |
$62.50
|
76,918
101.21% of 50 DAV
50 DAV is 76,000
|
$66.58
-7.36%
|
10/10/2017
|
$59.38
|
PP = $59.08
|
|
MB = $62.03
|
Most Recent Note - 12/12/2017 2:18:18 PM
G - Recently met resistance in the $66 area yet found prompt support at its 50 DMA line ($60.74) during its consolidation. Fundamentals remain strong.
>>> FEATURED STOCK ARTICLE : Challenged High After Finding Support at 50 Day Moving Average - 12/5/2017 |
View all notes |
Set NEW NOTE alert |
Company Profile |
SEC
News |
Chart |
Request a new note
C
A
S
I |
AVGO
-
NASDAQ
Avago Technologies Ltd
ELECTRONICS - Semiconductor - Broad Line
|
$262.03
|
+3.33
1.29% |
$263.29
|
2,542,056
77.69% of 50 DAV
50 DAV is 3,272,100
|
$285.68
-8.28%
|
10/30/2017
|
$261.19
|
PP = $259.46
|
|
MB = $272.43
|
Most Recent Note - 12/13/2017 5:41:22 PM
G - Recently finding support near prior highs in the $259 area and its 50 DMA line ($260.41). More damaging losses would raise greater concerns. Fundamentals remain strong.
>>> FEATURED STOCK ARTICLE : Testing Support at Prior Highs and 50-Day Average - 12/8/2017 |
View all notes |
Set NEW NOTE alert |
Company Profile |
SEC
News |
Chart |
Request a new note
C
A
S
I |
YY
-
NASDAQ
YY Inc Ads
INTERNET - Internet Service Providers
|
$111.20
|
+4.89
4.60% |
$112.00
|
1,351,347
88.21% of 50 DAV
50 DAV is 1,532,000
|
$123.48
-9.94%
|
9/25/2017
|
$80.26
|
PP = $83.10
|
|
MB = $87.26
|
Most Recent Note - 12/13/2017 5:44:21 PM
G - Consolidating above its prior high ($97.59 on 10/16/17) and above its 50 DMA line ($98.03), still extended from any sound base. Fundamentals remain strong. See the latest FSU analysis for more details and an annotated graph.
>>> FEATURED STOCK ARTICLE : Fundamentals Remain Strong; Extended From Any Sound Base - 12/11/2017 |
View all notes |
Set NEW NOTE alert |
Company Profile |
SEC
News |
Chart |
Request a new note
C
A
S
I |
HTHT
-
NASDAQ
China Lodging Group Ads
LEISURE - Lodging
|
$118.78
|
-0.40
-0.34% |
$121.99
|
543,773
96.41% of 50 DAV
50 DAV is 564,000
|
$142.80
-16.82%
|
9/29/2016
|
$46.12
|
PP = $47.82
|
|
MB = $50.21
|
Most Recent Note - 12/11/2017 1:09:52 PM
G - Rebounded near its 50 DMA line ($124.84) which may act as resistance. Gains above the 50 DMA line are still needed for its outlook to improve. Fundamentals remain strong.
>>> FEATURED STOCK ARTICLE : Weak Technical Action Raises Concerns Despite Strong Fundamentals - 11/29/2017 |
View all notes |
Set NEW NOTE alert |
Company Profile |
SEC
News |
Chart |
Request a new note
C
A
S
I |
Symbol/Exchange
Company Name
Industry Group |
PRICE |
CHANGE
(%Change) |
Day High |
Volume
(% DAV)
(% 50 day avg vol) |
52 Wk Hi
% From Hi |
Featured
Date |
Price
Featured |
Pivot Featured |
|
Max Buy |
PATK
-
NASDAQ
Patrick Industries Inc
Bldg-Mobile/Mfg and RV
|
$65.75
|
+1.15
1.78% |
$67.10
|
139,190
108.74% of 50 DAV
50 DAV is 128,000
|
$68.63
-4.20%
|
10/26/2017
|
$90.90
|
PP = $87.90
|
|
MB = $92.30
|
Most Recent Note - 12/12/2017 1:05:31 PM
G - Hovering near its all-time high, extended from its prior base. Its 50 DMA line ($60.28) defines important near-term support to watch. Fundamentals remain strong. Shares split 3/2 effective 12/11/17, so do not be confused by the impact on the share prices.
>>> FEATURED STOCK ARTICLE : Best Ever Close After Pullback Found Support Near Prior High - 11/21/2017 |
View all notes |
Set NEW NOTE alert |
Company Profile |
SEC
News |
Chart |
Request a new note
C
A
S
I |
ESNT
-
NYSE
Essent Group Ltd
Finance-MrtgandRel Svc
|
$45.70
|
-0.74
-1.59% |
$46.67
|
558,179
59.70% of 50 DAV
50 DAV is 935,000
|
$47.29
-3.36%
|
10/9/2017
|
$39.75
|
PP = $41.54
|
|
MB = $43.62
|
Most Recent Note - 12/11/2017 7:24:15 PM
G - Touched a new high today while quietly posting a 7th consecutive gain. Its 50 DMA line ($43.10) along with the recent low ($43.07 on 12/01/17) define important near-term support to watch on pullbacks. Fundamentals remain strong.
>>> FEATURED STOCK ARTICLE : Recent Consolidation Was Not a Sufficient Length New Base - 11/20/2017 |
View all notes |
Set NEW NOTE alert |
Company Profile |
SEC
News |
Chart |
Request a new note
C
A
S
I |
FIVE
-
NASDAQ
Five Below Inc
Retail-DiscountandVariety
|
$67.04
|
+0.93
1.41% |
$67.20
|
926,646
92.76% of 50 DAV
50 DAV is 999,000
|
$67.53
-0.73%
|
10/6/2017
|
$57.13
|
PP = $54.23
|
|
MB = $56.94
|
Most Recent Note - 12/11/2017 7:32:18 PM
G - Encountered distributional pressure today and retreated from its all-time high with a loss on higher volume. Very extended from its prior base, its 50 DMA line ($58.31) and prior highs in the $57-58 area define near-term support to watch. Fundamentals remain strong.
>>> FEATURED STOCK ARTICLE : Getting Extended From Prior Base With Earnings News Due - 11/24/2017 |
View all notes |
Set NEW NOTE alert |
Company Profile |
SEC
News |
Chart |
Request a new note
C
A
S
I |
OLED
-
NASDAQ
Universal Display Corp
Elec-Misc Products
|
$169.15
|
-0.35
-0.21% |
$172.15
|
475,850
51.11% of 50 DAV
50 DAV is 931,000
|
$192.75
-12.24%
|
8/31/2017
|
$128.22
|
PP = $127.78
|
|
MB = $134.17
|
Most Recent Note - 12/13/2017 5:36:39 PM
G - Fundamentals remain strong. Has not formed a sound base pattern. The recent low ($158.00 on 12/05/17) and 50 DMA line ($157.25) define important near-term support to watch. Subsequent losses leading to violations may trigger technical sell signals. See the latest FSU analysis for more details and a new annotated graph.
>>> FEATURED STOCK ARTICLE : Consolidating After +50% Rally Since First Featured 8/31/17 - 12/13/2017 |
View all notes |
Set NEW NOTE alert |
Company Profile |
SEC
News |
Chart |
Request a new note
C
A
S
I |
ANET
-
NYSE
Arista Networks Inc
TELECOMMUNICATIONS - Communication Equipment
|
$225.13
|
+6.88
3.15% |
$226.24
|
746,683
91.17% of 50 DAV
50 DAV is 819,000
|
$245.65
-8.35%
|
10/27/2017
|
$195.65
|
PP = $196.37
|
|
MB = $206.19
|
Most Recent Note - 12/13/2017 5:40:15 PM
G - Consolidating above its 50 DMA line ($210.35). Below that short-term average its prior low ($206.86 on 12/05/17) defines the next important support level. Subsequent violations would trigger technical sell signals.
>>> FEATURED STOCK ARTICLE : Halted Volume-Driven Pullback at 50-Day Moving Average Line - 12/6/2017 |
View all notes |
Set NEW NOTE alert |
Company Profile |
SEC
News |
Chart |
Request a new note
C
A
S
I |
Symbol/Exchange
Company Name
Industry Group |
PRICE |
CHANGE
(%Change) |
Day High |
Volume
(% DAV)
(% 50 day avg vol) |
52 Wk Hi
% From Hi |
Featured
Date |
Price
Featured |
Pivot Featured |
|
Max Buy |
GRUB
-
NYSE
Grubhub Inc
COMPUTER SOFTWARE and SERVICES - Technical and System Software
|
$71.41
|
+1.58
2.26% |
$71.66
|
1,025,250
72.20% of 50 DAV
50 DAV is 1,420,000
|
$71.22
0.27%
|
6/21/2017
|
$47.33
|
PP = $46.94
|
|
MB = $49.29
|
Most Recent Note - 12/13/2017 5:45:27 PM
G - Hit yet another new all-time high with today's gain backed by lighter than average volume, getting very extended from any sound base. Its 50 DMA line ($60.97) and prior highs near $57 define support to watch on pullbacks. The 2 latest quarters were below the +25% minimum earnings guideline (C criteria), raising fundamental concerns with regard to the fact-based investment system.
>>> FEATURED STOCK ARTICLE : Extended From Prior Highs After Gains on Light Volume - 11/22/2017 |
View all notes |
Set NEW NOTE alert |
Company Profile |
SEC
News |
Chart |
Request a new note
C
A
S
I |
IBP
-
NYSE
Installed Building Prod
DIVERSIFIED SERVICES - Business/Management Services
|
$68.90
|
-0.90
-1.29% |
$69.90
|
225,050
125.73% of 50 DAV
50 DAV is 179,000
|
$79.40
-13.22%
|
9/19/2017
|
$59.15
|
PP = $60.10
|
|
MB = $63.11
|
Most Recent Note - 12/12/2017 2:20:39 PM
G - Encountering distributional pressure after getting very extended from any sound base. The prior high ($70.25 on 11/01/17) and its 50 DMA line ($68.21) define important near-term support to watch. Subsequent losses leading to violations may trigger technical sell signals. Fundamentals remain strong.
>>> FEATURED STOCK ARTICLE : Extended From Any Sound Base After Impressive Rebound and Rally - 12/1/2017 |
View all notes |
Set NEW NOTE alert |
Company Profile |
SEC
News |
Chart |
Request a new note
C
A
S
I |
OLLI
-
NASDAQ
Ollie's Bargain Outlet
Retail-DiscountandVariety
|
$48.63
|
+0.63
1.30% |
$49.20
|
478,430
100.09% of 50 DAV
50 DAV is 478,000
|
$51.53
-5.63%
|
11/21/2017
|
$46.78
|
PP = $47.00
|
|
MB = $49.35
|
Most Recent Note - 12/12/2017 6:14:39 PM
Y - Color code is changed to yellow after pulling back below its "max buy" level. Its 50 DMA line ($46.01) defines important near-term support. Fundamentals remain strong.
>>> FEATURED STOCK ARTICLE : Recently Stalled After Reaching a New High - 11/27/2017 |
View all notes |
Set NEW NOTE alert |
Company Profile |
SEC
News |
Chart |
Request a new note
C
A
S
I |
HLI
-
NYSE
Houlihan Lokey Inc Cl A
Finance-Invest Bnk/Bkrs
|
$45.51
|
-0.01
-0.02% |
$46.30
|
319,158
130.27% of 50 DAV
50 DAV is 245,000
|
$45.86
-0.76%
|
9/18/2017
|
$37.04
|
PP = $39.78
|
|
MB = $41.77
|
Most Recent Note - 12/12/2017 6:12:03 PM
G - Wedged to a new all-time high with today's 4th consecutive gain, getting more extended from any sound base. Its 50 DMA line ($42.19) defines near-term support to watch. On 10/26/17 it priced a Secondary Offering. Fundamentals remain strong. See the latest FSU analysis for more details and a new annotated graph.
>>> FEATURED STOCK ARTICLE : Wedging Higher With Recent Gains Lacking Great Volume - 12/12/2017 |
View all notes |
Set NEW NOTE alert |
Company Profile |
SEC
News |
Chart |
Request a new note
C
A
S
I |
|
|
|
THESE ARE NOT BUY RECOMMENDATIONS!
Comments contained in the body of this report are technical
opinions only. The material herein has been obtained
from sources believed to be reliable and accurate, however,
its accuracy and completeness cannot be guaranteed.
This site is not an investment advisor, hence it does
not endorse or recommend any securities or other investments.
Any recommendation contained in this report may not
be suitable for all investors and it is not to be deemed
an offer or solicitation on our part with respect to
the purchase or sale of any securities. All trademarks,
service marks and trade names appearing in this report
are the property of their respective owners, and are
likewise used for identification purposes only.
This report is a service available
only to active Paid Premium Members.
You may opt-out of receiving report notifications
at any time. Questions or comments may be submitted
by writing to Premium Membership Services 665 S.E. 10 Street, Suite 201 Deerfield Beach, FL 33441-5634 or by calling 1-800-965-8307
or 954-785-1121.
|
|
|