You are not logged in.
This means you
CAN ONLY VIEW reports that were published prior to Thursday, March 20, 2025.
You
MUST UPGRADE YOUR MEMBERSHIP if you want to see any current reports.
AFTER MARKET UPDATE - THURSDAY, DECEMBER 14TH, 2017
Previous After Market Report Next After Market Report >>>
|
|
|
|
DOW |
-76.77 |
24,508.66 |
-0.31% |
|
Volume |
813,773,380 |
-7% |
|
Volume |
1,990,951,930 |
+5% |
|
NASDAQ |
-19.27 |
6,856.53 |
-0.28% |
|
Advancers |
1,088 |
37% |
|
Advancers |
801 |
31% |
|
S&P 500 |
-10.84 |
2,652.01 |
-0.41% |
|
Decliners |
1,867 |
63% |
|
Decliners |
1,793 |
69% |
|
Russell 2000 |
-17.50 |
1,506.95 |
-1.15% |
|
52 Wk Highs |
81 |
|
|
52 Wk Highs |
93 |
|
|
S&P 600 |
-11.07 |
916.55 |
-1.19% |
|
52 Wk Lows |
46 |
|
|
52 Wk Lows |
70 |
|
|
 |
Leadership Waned as Indices Quietly Finished Lower
Kenneth J. Gruneisen - Passed the CAN SLIM® Master's Exam
Stocks finished lower Thursday. The Dow was down 77 points to 24508. The S&P 500 lost 11 points to 2652 and the Nasdaq Composite declined 19 points to 6856. Volume totals reported were lighter than the prior session totals on the NYSE and on the Nasdaq exchange. Decliners led advancers by a 9-5 margin on the NYSE and by more than a 2-1 margin on the Nasdaq exchange. There were 24 high-ranked companies from the Leaders List that made new 52-week highs and were listed on the BreakOuts Page, versus the total of 47 on the prior session. New 52-week highs still outnumbered new 52-week lows on the NYSE and on the Nasdaq exchange. The Featured Stocks Page provides the latest analysis on noteworthy high-ranked leaders. Charts used courtesy of www.stockcharts.com
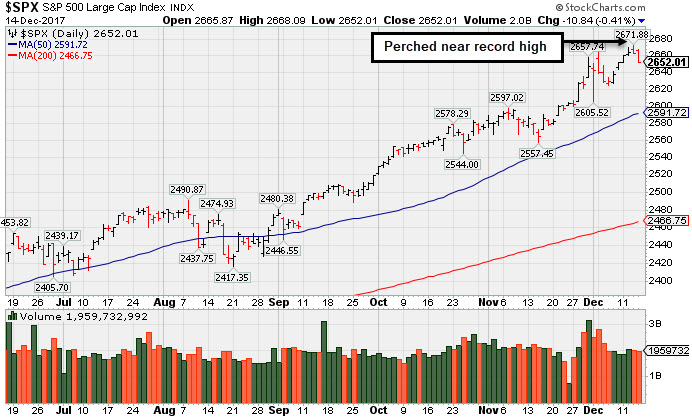 PICTURED: The S&P 500 Index is perched near its record high, finishing the session up +18.5% year-to-date. It is perched well above near term support at its 50-day moving average (DMA) line.
The major averages (M criteria) are in a confirmed uptrend. Investors should only consider stocks meeting all key criteria of the fact-based investment system as they trigger technical buy signals.
U.S. equities erased earlier gains to close in negative territory after Senator Marco Rubio said he opposed the current tax bill unless it expands the proposed child tax credit. On the data front, initial jobless claims unexpectedly fell 11,000 to 225,000 in the most recent week. Retail sales rose 0.8% in November beating a projected 0.3% increase. An additional release showed import prices grew 0.7% in November, in line with projections. Research firm Markit said the pace of manufacturing activity increased more than expected in December, while the pace of services sector expansion eased.
Ten of 11 sectors in the S&P 500 were negative on the session. Materials were down the most as paint makers PPG (PPG -2.09%) and Sherwin-Williams (SHW -1.29%) both fell. Consumer Discretionary was the notable gainer led by media companies. Disney (DIS +2.75%) rose after announcing it agreed to purchase Twenty-First Century Fox’s (FOX +5.81%) TV and film assets for $52.4 billion.
Treasuries were broadly lower with the 10-year note yield up a basis point to 2.35%. In commodities, NYMEX WTI crude advanced 1.0% to $57.15/barrel. COMEX gold added 0.7% to $1253.80/ounce. In the FOREX market, the U.S. Dollar Index was up 0.1% against its peers. |
 Kenneth J. Gruneisen started out as a licensed stockbroker in August 1987, a couple of months prior to the historic stock market crash that took the Dow Jones Industrial Average down -22.6% in a single day. He has published daily fact-based fundamental and technical analysis on high-ranked stocks online for two decades. Through FACTBASEDINVESTING.COM, Kenneth provides educational articles, news, market commentary, and other information regarding proven investment systems that work in good times and bad.
Comments contained in the body of this report are technical opinions only and are not necessarily those of Gruneisen Growth Corp. The material herein has been obtained from sources believed to be reliable and accurate, however, its accuracy and completeness cannot be guaranteed. Our firm, employees, and customers may effect transactions, including transactions contrary to any recommendation herein, or have positions in the securities mentioned herein or options with respect thereto. Any recommendation contained in this report may not be suitable for all investors and it is not to be deemed an offer or solicitation on our part with respect to the purchase or sale of any securities. |
|
 |
Financial, Tech, and Oil Services Indexes Fell
Kenneth J. Gruneisen - Passed the CAN SLIM® Master's Exam
The Broker/Dealer Index ($XBD -1.31%) and Bank Index ($BKX -0.85%) both fell on Thursday, meanwhile the Retail Index ($RLX +0.06%) finished flat. The tech sector had a negative bias as the Biotechnology Index ($BTK -2.19%) and Networking Index ($NWX -0.99%) both fell while the Semiconductor Index ($SOX -0.05%) finished flat. The Oil Services Index ($OSX -1.34%) outpaced the Integrated Oil Index ($XOI -0.27%) and the Gold & Silver Index ($XAU -0.26%) to the downside. Charts courtesy wwwstockcharts.com
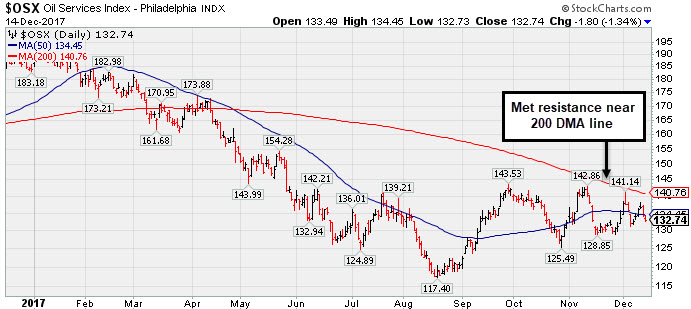 PICTURED: The Oil Services Index ($OSX -1.34%) recently met resistance at its 200-day moving average (DMA) line when trying to rebound.
| Oil Services |
$OSX |
132.74 |
-1.81 |
-1.35% |
-27.78% |
| Integrated Oil |
$XOI |
1,275.45 |
-3.45 |
-0.27% |
+0.59% |
| Semiconductor |
$SOX |
1,232.43 |
-0.61 |
-0.05% |
+35.96% |
| Networking |
$NWX |
488.86 |
-4.91 |
-0.99% |
+9.59% |
| Broker/Dealer |
$XBD |
259.76 |
-3.46 |
-1.31% |
+26.54% |
| Retail |
$RLX |
1,700.09 |
+0.99 |
+0.06% |
+26.59% |
| Gold & Silver |
$XAU |
79.68 |
-0.21 |
-0.26% |
+1.04% |
| Bank |
$BKX |
104.97 |
-0.91 |
-0.86% |
+14.36% |
| Biotech |
$BTK |
4,108.89 |
-92.18 |
-2.19% |
+33.62% |
|
|
|
 |
Pulling Back After Recently Wedging Higher
Kenneth J. Gruneisen - Passed the CAN SLIM® Master's Exam
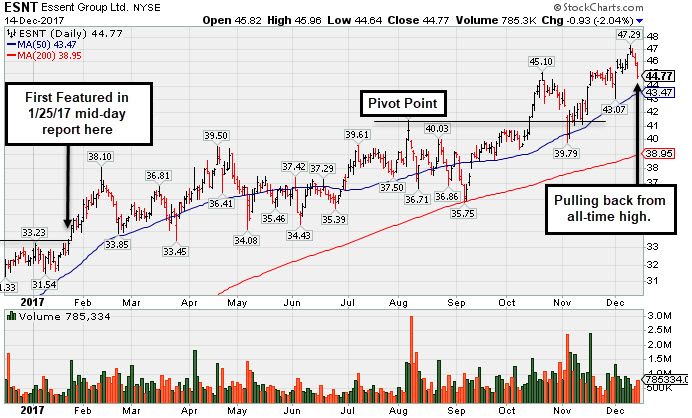
Essent Group Ltd (ESNT -$0.93 or -2.04% to $44.77) is pulling back from its all-time high after recently wedging higher. It found support at its 50-day moving average (DMA) line ($43.47) during the latest consolidation. It did not form a sound new base of sufficient length for a new pivot point to be cited. The short-term moving average and prior high in the $41 area defines important near-term support to watch on pullbacks.
ESNT completed a new Public Offering on 8/08/17. During a subsequent consolidation it found support near its 200 DMA line, then a prompt rebound above the 50 DMA line helped its outlook improve. It rallied above a new pivot point with additional volume-driven gains in mid-October. It was shown in this FSU section on 11/20/17 with an annotated graph under the headline, "Recent Consolidation Was Not a Sufficient Length New Base".
Fundamentals remain strong. It currently has a Timeliness rating of A and a Sponsorship rating of C. The high-ranked Finance-Mrtg and Rel Svc firm's quarterly earnings have been above the +25% minimum guideline (C criteria) and sales revenues increases in comparisons through Sep '17 have been strong. Its annual earnings (A criteria) history has been good since its $17 IPO on 10/31/13.
Essent has traded up as much as +38.7% since first highlighted in yellow with pivot point cited based on its 12/12/16 high plus 10 cents in the 1/25/17 mid-day report (read here). The number of top-rated funds owning its shares rose from 317 in Mar '16 to 513 in Sep '17, a reassuring sign concerning the I criteria. Its current Up/Down Volume ratio of 1.7 is an unbiased indication its shares have been under accumulation over the past 50 days. |
|
|
Color Codes Explained :
Y - Better candidates highlighted by our
staff of experts.
G - Previously featured
in past reports as yellow but may no longer be buyable under the
guidelines.
***Last / Change / Volume data in this table is the closing quote data***
Symbol/Exchange
Company Name
Industry Group |
PRICE |
CHANGE
(%Change) |
Day High |
Volume
(% DAV)
(% 50 day avg vol) |
52 Wk Hi
% From Hi |
Featured
Date |
Price
Featured |
Pivot Featured |
|
Max Buy |
THO
-
NYSE
Thor Industries Inc
AUTOMOTIVE - Recreational Vehicles
|
$148.93
|
-2.15
-1.42% |
$151.66
|
353,490
53.48% of 50 DAV
50 DAV is 661,000
|
$156.86
-5.06%
|
8/14/2017
|
$106.67
|
PP = $110.01
|
|
MB = $115.51
|
Most Recent Note - 12/13/2017 5:42:48 PM
G - Still hovering near its all-time high, very extended from any sound base. Its 50 DMA line ($136.60) and prior highs in the $138 area define near-term support to watch. Reported earnings +63% on +31% sales revenues for the Oct '17 quarter, continuing its strong earnings track record.
>>> FEATURED STOCK ARTICLE : Very Extended From Prior Base and Hovering Near Record High - 12/7/2017 |
View all notes |
Set NEW NOTE alert |
Company Profile |
SEC
News |
Chart |
Request a new note
C
A
S
I |
PFBC
-
NASDAQ
Preferred Bank Los Angls
BANKING - Regional - Pacific Banks
|
$60.27
|
-1.41
-2.29% |
$62.28
|
41,652
54.16% of 50 DAV
50 DAV is 76,900
|
$66.58
-9.48%
|
10/10/2017
|
$59.38
|
PP = $59.08
|
|
MB = $62.03
|
Most Recent Note - 12/12/2017 2:18:18 PM
G - Recently met resistance in the $66 area yet found prompt support at its 50 DMA line ($60.74) during its consolidation. Fundamentals remain strong.
>>> FEATURED STOCK ARTICLE : Challenged High After Finding Support at 50 Day Moving Average - 12/5/2017 |
View all notes |
Set NEW NOTE alert |
Company Profile |
SEC
News |
Chart |
Request a new note
C
A
S
I |
AVGO
-
NASDAQ
Avago Technologies Ltd
ELECTRONICS - Semiconductor - Broad Line
|
$259.34
|
-2.69
-1.03% |
$263.00
|
3,758,638
114.78% of 50 DAV
50 DAV is 3,274,700
|
$285.68
-9.22%
|
10/30/2017
|
$261.19
|
PP = $259.46
|
|
MB = $272.43
|
Most Recent Note - 12/13/2017 5:41:22 PM
G - Recently finding support near prior highs in the $259 area and its 50 DMA line ($260.41). More damaging losses would raise greater concerns. Fundamentals remain strong.
>>> FEATURED STOCK ARTICLE : Testing Support at Prior Highs and 50-Day Average - 12/8/2017 |
View all notes |
Set NEW NOTE alert |
Company Profile |
SEC
News |
Chart |
Request a new note
C
A
S
I |
YY
-
NASDAQ
YY Inc Ads
INTERNET - Internet Service Providers
|
$108.27
|
-2.93
-2.63% |
$112.81
|
874,549
57.46% of 50 DAV
50 DAV is 1,522,000
|
$123.48
-12.32%
|
9/25/2017
|
$80.26
|
PP = $83.10
|
|
MB = $87.26
|
Most Recent Note - 12/13/2017 5:44:21 PM
G - Consolidating above its prior high ($97.59 on 10/16/17) and above its 50 DMA line ($98.03), still extended from any sound base. Fundamentals remain strong. See the latest FSU analysis for more details and an annotated graph.
>>> FEATURED STOCK ARTICLE : Fundamentals Remain Strong; Extended From Any Sound Base - 12/11/2017 |
View all notes |
Set NEW NOTE alert |
Company Profile |
SEC
News |
Chart |
Request a new note
C
A
S
I |
HTHT
-
NASDAQ
China Lodging Group Ads
LEISURE - Lodging
|
$122.11
|
+3.33
2.80% |
$122.14
|
643,716
113.53% of 50 DAV
50 DAV is 567,000
|
$142.80
-14.49%
|
9/29/2016
|
$46.12
|
PP = $47.82
|
|
MB = $50.21
|
Most Recent Note - 12/11/2017 1:09:52 PM
G - Rebounded near its 50 DMA line ($124.84) which may act as resistance. Gains above the 50 DMA line are still needed for its outlook to improve. Fundamentals remain strong.
>>> FEATURED STOCK ARTICLE : Weak Technical Action Raises Concerns Despite Strong Fundamentals - 11/29/2017 |
View all notes |
Set NEW NOTE alert |
Company Profile |
SEC
News |
Chart |
Request a new note
C
A
S
I |
Symbol/Exchange
Company Name
Industry Group |
PRICE |
CHANGE
(%Change) |
Day High |
Volume
(% DAV)
(% 50 day avg vol) |
52 Wk Hi
% From Hi |
Featured
Date |
Price
Featured |
Pivot Featured |
|
Max Buy |
PATK
-
NASDAQ
Patrick Industries Inc
Bldg-Mobile/Mfg and RV
|
$64.85
|
-0.90
-1.37% |
$66.07
|
113,461
89.34% of 50 DAV
50 DAV is 127,000
|
$68.63
-5.51%
|
10/26/2017
|
$90.90
|
PP = $87.90
|
|
MB = $92.30
|
Most Recent Note - 12/12/2017 1:05:31 PM
G - Hovering near its all-time high, extended from its prior base. Its 50 DMA line ($60.28) defines important near-term support to watch. Fundamentals remain strong. Shares split 3/2 effective 12/11/17, so do not be confused by the impact on the share prices.
>>> FEATURED STOCK ARTICLE : Best Ever Close After Pullback Found Support Near Prior High - 11/21/2017 |
View all notes |
Set NEW NOTE alert |
Company Profile |
SEC
News |
Chart |
Request a new note
C
A
S
I |
ESNT
-
NYSE
Essent Group Ltd
Finance-MrtgandRel Svc
|
$44.77
|
-0.93
-2.04% |
$45.96
|
785,334
84.08% of 50 DAV
50 DAV is 934,000
|
$47.29
-5.33%
|
10/9/2017
|
$39.75
|
PP = $41.54
|
|
MB = $43.62
|
 Most Recent Note - 12/14/2017 6:25:35 PM
G - Pulled back from its all-time high after recently wedging higher with gains lacking great volume conviction. Its 50 DMA line ($43.47) defines important near-term support to watch above prior highs in the $41 area. Fundamentals remain strong. See the latest FSU analysis for more details and a new annotated graph.
>>> FEATURED STOCK ARTICLE : Pulling Back After Recently Wedging Higher - 12/14/2017 |
View all notes |
Set NEW NOTE alert |
Company Profile |
SEC
News |
Chart |
Request a new note
C
A
S
I |
FIVE
-
NASDAQ
Five Below Inc
Retail-DiscountandVariety
|
$65.55
|
-1.49
-2.22% |
$67.57
|
1,065,027
105.66% of 50 DAV
50 DAV is 1,008,000
|
$67.53
-2.93%
|
10/6/2017
|
$57.13
|
PP = $54.23
|
|
MB = $56.94
|
Most Recent Note - 12/11/2017 7:32:18 PM
G - Encountered distributional pressure today and retreated from its all-time high with a loss on higher volume. Very extended from its prior base, its 50 DMA line ($58.31) and prior highs in the $57-58 area define near-term support to watch. Fundamentals remain strong.
>>> FEATURED STOCK ARTICLE : Getting Extended From Prior Base With Earnings News Due - 11/24/2017 |
View all notes |
Set NEW NOTE alert |
Company Profile |
SEC
News |
Chart |
Request a new note
C
A
S
I |
OLED
-
NASDAQ
Universal Display Corp
Elec-Misc Products
|
$170.50
|
+1.38
0.82% |
$171.25
|
467,693
50.29% of 50 DAV
50 DAV is 930,000
|
$192.75
-11.54%
|
8/31/2017
|
$128.22
|
PP = $127.78
|
|
MB = $134.17
|
Most Recent Note - 12/13/2017 5:36:39 PM
G - Fundamentals remain strong. Has not formed a sound base pattern. The recent low ($158.00 on 12/05/17) and 50 DMA line ($157.25) define important near-term support to watch. Subsequent losses leading to violations may trigger technical sell signals. See the latest FSU analysis for more details and a new annotated graph.
>>> FEATURED STOCK ARTICLE : Consolidating After +50% Rally Since First Featured 8/31/17 - 12/13/2017 |
View all notes |
Set NEW NOTE alert |
Company Profile |
SEC
News |
Chart |
Request a new note
C
A
S
I |
ANET
-
NYSE
Arista Networks Inc
TELECOMMUNICATIONS - Communication Equipment
|
$226.72
|
+1.59
0.71% |
$229.18
|
782,748
94.53% of 50 DAV
50 DAV is 828,000
|
$245.65
-7.71%
|
10/27/2017
|
$195.65
|
PP = $196.37
|
|
MB = $206.19
|
Most Recent Note - 12/13/2017 5:40:15 PM
G - Consolidating above its 50 DMA line ($210.35). Below that short-term average its prior low ($206.86 on 12/05/17) defines the next important support level. Subsequent violations would trigger technical sell signals.
>>> FEATURED STOCK ARTICLE : Halted Volume-Driven Pullback at 50-Day Moving Average Line - 12/6/2017 |
View all notes |
Set NEW NOTE alert |
Company Profile |
SEC
News |
Chart |
Request a new note
C
A
S
I |
Symbol/Exchange
Company Name
Industry Group |
PRICE |
CHANGE
(%Change) |
Day High |
Volume
(% DAV)
(% 50 day avg vol) |
52 Wk Hi
% From Hi |
Featured
Date |
Price
Featured |
Pivot Featured |
|
Max Buy |
GRUB
-
NYSE
Grubhub Inc
COMPUTER SOFTWARE and SERVICES - Technical and System Software
|
$71.54
|
+0.13
0.18% |
$72.55
|
1,080,878
76.28% of 50 DAV
50 DAV is 1,417,000
|
$71.66
-0.17%
|
6/21/2017
|
$47.33
|
PP = $46.94
|
|
MB = $49.29
|
Most Recent Note - 12/13/2017 5:45:27 PM
G - Hit yet another new all-time high with today's gain backed by lighter than average volume, getting very extended from any sound base. Its 50 DMA line ($60.97) and prior highs near $57 define support to watch on pullbacks. The 2 latest quarters were below the +25% minimum earnings guideline (C criteria), raising fundamental concerns with regard to the fact-based investment system.
>>> FEATURED STOCK ARTICLE : Extended From Prior Highs After Gains on Light Volume - 11/22/2017 |
View all notes |
Set NEW NOTE alert |
Company Profile |
SEC
News |
Chart |
Request a new note
C
A
S
I |
IBP
-
NYSE
Installed Building Prod
DIVERSIFIED SERVICES - Business/Management Services
|
$71.10
|
+2.20
3.19% |
$72.53
|
254,450
141.36% of 50 DAV
50 DAV is 180,000
|
$79.40
-10.45%
|
9/19/2017
|
$59.15
|
PP = $60.10
|
|
MB = $63.11
|
Most Recent Note - 12/14/2017 6:28:12 PM
G - Posted a solid volume-driven gain today, bouncing from support at its 50 DMA line ($68.36). Subsequent losses leading to a violation may trigger a technical sell signal. Fundamentals remain strong.
>>> FEATURED STOCK ARTICLE : Extended From Any Sound Base After Impressive Rebound and Rally - 12/1/2017 |
View all notes |
Set NEW NOTE alert |
Company Profile |
SEC
News |
Chart |
Request a new note
C
A
S
I |
OLLI
-
NASDAQ
Ollie's Bargain Outlet
Retail-DiscountandVariety
|
$48.80
|
+0.18
0.36% |
$49.90
|
528,841
110.18% of 50 DAV
50 DAV is 480,000
|
$51.53
-5.29%
|
11/21/2017
|
$46.78
|
PP = $47.00
|
|
MB = $49.35
|
Most Recent Note - 12/12/2017 6:14:39 PM
Y - Color code is changed to yellow after pulling back below its "max buy" level. Its 50 DMA line ($46.01) defines important near-term support. Fundamentals remain strong.
>>> FEATURED STOCK ARTICLE : Recently Stalled After Reaching a New High - 11/27/2017 |
View all notes |
Set NEW NOTE alert |
Company Profile |
SEC
News |
Chart |
Request a new note
C
A
S
I |
HLI
-
NYSE
Houlihan Lokey Inc Cl A
Finance-Invest Bnk/Bkrs
|
$45.47
|
-0.04
-0.09% |
$46.02
|
238,214
96.44% of 50 DAV
50 DAV is 247,000
|
$46.30
-1.79%
|
9/18/2017
|
$37.04
|
PP = $39.78
|
|
MB = $41.77
|
Most Recent Note - 12/12/2017 6:12:03 PM
G - Wedged to a new all-time high with today's 4th consecutive gain, getting more extended from any sound base. Its 50 DMA line ($42.19) defines near-term support to watch. On 10/26/17 it priced a Secondary Offering. Fundamentals remain strong. See the latest FSU analysis for more details and a new annotated graph.
>>> FEATURED STOCK ARTICLE : Wedging Higher With Recent Gains Lacking Great Volume - 12/12/2017 |
View all notes |
Set NEW NOTE alert |
Company Profile |
SEC
News |
Chart |
Request a new note
C
A
S
I |
|
|
|
THESE ARE NOT BUY RECOMMENDATIONS!
Comments contained in the body of this report are technical
opinions only. The material herein has been obtained
from sources believed to be reliable and accurate, however,
its accuracy and completeness cannot be guaranteed.
This site is not an investment advisor, hence it does
not endorse or recommend any securities or other investments.
Any recommendation contained in this report may not
be suitable for all investors and it is not to be deemed
an offer or solicitation on our part with respect to
the purchase or sale of any securities. All trademarks,
service marks and trade names appearing in this report
are the property of their respective owners, and are
likewise used for identification purposes only.
This report is a service available
only to active Paid Premium Members.
You may opt-out of receiving report notifications
at any time. Questions or comments may be submitted
by writing to Premium Membership Services 665 S.E. 10 Street, Suite 201 Deerfield Beach, FL 33441-5634 or by calling 1-800-965-8307
or 954-785-1121.
|
|
|