You are not logged in.
This means you
CAN ONLY VIEW reports that were published prior to Thursday, March 20, 2025.
You
MUST UPGRADE YOUR MEMBERSHIP if you want to see any current reports.
AFTER MARKET UPDATE - TUESDAY, DECEMBER 12TH, 2017
Previous After Market Report Next After Market Report >>>
|
|
|
|
DOW |
+118.77 |
24,504.80 |
+0.49% |
|
Volume |
854,837,140 |
+9% |
|
Volume |
1,855,559,657 |
+2% |
|
NASDAQ |
-12.76 |
6,862.32 |
-0.19% |
|
Advancers |
1,345 |
46% |
|
Advancers |
1,220 |
46% |
|
S&P 500 |
+4.14 |
2,664.13 |
+0.16% |
|
Decliners |
1,583 |
54% |
|
Decliners |
1,409 |
54% |
|
Russell 2000 |
-3.37 |
1,516.47 |
-0.22% |
|
52 Wk Highs |
116 |
|
|
52 Wk Highs |
91 |
|
|
S&P 600 |
-1.97 |
923.35 |
-0.21% |
|
52 Wk Lows |
19 |
|
|
52 Wk Lows |
39 |
|
|
 |
Small Caps Lagged as Major Indices Ended Mixed
Kenneth J. Gruneisen - Passed the CAN SLIM® Master's Exam
Small caps lagged as the major indices ended mixed and breadth was fairly even on Tuesday's session. Volume totals reported were higher than the prior session totals on the NYSE and on the Nasdaq exchange. Decliners led advancers by a narrow 8-7 margin on the NYSE and by a 7-6 margin on the Nasdaq exchange. Leadership thinned as there were 36 high-ranked companies from the Leaders List that made new 52-week highs and were listed on the BreakOuts Page, versus the total of 45 on the prior session. New 52-week highs outnumbered new 52-week lows on the NYSE and on the Nasdaq exchange. The Featured Stocks Page provides the latest analysis on noteworthy high-ranked leaders. Charts used courtesy of www.stockcharts.com
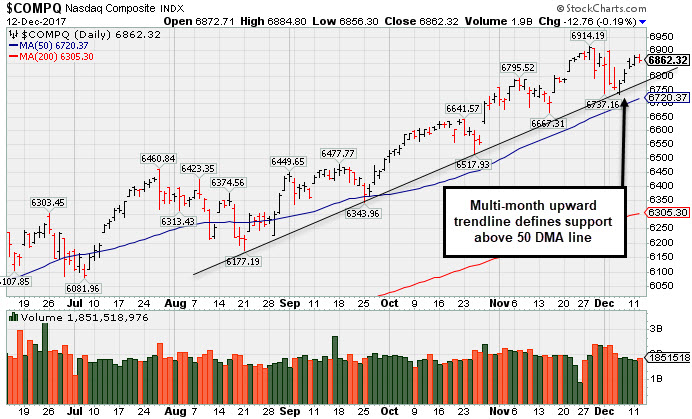 PICTURED: The Nasdaq Composite Index is consolidating near its record high, up +27.48% year-to-date. A multi-month upward trendline defines near term support above its 50-day moving average (DMA) line.
The major averages (M criteria) are in a confirmed uptrend. Investors should only consider stocks meeting all key criteria of the fact-based investment system as they trigger technical buy signals.
U.S. equities were mixed as the U.S. central bank began its two day policy meeting. Investors anticipate the central bank will announce its third interest rate hike in 2017 on Wednesday afternoon. On the economic front, a report showed small business optimism unexpectedly rose to the highest level since 1983 in November. The Labor Department said wholesale prices increased 0.4% last month slightly above expectations of a 0.3% gain. The Treasury Budget for November showed a deficit of $138.5 billion, up from $136.7 billion in October, and up versus a deficit of $136.7 billion for November 2016.
Telecom stocks helped pace gains with Verizon (VZ +2.60%) and AT&T (T +3.25%) both rising. Financials also were outperforming as shares of Goldman Sachs (GS +3.02%) rose. Semi-conductors were lagging the overall market as Nvidia (NVDA -1.96%) sputtered. In other news, Boeing (BA +2.39%) rose after the company raised its quarterly dividend and authorized share buybacks. |
 Kenneth J. Gruneisen started out as a licensed stockbroker in August 1987, a couple of months prior to the historic stock market crash that took the Dow Jones Industrial Average down -22.6% in a single day. He has published daily fact-based fundamental and technical analysis on high-ranked stocks online for two decades. Through FACTBASEDINVESTING.COM, Kenneth provides educational articles, news, market commentary, and other information regarding proven investment systems that work in good times and bad.
Comments contained in the body of this report are technical opinions only and are not necessarily those of Gruneisen Growth Corp. The material herein has been obtained from sources believed to be reliable and accurate, however, its accuracy and completeness cannot be guaranteed. Our firm, employees, and customers may effect transactions, including transactions contrary to any recommendation herein, or have positions in the securities mentioned herein or options with respect thereto. Any recommendation contained in this report may not be suitable for all investors and it is not to be deemed an offer or solicitation on our part with respect to the purchase or sale of any securities. |
|
 |
Financials and Oil Services Indexes Rose
Kenneth J. Gruneisen - Passed the CAN SLIM® Master's Exam
The Broker/Dealer Index ($XBD +1.30%) and Bank Index ($BKX +1.09%) rose on Tuesday, but the Retail Index ($RLX -0.26%) edged lower. The tech sector had a negative bias as the Semiconductor Index ($SOX -0.99%) and the Biotechnology Index ($BTK -1.00%) both fell while the Networking Index ($NWX +0.10%) eked out a tiny gain. The Oil Services Index ($OSX +o.47%) posted a small gain while the Integrated Oil Index ($XOI +0.06%) and the Gold & Silver Index ($XAU -0.12%) were little unchanged. Charts courtesy www.stockcharts.com
 PICTURED: The Retail Index ($RLX -0.26%) is perched near its record high. Strong action in the retail index is a reassuring sign, especially since consumer spending accounts for nearly 2/3 of the total US economy.
| Oil Services |
$OSX |
136.70 |
+0.65 |
+0.48% |
-25.62% |
| Integrated Oil |
$XOI |
1,277.19 |
+0.62 |
+0.05% |
+0.73% |
| Semiconductor |
$SOX |
1,233.18 |
-12.40 |
-1.00% |
+36.04% |
| Networking |
$NWX |
490.53 |
+0.50 |
+0.10% |
+9.96% |
| Broker/Dealer |
$XBD |
266.53 |
+3.45 |
+1.31% |
+29.84% |
| Retail |
$RLX |
1,692.12 |
-4.48 |
-0.26% |
+26.00% |
| Gold & Silver |
$XAU |
76.90 |
-0.09 |
-0.12% |
-2.49% |
| Bank |
$BKX |
107.33 |
+1.16 |
+1.09% |
+16.93% |
| Biotech |
$BTK |
4,146.94 |
-41.99 |
-1.00% |
+34.86% |
|
|
|
 |
Wedging Higher With Recent Gains Lacking Great Volume
Kenneth J. Gruneisen - Passed the CAN SLIM® Master's Exam
Houlihan Lokey Inc (HLI +$0.45 or +1.00% to $45.51) wedged to a new all-time high with below average volume behind today's 4th consecutive gain. It is extended from any sound base. Its 50-day moving average (DMA) line ($42.19) defines near-term support to watch on pullbacks.
On 10/26/17 it priced a Secondary Offering. Members were previously reminded - "Such offerings typically hinder price performance for a short time, yet they also help to attract new or greater institutional interest (I criteria)."
The high ranked Finance - Invest Bank/Broker firm was last shown in this FSU section on 11/16/17 with an annotated graph under the headline, "Holding Ground Near Record High". Fundamentals remain strong. It reported earnings +51% on +30% sales revenues for its second quarter ended September 30th versus the year-ago period. The past 3 quarterly comparisons were above the +25% minimum earning guideline (C criteria). Annual earnings growth (A criteria) history is a good match with the fact-based investment system's guidelines. It has an Earnings Per share rating of 98.
Its current Up/Down Volume Ratio of 1.4 is an unbiased indication its shares have been under accumulation over the past 50 days. It has a current Timeliness rating of A and a Sponsorship rating of B. The number of top-rated funds owning its shares rose from 165 in Jun '16 to 282 in Sep '17, also a reassuring sign concerning the I criteria. Its small supply of only 26.3 million shares (S criteria) in the public float can contribute to greater price volatility in the event of institutional buying or selling.
|
|
|
Color Codes Explained :
Y - Better candidates highlighted by our
staff of experts.
G - Previously featured
in past reports as yellow but may no longer be buyable under the
guidelines.
***Last / Change / Volume data in this table is the closing quote data***
Symbol/Exchange
Company Name
Industry Group |
PRICE |
CHANGE
(%Change) |
Day High |
Volume
(% DAV)
(% 50 day avg vol) |
52 Wk Hi
% From Hi |
Featured
Date |
Price
Featured |
Pivot Featured |
|
Max Buy |
THO
-
NYSE
Thor Industries Inc
AUTOMOTIVE - Recreational Vehicles
|
$149.41
|
-0.74
-0.49% |
$151.80
|
432,692
62.89% of 50 DAV
50 DAV is 688,000
|
$156.86
-4.75%
|
8/14/2017
|
$106.67
|
PP = $110.01
|
|
MB = $115.51
|
Most Recent Note - 12/7/2017 5:12:00 PM
G - Hovering near its all-time high, very extended from any sound base. Its 50 DMA line ($134.54) and recent low ($127.29 on 11/08/17) define near-term support to watch. Reported earnings +63% on +31% sales revenues for the Oct '17 quarter, continuing its strong earnings track record. See the latest FSU analysis for more details and a new annotated graph.
>>> FEATURED STOCK ARTICLE : Very Extended From Prior Base and Hovering Near Record High - 12/7/2017 |
View all notes |
Set NEW NOTE alert |
Company Profile |
SEC
News |
Chart |
Request a new note
C
A
S
I |
PFBC
-
NASDAQ
Preferred Bank Los Angls
BANKING - Regional - Pacific Banks
|
$61.98
|
-0.14
-0.23% |
$62.85
|
41,906
55.14% of 50 DAV
50 DAV is 76,000
|
$66.58
-6.91%
|
10/10/2017
|
$59.38
|
PP = $59.08
|
|
MB = $62.03
|
 Most Recent Note - 12/12/2017 2:18:18 PM
G - Recently met resistance in the $66 area yet found prompt support at its 50 DMA line ($60.74) during its consolidation. Fundamentals remain strong.
>>> FEATURED STOCK ARTICLE : Challenged High After Finding Support at 50 Day Moving Average - 12/5/2017 |
View all notes |
Set NEW NOTE alert |
Company Profile |
SEC
News |
Chart |
Request a new note
C
A
S
I |
AVGO
-
NASDAQ
Avago Technologies Ltd
ELECTRONICS - Semiconductor - Broad Line
|
$258.56
|
-1.39
-0.53% |
$260.88
|
2,680,804
82.39% of 50 DAV
50 DAV is 3,253,800
|
$285.68
-9.49%
|
10/30/2017
|
$261.19
|
PP = $259.46
|
|
MB = $272.43
|
Most Recent Note - 12/8/2017 5:04:14 PM
G - Testing support near prior highs in the $259 area and its 50 DMA line. More damaging losses would raise greater concerns. Fundamentals remain strong. See the latest FSU analysis for more details and a new annotated graph.
>>> FEATURED STOCK ARTICLE : Testing Support at Prior Highs and 50-Day Average - 12/8/2017 |
View all notes |
Set NEW NOTE alert |
Company Profile |
SEC
News |
Chart |
Request a new note
C
A
S
I |
YY
-
NASDAQ
YY Inc Ads
INTERNET - Internet Service Providers
|
$106.31
|
-1.03
-0.96% |
$107.57
|
646,578
41.77% of 50 DAV
50 DAV is 1,548,000
|
$123.48
-13.91%
|
9/25/2017
|
$80.26
|
PP = $83.10
|
|
MB = $87.26
|
Most Recent Note - 12/11/2017 7:30:05 PM
G - Consolidating above its prior high ($97.59 on 10/16/17) and above its 50 DMA line ($97.29). It is extended from any sound base. Fundamentals remain strong. See the latest FSU analysis for more details and a new annotated graph.
>>> FEATURED STOCK ARTICLE : Fundamentals Remain Strong; Extended From Any Sound Base - 12/11/2017 |
View all notes |
Set NEW NOTE alert |
Company Profile |
SEC
News |
Chart |
Request a new note
C
A
S
I |
HTHT
-
NASDAQ
China Lodging Group Ads
LEISURE - Lodging
|
$119.20
|
-1.81
-1.49% |
$121.47
|
637,007
114.57% of 50 DAV
50 DAV is 556,000
|
$142.80
-16.53%
|
9/29/2016
|
$46.12
|
PP = $47.82
|
|
MB = $50.21
|
Most Recent Note - 12/11/2017 1:09:52 PM
G - Rebounded near its 50 DMA line ($124.84) which may act as resistance. Gains above the 50 DMA line are still needed for its outlook to improve. Fundamentals remain strong.
>>> FEATURED STOCK ARTICLE : Weak Technical Action Raises Concerns Despite Strong Fundamentals - 11/29/2017 |
View all notes |
Set NEW NOTE alert |
Company Profile |
SEC
News |
Chart |
Request a new note
C
A
S
I |
Symbol/Exchange
Company Name
Industry Group |
PRICE |
CHANGE
(%Change) |
Day High |
Volume
(% DAV)
(% 50 day avg vol) |
52 Wk Hi
% From Hi |
Featured
Date |
Price
Featured |
Pivot Featured |
|
Max Buy |
PATK
-
NASDAQ
Patrick Industries Inc
Bldg-Mobile/Mfg and RV
|
$64.60
|
-1.10
-1.67% |
$66.55
|
201,736
234.58% of 50 DAV
50 DAV is 86,000
|
$68.63
-5.88%
|
10/26/2017
|
$90.90
|
PP = $87.90
|
|
MB = $92.30
|
Most Recent Note - 12/12/2017 1:05:31 PM
G - Hovering near its all-time high, extended from its prior base. Its 50 DMA line ($60.28) defines important near-term support to watch. Fundamentals remain strong. Shares split 3/2 effective 12/11/17, so do not be confused by the impact on the share prices.
>>> FEATURED STOCK ARTICLE : Best Ever Close After Pullback Found Support Near Prior High - 11/21/2017 |
View all notes |
Set NEW NOTE alert |
Company Profile |
SEC
News |
Chart |
Request a new note
C
A
S
I |
ESNT
-
NYSE
Essent Group Ltd
Finance-MrtgandRel Svc
|
$46.44
|
-0.32
-0.68% |
$47.07
|
446,186
47.57% of 50 DAV
50 DAV is 938,000
|
$47.29
-1.80%
|
10/9/2017
|
$39.75
|
PP = $41.54
|
|
MB = $43.62
|
Most Recent Note - 12/11/2017 7:24:15 PM
G - Touched a new high today while quietly posting a 7th consecutive gain. Its 50 DMA line ($43.10) along with the recent low ($43.07 on 12/01/17) define important near-term support to watch on pullbacks. Fundamentals remain strong.
>>> FEATURED STOCK ARTICLE : Recent Consolidation Was Not a Sufficient Length New Base - 11/20/2017 |
View all notes |
Set NEW NOTE alert |
Company Profile |
SEC
News |
Chart |
Request a new note
C
A
S
I |
FIVE
-
NASDAQ
Five Below Inc
Retail-DiscountandVariety
|
$66.13
|
+0.98
1.50% |
$66.36
|
1,248,692
126.00% of 50 DAV
50 DAV is 991,000
|
$67.53
-2.07%
|
10/6/2017
|
$57.13
|
PP = $54.23
|
|
MB = $56.94
|
Most Recent Note - 12/11/2017 7:32:18 PM
G - Encountered distributional pressure today and retreated from its all-time high with a loss on higher volume. Very extended from its prior base, its 50 DMA line ($58.31) and prior highs in the $57-58 area define near-term support to watch. Fundamentals remain strong.
>>> FEATURED STOCK ARTICLE : Getting Extended From Prior Base With Earnings News Due - 11/24/2017 |
View all notes |
Set NEW NOTE alert |
Company Profile |
SEC
News |
Chart |
Request a new note
C
A
S
I |
OLED
-
NASDAQ
Universal Display Corp
Elec-Misc Products
|
$169.50
|
-2.10
-1.22% |
$173.15
|
690,289
73.99% of 50 DAV
50 DAV is 933,000
|
$192.75
-12.06%
|
8/31/2017
|
$128.22
|
PP = $127.78
|
|
MB = $134.17
|
Most Recent Note - 12/8/2017 1:20:17 PM
G - Gapped up today, rallying on news of a new supply agreement. It has not formed a sound base pattern. Its 50 DMA line ($154.83) and prior high in the $145 area define important near-term support to watch on pullbacks.
>>> FEATURED STOCK ARTICLE : Electronic Products Firm Perched at Record High - 11/17/2017 |
View all notes |
Set NEW NOTE alert |
Company Profile |
SEC
News |
Chart |
Request a new note
C
A
S
I |
ANET
-
NYSE
Arista Networks Inc
TELECOMMUNICATIONS - Communication Equipment
|
$218.20
|
-5.49
-2.45% |
$223.30
|
612,002
75.28% of 50 DAV
50 DAV is 813,000
|
$245.65
-11.17%
|
10/27/2017
|
$195.65
|
PP = $196.37
|
|
MB = $206.19
|
Most Recent Note - 12/7/2017 5:23:51 PM
G - Posted a 3rd consecutive gain today with higher volume. The 50 DMA line ($207.70) defines important near-term support above prior highs in the $196 area. Violations may trigger technical sell signals. See the latest FSU analysis for more details and an annotated graph.
>>> FEATURED STOCK ARTICLE : Halted Volume-Driven Pullback at 50-Day Moving Average Line - 12/6/2017 |
View all notes |
Set NEW NOTE alert |
Company Profile |
SEC
News |
Chart |
Request a new note
C
A
S
I |
Symbol/Exchange
Company Name
Industry Group |
PRICE |
CHANGE
(%Change) |
Day High |
Volume
(% DAV)
(% 50 day avg vol) |
52 Wk Hi
% From Hi |
Featured
Date |
Price
Featured |
Pivot Featured |
|
Max Buy |
GRUB
-
NYSE
Grubhub Inc
COMPUTER SOFTWARE and SERVICES - Technical and System Software
|
$69.84
|
-0.50
-0.71% |
$71.22
|
800,796
55.73% of 50 DAV
50 DAV is 1,437,000
|
$70.74
-1.27%
|
6/21/2017
|
$47.33
|
PP = $46.94
|
|
MB = $49.29
|
Most Recent Note - 12/11/2017 7:38:00 PM
G - Hit another new all-time high with today's gain backed by above average volume, getting very extended from any sound base. Its 50 DMA line ($60.30) and prior highs near $57 define support to watch on pullbacks. The 2 latest quarters were below the +25% minimum earnings guideline (C criteria), raising fundamental concerns with regard to the fact-based investment system.
>>> FEATURED STOCK ARTICLE : Extended From Prior Highs After Gains on Light Volume - 11/22/2017 |
View all notes |
Set NEW NOTE alert |
Company Profile |
SEC
News |
Chart |
Request a new note
C
A
S
I |
IBP
-
NYSE
Installed Building Prod
DIVERSIFIED SERVICES - Business/Management Services
|
$69.70
|
-1.40
-1.97% |
$71.64
|
150,471
84.06% of 50 DAV
50 DAV is 179,000
|
$79.40
-12.22%
|
9/19/2017
|
$59.15
|
PP = $60.10
|
|
MB = $63.11
|
Most Recent Note - 12/12/2017 2:20:39 PM
G - Encountering distributional pressure after getting very extended from any sound base. The prior high ($70.25 on 11/01/17) and its 50 DMA line ($68.21) define important near-term support to watch. Subsequent losses leading to violations may trigger technical sell signals. Fundamentals remain strong.
>>> FEATURED STOCK ARTICLE : Extended From Any Sound Base After Impressive Rebound and Rally - 12/1/2017 |
View all notes |
Set NEW NOTE alert |
Company Profile |
SEC
News |
Chart |
Request a new note
C
A
S
I |
OLLI
-
NASDAQ
Ollie's Bargain Outlet
Retail-DiscountandVariety
|
$47.95
|
-1.95
-3.91% |
$50.10
|
559,065
117.20% of 50 DAV
50 DAV is 477,000
|
$51.53
-6.94%
|
11/21/2017
|
$46.78
|
PP = $47.00
|
|
MB = $49.35
|
Most Recent Note - 12/12/2017 6:14:39 PM
Y - Color code is changed to yellow after pulling back below its "max buy" level. Its 50 DMA line ($46.01) defines important near-term support. Fundamentals remain strong.
>>> FEATURED STOCK ARTICLE : Recently Stalled After Reaching a New High - 11/27/2017 |
View all notes |
Set NEW NOTE alert |
Company Profile |
SEC
News |
Chart |
Request a new note
C
A
S
I |
HLI
-
NYSE
Houlihan Lokey Inc Cl A
Finance-Invest Bnk/Bkrs
|
$45.51
|
+0.45
1.00% |
$45.86
|
169,750
69.57% of 50 DAV
50 DAV is 244,000
|
$45.30
0.46%
|
9/18/2017
|
$37.04
|
PP = $39.78
|
|
MB = $41.77
|
Most Recent Note - 12/12/2017 6:12:03 PM
G - Wedged to a new all-time high with today's 4th consecutive gain, getting more extended from any sound base. Its 50 DMA line ($42.19) defines near-term support to watch. On 10/26/17 it priced a Secondary Offering. Fundamentals remain strong. See the latest FSU analysis for more details and a new annotated graph.
>>> FEATURED STOCK ARTICLE : Wedging Higher With Recent Gains Lacking Great Volume - 12/12/2017 |
View all notes |
Set NEW NOTE alert |
Company Profile |
SEC
News |
Chart |
Request a new note
C
A
S
I |
|
|
|
THESE ARE NOT BUY RECOMMENDATIONS!
Comments contained in the body of this report are technical
opinions only. The material herein has been obtained
from sources believed to be reliable and accurate, however,
its accuracy and completeness cannot be guaranteed.
This site is not an investment advisor, hence it does
not endorse or recommend any securities or other investments.
Any recommendation contained in this report may not
be suitable for all investors and it is not to be deemed
an offer or solicitation on our part with respect to
the purchase or sale of any securities. All trademarks,
service marks and trade names appearing in this report
are the property of their respective owners, and are
likewise used for identification purposes only.
This report is a service available
only to active Paid Premium Members.
You may opt-out of receiving report notifications
at any time. Questions or comments may be submitted
by writing to Premium Membership Services 665 S.E. 10 Street, Suite 201 Deerfield Beach, FL 33441-5634 or by calling 1-800-965-8307
or 954-785-1121.
|
|
|


