You are not logged in.
This means you
CAN ONLY VIEW reports that were published prior to Thursday, March 20, 2025.
You
MUST UPGRADE YOUR MEMBERSHIP if you want to see any current reports.
AFTER MARKET UPDATE - FRIDAY, OCTOBER 6TH, 2017
Previous After Market Report Next After Market Report >>>
|
|
|
|
DOW |
-1.72 |
22,773.67 |
-0.01% |
|
Volume |
728,072,480 |
-2% |
|
Volume |
1,753,830,060 |
-7% |
|
NASDAQ |
+4.82 |
6,590.18 |
+0.07% |
|
Advancers |
1,058 |
36% |
|
Advancers |
1,330 |
49% |
|
S&P 500 |
-2.74 |
2,549.33 |
-0.11% |
|
Decliners |
1,846 |
64% |
|
Decliners |
1,375 |
51% |
|
Russell 2000 |
-1.87 |
1,510.22 |
-0.12% |
|
52 Wk Highs |
172 |
|
|
52 Wk Highs |
193 |
|
|
S&P 600 |
-1.64 |
915.10 |
-0.18% |
|
52 Wk Lows |
19 |
|
|
52 Wk Lows |
18 |
|
|
 |
Indices Quietly Ended Week Perched at Record Highs
Kenneth J. Gruneisen - Passed the CAN SLIM® Master's Exam
For the week, the S&P 500 climbed 1.2% while the Dow gained 1.7% and the Nasdaq advanced 1.5%. Stocks finished little-changed Friday. The Dow lost 1 point to 22773. The S&P 500 was off 2 points to 2549. The Nasdaq Composite added 4 points to 6590. Volume totals reported were lighter than the prior session totals on the NYSE and on the Nasdaq exchange. Decliners led advancers by a 9-5 margin on the NYSE but decliners narrowly outnumbered advancers on the Nasdaq exchange. There were 82 high-ranked companies from the Leaders List that made new 52-week highs and were listed on the BreakOuts Page, versus the total of 90 on the prior session. New 52-week highs totals solidly outnumbered new 52-week lows totals on the Nasdaq exchange and on the NYSE. The Featured Stocks Page provides the latest analysis on noteworthy high-ranked leaders. Charts used courtesy of www.stockcharts.com
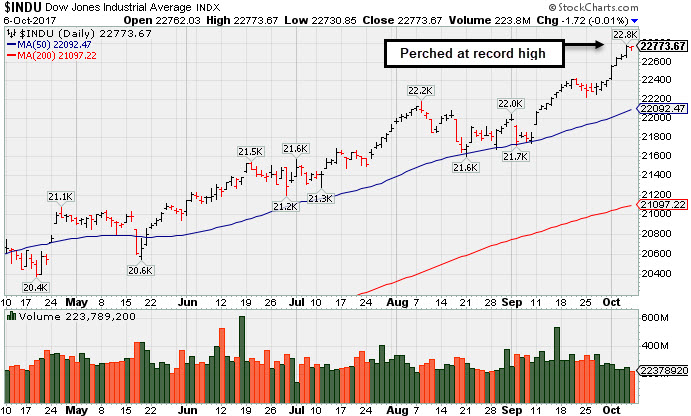 PICTURED: The Index hit a new record high with an 8th consecutive gain. During the recent consolidation it found support at its 50-day moving average (DMA) line.
The major averages' (M criteria) are in a confirmed uptrend. Leadership has remained healthy. Investors should buy stocks meeting all key criteria of the fact-based investment system on a case-by-case basis as they trigger technical buy signals.
Despite a late rally, the S&P 500 snapped an eight session winning streak following a mixed update on the employment landscape. The Labor Department reported nonfarm payrolls fell in September for the first month since 2010, decreasing 33,000 versus consensus projections of an 80,000 job gain. However, average hourly earnings increased above consensus expectations and the unemployment rate fell to 4.2%, the lowest level since February 2001. According to Fed fund futures from the CME Group, markets are pricing in a 90.6% change of a December rate hike following the release. Treasury prices fell with the yield on the 10-year note climbing three basis points to 2.37%.
Eight of 11 sectors in the S&P 500 declined with Energy stocks lagging after NYMEX WTI crude fell 2.8% to $49.35/barrel to cap its worst week since May. Consumer Staples also underperformed with Walgreens (WBA -4.87%) and CVS Health (CVS -4.29%) fell following news Amazon (AMZN +0.89%) is considering a foray into the prescription business. In earnings news, Costco (COST -5.97%) fell as membership renewal rates declined and profit margins narrowed. Under Armour (UA +2.86%) was a notable gainer, climbing after being the subject of positive analyst commentary. |
 Kenneth J. Gruneisen started out as a licensed stockbroker in August 1987, a couple of months prior to the historic stock market crash that took the Dow Jones Industrial Average down -22.6% in a single day. He has published daily fact-based fundamental and technical analysis on high-ranked stocks online for two decades. Through FACTBASEDINVESTING.COM, Kenneth provides educational articles, news, market commentary, and other information regarding proven investment systems that work in good times and bad.
Comments contained in the body of this report are technical opinions only and are not necessarily those of Gruneisen Growth Corp. The material herein has been obtained from sources believed to be reliable and accurate, however, its accuracy and completeness cannot be guaranteed. Our firm, employees, and customers may effect transactions, including transactions contrary to any recommendation herein, or have positions in the securities mentioned herein or options with respect thereto. Any recommendation contained in this report may not be suitable for all investors and it is not to be deemed an offer or solicitation on our part with respect to the purchase or sale of any securities. |
|
 |
Gold & Silver, Semiconductor, and Retail Indexes Rose
Kenneth J. Gruneisen - Passed the CAN SLIM® Master's Exam
On Friday the Broker/Dealer Index ($XBD -0.07%) and the Bank Index ($BKX +0.15%) were little changed and the Retail Index ($RLX +0.32%) posted a small gain. The tech sector was mixed as the Semiconductor Index ($SOX +0.45%) outpaced the Networking Index ($NWX +0.10%) but the Biotechnology Index ($BTK -0.52%) fell. Commodities-linked groups were mixed as the Gold & Silver Index ($XAU +0.98%) rose but the Integrated Oil Index ($XOI -0.91%) and the Oil Services Index ($OSX -1.37%) both ended lower. Charts courtesy www.stockcharts.com
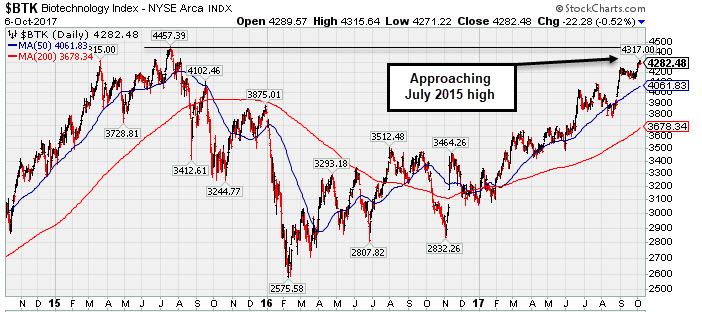 PICTURED: The Biotechnology Index ($BTK -0.52%) has been approaching its July 2015 high.
| Oil Services |
$OSX |
138.33 |
-1.92 |
-1.37% |
-24.73% |
| Integrated Oil |
$XOI |
1,210.29 |
-11.16 |
-0.91% |
-4.55% |
| Semiconductor |
$SOX |
1,191.45 |
+5.38 |
+0.45% |
+31.44% |
| Networking |
$NWX |
471.31 |
+0.47 |
+0.10% |
+5.65% |
| Broker/Dealer |
$XBD |
248.03 |
-0.16 |
-0.07% |
+20.82% |
| Retail |
$RLX |
1,558.74 |
+5.00 |
+0.32% |
+16.07% |
| Gold & Silver |
$XAU |
86.90 |
+0.84 |
+0.98% |
+10.20% |
| Bank |
$BKX |
100.75 |
+0.16 |
+0.16% |
+9.76% |
| Biotech |
$BTK |
4,282.48 |
-22.28 |
-0.52% |
+39.27% |
|
|
|
 |
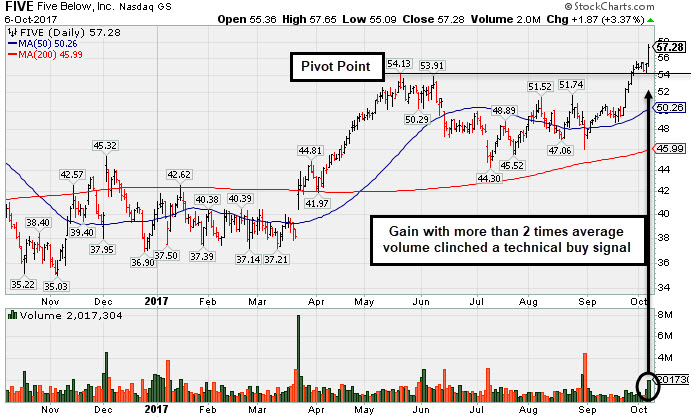
Finished Strong With Above Average Volume Behind Big Gain
Kenneth J. Gruneisen - Passed the CAN SLIM® Master's Exam
Five Below Inc (FIVE +$1.87 or +3.37% to $57.28) finished strong after highlighted in yellow with new pivot point cited based on its 5/19/17 high plus 10 cents in the earlier mid-day report. Recent gains above the prior high lacked great volume conviction. Today's gain was backed by +130% above average volume, having the look of heavier institutional buying demand, however it is getting extended from the latest base
Found support above its 200 DMA line during its consolidation and rebounded since dropped from the Featured Stocks list on 6/27/17. Quarterly and annual earnings history (C and A criteria) has been strong. Also showing acceleration in sales revenues and earnings in sequential quarterly comparisons through Jul '17..
The Retail - Discount & Variety firm has a 99 Earnings Per Share Rating. It posted earnings +67% on +29% sales revenues for the Jul '17 quarter, and 3 of the past 4 earnings increases were above the +25% minimum guideline (C criteria), helping it better match the fact-based investment system's winning models. It has a good annual earnings (A criteria) track record.
FIVE had a choppy history since its $17 IPO in July 2012 and 3 subsequent Secondary Offerings. It has a small supply of 55.2 million shares outstanding (S criteria). Its current Timeliness Rating is A and its Sponsorship Rating is B. The number of top-rated funds owning its shares rose from 432 in Jun '16 to 478 in Jun '17, a reassuring sign concerning the I criteria. Its current Up/Down Volume Ratio of 1.5 is an unbiased indication its shares have been under slight accumulation over the past 50 days.
|
|
|
Color Codes Explained :
Y - Better candidates highlighted by our
staff of experts.
G - Previously featured
in past reports as yellow but may no longer be buyable under the
guidelines.
***Last / Change / Volume data in this table is the closing quote data***
Symbol/Exchange
Company Name
Industry Group |
PRICE |
CHANGE
(%Change) |
Day High |
Volume
(% DAV)
(% 50 day avg vol) |
52 Wk Hi
% From Hi |
Featured
Date |
Price
Featured |
Pivot Featured |
|
Max Buy |
MPX
-
NYSE
Marine Products Corp
AUTOMOTIVE - Recreational Vehicles
|
$16.42
|
+0.14
0.86% |
$16.48
|
21,889
60.80% of 50 DAV
50 DAV is 36,000
|
$17.12
-4.09%
|
9/26/2017
|
$16.30
|
PP = $16.35
|
|
MB = $17.17
|
Most Recent Note - 10/5/2017 7:58:03 PM
Y - Found prompt support above its 50 DMA line as it encountered damaging distributional pressure on 9/29/17. Members were cautioned in the note 5:19PM 9/27/17 - "Hit yet another new high with today's 6th consecutive gain, however, volume was only +13% above average, not indicative of heavy institutional buying demand. It was highlighted in yellow with pivot point cited based on its 7/12/17 high plus 10 cents in the 9/26/17 mid-day report. Gains above the pivot point must be backed by at least +40% above average volume to clinch a convincing technical buy signal.
>>> FEATURED STOCK ARTICLE : Powerboat Maker Hit Another New 52-Week High - 9/26/2017 |
View all notes |
Set NEW NOTE alert |
Company Profile |
SEC
News |
Chart |
Request a new note
C
A
S
I |
THO
-
NYSE
Thor Industries Inc
AUTOMOTIVE - Recreational Vehicles
|
$129.07
|
+1.95
1.53% |
$129.37
|
720,339
107.03% of 50 DAV
50 DAV is 673,000
|
$129.71
-0.49%
|
8/14/2017
|
$106.67
|
PP = $110.01
|
|
MB = $115.51
|
Most Recent Note - 10/2/2017 9:33:58 PM
G - Hit yet another new 52-week high with today's 6th consecutive volume-driven gain, getting more extended from the previously noted base. Prior highs in the $115 area define initial support to watch on pullbacks. Fundamentals remain strong.
>>> FEATURED STOCK ARTICLE : Wedged to New High Then Ended the Session Weak - 9/18/2017 |
View all notes |
Set NEW NOTE alert |
Company Profile |
SEC
News |
Chart |
Request a new note
C
A
S
I |
AVGO
-
NASDAQ
Broadcom Limited
ELECTRONICS - Semiconductor - Broad Line
|
$245.74
|
+2.07
0.85% |
$245.75
|
1,748,856
66.09% of 50 DAV
50 DAV is 2,646,000
|
$259.36
-5.25%
|
8/24/2017
|
$252.44
|
PP = $256.89
|
|
MB = $269.73
|
Most Recent Note - 10/3/2017 8:52:01 PM
G - A rebound above the 50 DMA line ($247.59) is needed for its outlook to improve. More damaging losses below the recent low ($231.53 on 9/25/17) would raise serious concerns and trigger a more worrisome technical sell signal.
>>> FEATURED STOCK ARTICLE : Technical Deterioration Raises Concerns - 9/21/2017 |
View all notes |
Set NEW NOTE alert |
Company Profile |
SEC
News |
Chart |
Request a new note
C
A
S
I |
YY
-
NASDAQ
YY Inc Ads
INTERNET - Internet Service Providers
|
$88.74
|
-0.21
-0.24% |
$89.68
|
787,249
44.05% of 50 DAV
50 DAV is 1,787,000
|
$94.00
-5.60%
|
9/25/2017
|
$80.26
|
PP = $83.10
|
|
MB = $87.26
|
Most Recent Note - 10/3/2017 11:45:17 AM
G - Hit another new 52-week high today, getting more extended from its prior base. Recent gains above the pivot point triggered a technical buy signal. Prior highs in the $83 area define initial support to watch on pullbacks.
>>> FEATURED STOCK ARTICLE : Encountered Distributional Pressure When Challenging Prior HIgh - 9/25/2017 |
View all notes |
Set NEW NOTE alert |
Company Profile |
SEC
News |
Chart |
Request a new note
C
A
S
I |
STMP
-
NASDAQ
Stamps.com Inc
INTERNET - Internet Software and Services
|
$216.25
|
+0.55
0.25% |
$216.95
|
149,108
32.84% of 50 DAV
50 DAV is 454,000
|
$220.25
-1.82%
|
9/11/2017
|
$193.65
|
PP = $220.35
|
|
MB = $231.37
|
Most Recent Note - 10/4/2017 6:34:57 PM
Y - Posted a 4th consecutive gain today with light volume, rising near the new pivot point cited based on its 8/07/17 high plus 10 cents. Faces little near-term resistance. Subsequent volume-driven gains above the pivot point are needed to trigger a new (or add-on) technical buy signal. Recent low ($185.80 on 9/05/17) and its 50 DMA line ($197) define important near-term support where violations would trigger technical sell signals. See the latest FSU analysis for more details and a new annotated graph.
>>> FEATURED STOCK ARTICLE : Perched Near Pivot Point With No Resistance Remaining - 10/4/2017 |
View all notes |
Set NEW NOTE alert |
Company Profile |
SEC
News |
Chart |
Request a new note
C
A
S
I |
Symbol/Exchange
Company Name
Industry Group |
PRICE |
CHANGE
(%Change) |
Day High |
Volume
(% DAV)
(% 50 day avg vol) |
52 Wk Hi
% From Hi |
Featured
Date |
Price
Featured |
Pivot Featured |
|
Max Buy |
HTHT
-
NASDAQ
China Lodging Group Ads
LEISURE - Lodging
|
$127.96
|
+4.99
4.06% |
$129.49
|
345,340
96.46% of 50 DAV
50 DAV is 358,000
|
$126.29
1.32%
|
9/29/2016
|
$46.12
|
PP = $47.82
|
|
MB = $50.21
|
Most Recent Note - 10/5/2017 7:46:30 PM
G - Holding its ground near its all-time high, extended from any sound base. Earnings +19% on +18% sales revenues for the Jun '17 quarter were below the +25% minimum earnings guideline (C criteria). Its 50 DMA line ($110) defines near-term support. See the latest FSU analysis for more details and a new annotated graph.
>>> FEATURED STOCK ARTICLE : Holding Ground Stubbornly After Considerable Rally - 10/5/2017 |
View all notes |
Set NEW NOTE alert |
Company Profile |
SEC
News |
Chart |
Request a new note
C
A
S
I |
LMAT
-
NASDAQ
Lemaitre Vascular Inc
Medical-Products
|
$38.46
|
-0.15
-0.39% |
$38.61
|
79,886
37.16% of 50 DAV
50 DAV is 215,000
|
$39.29
-2.12%
|
7/28/2017
|
$33.50
|
PP = $33.32
|
|
MB = $34.99
|
Most Recent Note - 10/4/2017 6:30:02 PM
G - Posted a gain today on lighter than average volume. The 50 DMA line ($35.70) defines near-term support to watch above prior highs in the $33 area.
>>> FEATURED STOCK ARTICLE : Quietly Pulling Back From High After More Volume-Driven Gains - 9/22/2017 |
View all notes |
Set NEW NOTE alert |
Company Profile |
SEC
News |
Chart |
Request a new note
C
A
S
I |
ESNT
-
NYSE
Essent Group Ltd
Finance-MrtgandRel Svc
|
$40.11
|
-0.23
-0.57% |
$40.59
|
541,464
71.30% of 50 DAV
50 DAV is 759,400
|
$41.44
-3.21%
|
7/3/2017
|
$38.05
|
PP = $39.60
|
|
MB = $41.58
|
Most Recent Note - 10/5/2017 7:55:46 PM
Y - Tallied a gain with above average volume, perched within striking distance of its all-time high. Consolidating above its 50 DMA line ($38.84) with very little resistance remaining due to overhead supply.
>>> FEATURED STOCK ARTICLE : Perched Within Close Striking Distance of Prior High - 9/29/2017 |
View all notes |
Set NEW NOTE alert |
Company Profile |
SEC
News |
Chart |
Request a new note
C
A
S
I |
FIVE
-
NASDAQ
Five Below Inc
Retail-DiscountandVariety
|
$57.28
|
+1.87
3.37% |
$57.65
|
2,017,304
238.45% of 50 DAV
50 DAV is 846,000
|
$55.58
3.06%
|
10/6/2017
|
$57.13
|
PP = $54.23
|
|
MB = $56.94
|
 Most Recent Note - 10/6/2017 9:19:40 PM
Y - Finished strong today after highlighter in yellow with new pivot point cited based on its 5/19/17 high plus 10 cents. Found support above its 200 DMA line during its consolidation and rebounded since dropped from the Featured Stocks list on 6/27/17. Quarterly and annual earnings history (C and A criteria) has been strong. Also showing acceleration in sales revenues and earnings in sequential quarterly comparisons through Jul '17. See the latest FSU analysis for more details and a new annotated graph.
>>> FEATURED STOCK ARTICLE : Finished Strong With Above Average Volume Behind Big Gain - 10/6/2017 |
View all notes |
Set NEW NOTE alert |
Company Profile |
SEC
News |
Chart |
Request a new note
C
A
S
I |
OLED
-
NASDAQ
Universal Display Corp
Elec-Misc Products
|
$128.10
|
+0.90
0.71% |
$128.60
|
474,030
54.05% of 50 DAV
50 DAV is 877,000
|
$145.30
-11.84%
|
8/31/2017
|
$128.22
|
PP = $127.78
|
|
MB = $134.17
|
Most Recent Note - 10/5/2017 7:50:53 PM
Y - Quietly holding its ground after pulling back near prior highs in the $127-130 area. Its 50 DMA line ($122.77) and recent lows define important support to watch.
>>> FEATURED STOCK ARTICLE : Consolidating Near Prior Highs Following Recent Breakout - 9/28/2017 |
View all notes |
Set NEW NOTE alert |
Company Profile |
SEC
News |
Chart |
Request a new note
C
A
S
I |
Symbol/Exchange
Company Name
Industry Group |
PRICE |
CHANGE
(%Change) |
Day High |
Volume
(% DAV)
(% 50 day avg vol) |
52 Wk Hi
% From Hi |
Featured
Date |
Price
Featured |
Pivot Featured |
|
Max Buy |
ANET
-
NYSE
Arista Networks Inc
TELECOMMUNICATIONS - Communication Equipment
|
$192.93
|
+2.57
1.35% |
$193.40
|
722,226
85.57% of 50 DAV
50 DAV is 844,000
|
$193.24
-0.16%
|
8/4/2017
|
$173.31
|
PP = $163.07
|
|
MB = $171.22
|
Most Recent Note - 10/3/2017 8:44:52 PM
G - Hovering near its all-time high. extended from any sound base. Its 50 DMA line ($172.60) defines important near-term support to watch. Fundamentals remain very strong.
>>> FEATURED STOCK ARTICLE : Extended From Any Sound Base After Additional Volume-Driven Gains - 9/19/2017 |
View all notes |
Set NEW NOTE alert |
Company Profile |
SEC
News |
Chart |
Request a new note
C
A
S
I |
GRUB
-
NYSE
Grubhub Inc
COMPUTER SOFTWARE and SERVICES - Technical and System Software
|
$51.29
|
-0.69
-1.33% |
$51.95
|
2,330,002
119.30% of 50 DAV
50 DAV is 1,953,000
|
$57.61
-10.97%
|
6/21/2017
|
$47.33
|
PP = $46.94
|
|
MB = $49.29
|
Most Recent Note - 10/5/2017 7:52:56 PM
G - Slumped below its 50 DMA line ($53.51) with today's big loss on higher (near average) volume. More damaging losses below the recent low ($49.60 on 9/22/17) would raise greater concerns and trigger a worrisome technical sell signal. The next near-term support is prior highs in the $47 area. Recently reported earnings +13% on +32% sales revenues for the Jun '17 quarter, below the +25% minimum earnings guideline (C criteria) raising fundamental concerns.
>>> FEATURED STOCK ARTICLE : Gain Above 50-Day Moving Average Line Helped Technical Stance - 10/2/2017 |
View all notes |
Set NEW NOTE alert |
Company Profile |
SEC
News |
Chart |
Request a new note
C
A
S
I |
IBP
-
NYSE
Installed Building Prod
DIVERSIFIED SERVICES - Business/Management Services
|
$65.90
|
+0.70
1.07% |
$67.00
|
155,049
96.91% of 50 DAV
50 DAV is 160,000
|
$67.15
-1.86%
|
9/19/2017
|
$59.15
|
PP = $60.10
|
|
MB = $63.11
|
Most Recent Note - 10/5/2017 7:49:35 PM
G - Color code is changed to green after getting extended from its prior base. Prior highs in the $60 area define initial support above its 50 DMA line ($58.19) after the 9/26/17 gain and technical breakout backed by 71% above average volume.
>>> FEATURED STOCK ARTICLE : Found Prompt Support Near Prior Highs and 50 Day Average - 9/13/2017 |
View all notes |
Set NEW NOTE alert |
Company Profile |
SEC
News |
Chart |
Request a new note
C
A
S
I |
NCOM
-
NASDAQ
National Commerce Corp
BANKING - Regional - Southeast Banks
|
$42.95
|
-0.10
-0.23% |
$43.10
|
29,146
76.70% of 50 DAV
50 DAV is 38,000
|
$43.80
-1.94%
|
4/25/2017
|
$38.95
|
PP = $40.09
|
|
MB = $42.09
|
Most Recent Note - 10/3/2017 11:41:02 AM
G - Perched at its 52-week high following to an impressive spurt of volume-driven gains. Recently reported Jun '17 earnings +23% on +45% sales revenues, below the +25% minimum earnings guideline (C criteria), raising fundamental concerns.
>>> FEATURED STOCK ARTICLE : Relative Strength Rating Fell Below 80+ Minimum Guideline - 9/14/2017 |
View all notes |
Set NEW NOTE alert |
Company Profile |
SEC
News |
Chart |
Request a new note
C
A
S
I |
OLLI
-
NASDAQ
Ollie's Bargain Outlet
Retail-DiscountandVariety
|
$45.65
|
-0.95
-2.04% |
$46.60
|
686,552
122.60% of 50 DAV
50 DAV is 560,000
|
$46.90
-2.67%
|
9/8/2017
|
$45.20
|
PP = $46.18
|
|
MB = $48.49
|
Most Recent Note - 10/4/2017 6:33:36 PM
Y - Closed at a best-ever high with today's 2nd consecutive gain backed by light volume. Subsequent gains above the latest pivot point with at least the minimum +40% above average volume may trigger a proper new (or add-on) technical buy signal. Fundamentals remain strong.
>>> FEATURED STOCK ARTICLE : Quietly Hit New Highs Without Great Volume Conviction - 10/3/2017 |
View all notes |
Set NEW NOTE alert |
Company Profile |
SEC
News |
Chart |
Request a new note
C
A
S
I |
Symbol/Exchange
Company Name
Industry Group |
PRICE |
CHANGE
(%Change) |
Day High |
Volume
(% DAV)
(% 50 day avg vol) |
52 Wk Hi
% From Hi |
Featured
Date |
Price
Featured |
Pivot Featured |
|
Max Buy |
HLI
-
NYSE
Houlihan Lokey Inc Cl A
Finance-Invest Bnk/Bkrs
|
$39.41
|
-0.92
-2.28% |
$40.35
|
227,089
100.93% of 50 DAV
50 DAV is 225,000
|
$40.63
-3.00%
|
9/18/2017
|
$37.04
|
PP = $39.78
|
|
MB = $41.77
|
Most Recent Note - 10/4/2017 6:28:47 PM
Y - Hit a new high as it posted a 3rd consecutive gain today with below average volume. Gains above the pivot point must be backed by at least +40% above average volume to trigger a proper new (or add-on) technical buy signal. Subsequent losses below the recent low ($34.41 on 8/18/17) would raise more serious concerns and trigger a technical sell signal.
>>> FEATURED STOCK ARTICLE : Rebounding Toward Prior High and New Pivot Point - 9/27/2017 |
View all notes |
Set NEW NOTE alert |
Company Profile |
SEC
News |
Chart |
Request a new note
C
A
S
I |
|
|
|
THESE ARE NOT BUY RECOMMENDATIONS!
Comments contained in the body of this report are technical
opinions only. The material herein has been obtained
from sources believed to be reliable and accurate, however,
its accuracy and completeness cannot be guaranteed.
This site is not an investment advisor, hence it does
not endorse or recommend any securities or other investments.
Any recommendation contained in this report may not
be suitable for all investors and it is not to be deemed
an offer or solicitation on our part with respect to
the purchase or sale of any securities. All trademarks,
service marks and trade names appearing in this report
are the property of their respective owners, and are
likewise used for identification purposes only.
This report is a service available
only to active Paid Premium Members.
You may opt-out of receiving report notifications
at any time. Questions or comments may be submitted
by writing to Premium Membership Services 665 S.E. 10 Street, Suite 201 Deerfield Beach, FL 33441-5634 or by calling 1-800-965-8307
or 954-785-1121.
|
|
|