Symbol/Exchange
Company Name
Industry Group |
PRICE |
CHANGE
(%Change) |
Day High |
Volume
(% DAV)
(% 50 day avg vol) |
52 Wk Hi
% From Hi |
Featured
Date |
Price
Featured |
Pivot Featured |
|
Max Buy |
MPX
-
NYSE
Marine Products Corp
AUTOMOTIVE - Recreational Vehicles
|
$15.19
|
-0.15
-0.98% |
$15.51
|
30,652
95.79% of 50 DAV
50 DAV is 32,000
|
$17.12
-11.27%
|
9/26/2017
|
$16.30
|
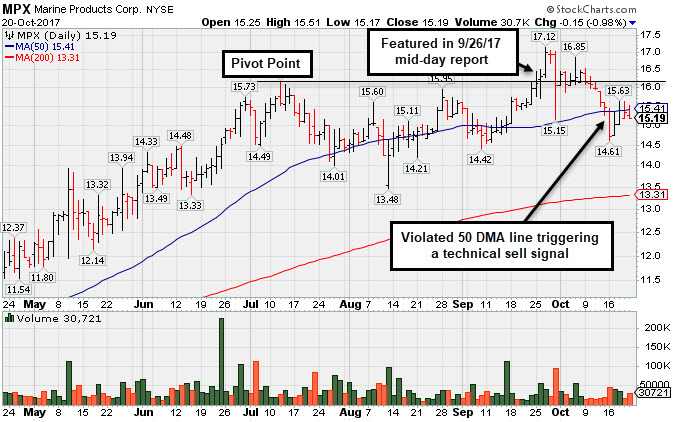
PP = $16.35
|
|
MB = $17.17
|
 Most Recent Note - 10/20/2017 5:41:40 PM
G - Still sputtering below its 50 DMA line ($15.41). Only a prompt rebound above the 50 DMA would help its outlook improve. See the latest FSU analysis for more details and a new annotated graph.
>>> FEATURED STOCK ARTICLE : Violation of 50 Day Moving Average Line Hurt Technical Stance - 10/20/2017 |
View all notes |
Set NEW NOTE alert |
Company Profile |
SEC
News |
Chart |
Request a new note
C
A
S
I |
THO
-
NYSE
Thor Industries Inc
AUTOMOTIVE - Recreational Vehicles
|
$132.10
|
+1.74
1.33% |
$133.29
|
690,811
99.40% of 50 DAV
50 DAV is 695,000
|
$131.34
0.58%
|
8/14/2017
|
$106.67
|
PP = $110.01
|
|
MB = $115.51
|
Most Recent Note - 10/19/2017 3:21:15 PM
G - Volume totals have been cooling in recent weeks, perched at its all-time high after 8 consecutive weekly gains, very extended from the previously noted base. Prior highs in the $115 area define initial support to watch on pullbacks. Fundamentals remain strong.
>>> FEATURED STOCK ARTICLE : Extended From Prior Base With Volume Totals Cooling - 10/13/2017 |
View all notes |
Set NEW NOTE alert |
Company Profile |
SEC
News |
Chart |
Request a new note
C
A
S
I |
PFBC
-
NASDAQ
Preferred Bank Los Angls
BANKING - Regional - Pacific Banks
|
$58.96
|
+0.14
0.24% |
$59.63
|
46,793
73.11% of 50 DAV
50 DAV is 64,000
|
$60.99
-3.33%
|
10/10/2017
|
$59.38
|
PP = $59.08
|
|
MB = $62.03
|
Most Recent Note - 10/17/2017 5:24:05 PM
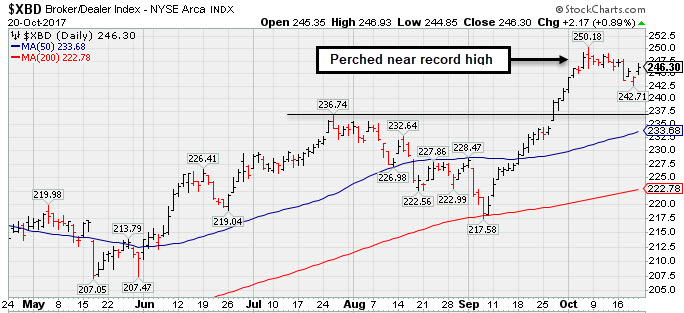
Y - Ended slightly lower with near average volume. It was highlighted in yellow with pivot point cited based on its 7/20/17 high plus 10 cents in the 10/10/17 mid-day report. Hit new 52-week highs, triggering a technical buy signal with considerable volume-driven gains on 9/27 and 9/28. Faces no resistance due to overhead supply. Reported earnings +31% on +26% sales revenues for the Jun '17 quarter, its 3rd consecutive quarterly comparison above the +25% minimum guideline (C criteria). See the latest FSU analysis for more details and an annotated graph.
>>> FEATURED STOCK ARTICLE : Perched Near High Following Volume-Driven Breakout Gains - 10/11/2017 |
View all notes |
Set NEW NOTE alert |
Company Profile |
SEC
News |
Chart |
Request a new note
C
A
S
I |
AVGO
-
NASDAQ
Avago Technologies Ltd
ELECTRONICS - Semiconductor - Broad Line
|
$244.24
|
-0.05
-0.02% |
$247.00
|
2,321,834
90.18% of 50 DAV
50 DAV is 2,574,600
|
$259.36
-5.83%
|
8/24/2017
|
$252.44
|
PP = $256.89
|
|
MB = $269.73
|
Most Recent Note - 10/19/2017 12:25:54 PM
G - Still sputtering below its 50 DMA line ($246.24), and its Relative Strength rating has slumped to 76, below the 80+ minimum guideline for buy candidates. A rebound above that short-term average is needed for its outlook to improve. Subsequent losses below the recent low ($231.53 on 9/25/17) would raise serious concerns and trigger a more worrisome technical sell signal.
>>> FEATURED STOCK ARTICLE : Slumped Below 50-Day Moving Average Line Again - 10/17/2017 |
View all notes |
Set NEW NOTE alert |
Company Profile |
SEC
News |
Chart |
Request a new note
C
A
S
I |
YY
-
NASDAQ
YY Inc Ads
INTERNET - Internet Service Providers
|
$93.12
|
+0.35
0.38% |
$94.05
|
858,881
48.39% of 50 DAV
50 DAV is 1,775,000
|
$97.59
-4.58%
|
9/25/2017
|
$80.26
|
PP = $83.10
|
|
MB = $87.26
|
Most Recent Note - 10/19/2017 5:21:38 PM
G - Extended from its prior base and prior highs in the $83 area defining initial support to watch above its 50 DMA line. See the latest FSU analysis for more details and a new annotated graph.
>>> FEATURED STOCK ARTICLE : Extended After Rallying From Base - 10/19/2017 |
View all notes |
Set NEW NOTE alert |
Company Profile |
SEC
News |
Chart |
Request a new note
C
A
S
I |
Symbol/Exchange
Company Name
Industry Group |
PRICE |
CHANGE
(%Change) |
Day High |
Volume
(% DAV)
(% 50 day avg vol) |
52 Wk Hi
% From Hi |
Featured
Date |
Price
Featured |
Pivot Featured |
|
Max Buy |
STMP
-
NASDAQ
Stamps.com Inc
INTERNET - Internet Software and Services
|
$221.85
|
+2.00
0.91% |
$224.35
|
255,139
78.99% of 50 DAV
50 DAV is 323,000
|
$226.00
-1.84%
|
9/11/2017
|
$193.65
|
PP = $220.35
|
|
MB = $231.37
|
Most Recent Note - 10/19/2017 1:15:28 PM
Y - Faces no resistance, however recent gains have been "wedging" with a lack of great volume conviction indicative of fresh institutional buying demand. Gains above the pivot point must have at least +40% above average volume to trigger a proper new (or add-on) technical buy signal under the fact-based investment system. Its 50 DMA line ($205.79) defines important near-term support above the recent low ($195.05 on 9/28/17) where violations would trigger technical sell signals.
>>> FEATURED STOCK ARTICLE : Perched Near Pivot Point With No Resistance Remaining - 10/4/2017 |
View all notes |
Set NEW NOTE alert |
Company Profile |
SEC
News |
Chart |
Request a new note
C
A
S
I |
HTHT
-
NASDAQ
China Lodging Group Ads
LEISURE - Lodging
|
$134.52
|
+2.15
1.62% |
$138.41
|
462,578
119.84% of 50 DAV
50 DAV is 386,000
|
$138.44
-2.83%
|
9/29/2016
|
$46.12
|
PP = $47.82
|
|
MB = $50.21
|
Most Recent Note - 10/16/2017 4:04:24 PM
G - Rallying today near its record high hit on 10/09/17, very extended from any sound base. Earnings +19% on +18% sales revenues for the Jun '17 quarter were below the +25% minimum earnings guideline (C criteria). Its 50 DMA line ($115.41) defines near-term support.
>>> FEATURED STOCK ARTICLE : Holding Ground Stubbornly After Considerable Rally - 10/5/2017 |
View all notes |
Set NEW NOTE alert |
Company Profile |
SEC
News |
Chart |
Request a new note
C
A
S
I |
LMAT
-
NASDAQ
Lemaitre Vascular Inc
Medical-Products
|
$39.01
|
+0.64
1.65% |
$39.88
|
290,901
172.13% of 50 DAV
50 DAV is 169,000
|
$39.29
-0.72%
|
7/28/2017
|
$33.50
|
PP = $33.32
|
|
MB = $34.99
|
Most Recent Note - 10/20/2017 5:43:37 PM
G - Hit a new high with today's volume-driven gain, but it ended in the lower half of its intra-day range. Found support at its 50 DMA line and prior highs in the $36 area. Violations would raise concerns and trigger technical sell signals. Due to report Sep '17 quarterly earnings on 10/26/17 after the close. See the latest FSU analysis for more details and an annotated graph.
>>> FEATURED STOCK ARTICLE : Consolidating Above 50-Day Moving Average Before Earnings - 10/18/2017 |
View all notes |
Set NEW NOTE alert |
Company Profile |
SEC
News |
Chart |
Request a new note
C
A
S
I |
ESNT
-
NYSE
Essent Group Ltd
Finance-MrtgandRel Svc
|
$44.50
|
+0.02
0.04% |
$45.10
|
779,088
106.58% of 50 DAV
50 DAV is 731,000
|
$44.50
0.00%
|
10/9/2017
|
$39.75
|
PP = $41.54
|
|
MB = $43.62
|
Most Recent Note - 10/16/2017 11:53:53 AM
Y - Hitting new all-time highs with today's 5th consecutive gain on ever-increasing volume. Prior session's volume total was only +22% above average. Members were reminded - "Gains above the pivot point must have at least +40% above average volume to trigger a proper technical buy signal under the fact-based investment system's rules."
>>> FEATURED STOCK ARTICLE : Perched Within Close Striking Distance of Prior High - 9/29/2017 |
View all notes |
Set NEW NOTE alert |
Company Profile |
SEC
News |
Chart |
Request a new note
C
A
S
I |
FIVE
-
NASDAQ
Five Below Inc
Retail-DiscountandVariety
|
$57.49
|
+0.46
0.81% |
$57.65
|
687,664
78.68% of 50 DAV
50 DAV is 874,000
|
$57.65
-0.28%
|
10/6/2017
|
$57.13
|
PP = $54.23
|
|
MB = $56.94
|
Most Recent Note - 10/17/2017 5:13:58 PM
Y - Posted a 3rd consecutive small gain today with below average volume. Prior highs in the $54 area define initial support to watch on pullbacks.
>>> FEATURED STOCK ARTICLE : Finished Strong With Above Average Volume Behind Big Gain - 10/6/2017 |
View all notes |
Set NEW NOTE alert |
Company Profile |
SEC
News |
Chart |
Request a new note
C
A
S
I |
Symbol/Exchange
Company Name
Industry Group |
PRICE |
CHANGE
(%Change) |
Day High |
Volume
(% DAV)
(% 50 day avg vol) |
52 Wk Hi
% From Hi |
Featured
Date |
Price
Featured |
Pivot Featured |
|
Max Buy |
OLED
-
NASDAQ
Universal Display Corp
Elec-Misc Products
|
$134.30
|
-1.65
-1.21% |
$136.75
|
635,511
76.11% of 50 DAV
50 DAV is 835,000
|
$145.30
-7.57%
|
8/31/2017
|
$128.22
|
PP = $127.78
|
|
MB = $134.17
|
Most Recent Note - 10/16/2017 4:27:41 PM
G - Color code is changed to green after a gain with light volume lifted it above its "max buy" level. Its 50 DMA line and recent lows define important near-term support to watch in the $123-124 area.
>>> FEATURED STOCK ARTICLE : Consolidating Near Prior Highs Following Recent Breakout - 9/28/2017 |
View all notes |
Set NEW NOTE alert |
Company Profile |
SEC
News |
Chart |
Request a new note
C
A
S
I |
ANET
-
NYSE
Arista Networks Inc
TELECOMMUNICATIONS - Communication Equipment
|
$191.68
|
+1.55
0.82% |
$192.95
|
320,506
50.16% of 50 DAV
50 DAV is 639,000
|
$196.27
-2.34%
|
8/4/2017
|
$173.31
|
PP = $163.07
|
|
MB = $171.22
|
Most Recent Note - 10/16/2017 4:11:16 PM
G - Pulled back today for a 3rd consecutive small loss on light volume. Still perched near its all-time high, extended from any sound base. Its 50 DMA line ($179.60) and prior highs in the $176 area define important near-term support to watch on pullbacks. Fundamentals remain very strong.
>>> FEATURED STOCK ARTICLE : Perched Near All-Time High, Extended From Any Sound Base - 10/16/2017 |
View all notes |
Set NEW NOTE alert |
Company Profile |
SEC
News |
Chart |
Request a new note
C
A
S
I |
GRUB
-
NYSE
Grubhub Inc
COMPUTER SOFTWARE and SERVICES - Technical and System Software
|
$52.34
|
+0.57
1.10% |
$53.11
|
1,800,770
116.93% of 50 DAV
50 DAV is 1,540,000
|
$57.61
-9.15%
|
6/21/2017
|
$47.33
|
PP = $46.94
|
|
MB = $49.29
|
Most Recent Note - 10/19/2017 3:19:10 PM
G - Recent lows in the $49-50 area define near-term support above prior highs in the $47 area. A rebound above its now downward sloping 50 DMA line ($53.78) is needed for its outlook to improve. Due to report Sep '17 quarterly results before the open on Wednesday, October 25th. Volume and volatility often increase near earnings news. Earnings rose only +13% on +32% sales revenues for the Jun '17 quarter, below the +25% minimum earnings guideline (C criteria).
>>> FEATURED STOCK ARTICLE : Gain Above 50-Day Moving Average Line Helped Technical Stance - 10/2/2017 |
View all notes |
Set NEW NOTE alert |
Company Profile |
SEC
News |
Chart |
Request a new note
C
A
S
I |
IBP
-
NYSE
Installed Building Prod
DIVERSIFIED SERVICES - Business/Management Services
|
$65.80
|
+0.30
0.46% |
$66.30
|
84,452
54.84% of 50 DAV
50 DAV is 154,000
|
$67.15
-2.01%
|
9/19/2017
|
$59.15
|
PP = $60.10
|
|
MB = $63.11
|
Most Recent Note - 10/17/2017 5:18:08 PM
G - Still stubbornly holding its ground, extended from prior highs in the $60 area that define initial support above its 50 DMA line ($59.88).
>>> FEATURED STOCK ARTICLE : Building - Maintenance & Service Firm Extended From Latest Base - 10/9/2017 |
View all notes |
Set NEW NOTE alert |
Company Profile |
SEC
News |
Chart |
Request a new note
C
A
S
I |
NCOM
-
NASDAQ
National Commerce Corp
BANKING - Regional - Southeast Banks
|
$42.75
|
+0.10
0.23% |
$43.10
|
22,952
57.38% of 50 DAV
50 DAV is 40,000
|
$43.80
-2.40%
|
4/25/2017
|
$38.95
|
PP = $40.09
|
|
MB = $42.09
|
Most Recent Note - 10/17/2017 5:25:23 PM
G - Volume totals have been cooling while stubbornly holding its ground near its 52-week high following an impressive spurt of volume-driven gains. Recently reported Jun '17 earnings +23% on +45% sales revenues, below the +25% minimum earnings guideline (C criteria), raising fundamental concerns.
>>> FEATURED STOCK ARTICLE : Holding Ground Following Impressive Volume-Driven Gains - 10/12/2017 |
View all notes |
Set NEW NOTE alert |
Company Profile |
SEC
News |
Chart |
Request a new note
C
A
S
I |
Symbol/Exchange
Company Name
Industry Group |
PRICE |
CHANGE
(%Change) |
Day High |
Volume
(% DAV)
(% 50 day avg vol) |
52 Wk Hi
% From Hi |
Featured
Date |
Price
Featured |
Pivot Featured |
|
Max Buy |
OLLI
-
NASDAQ
Ollie's Bargain Outlet
Retail-DiscountandVariety
|
$45.10
|
+0.70
1.58% |
$45.35
|
348,226
65.58% of 50 DAV
50 DAV is 531,000
|
$46.90
-3.84%
|
9/8/2017
|
$45.20
|
PP = $46.18
|
|
MB = $48.49
|
Most Recent Note - 10/17/2017 5:22:49 PM
Y - Volume totals have been cooling while hovering near its all-time high and above its 50 DMA line ($44.78). Recent gains above the latest pivot point did not meet the minimum +40% above average volume threshold necessary to trigger a proper new (or add-on) technical buy signal. Confirming volume-driven gains would be a reassuring sign of fresh institutional buying demand. Fundamentals remain strong.
>>> FEATURED STOCK ARTICLE : Quietly Hit New Highs Without Great Volume Conviction - 10/3/2017 |
View all notes |
Set NEW NOTE alert |
Company Profile |
SEC
News |
Chart |
Request a new note
C
A
S
I |
HLI
-
NYSE
Houlihan Lokey Inc Cl A
Finance-Invest Bnk/Bkrs
|
$41.56
|
+0.18
0.43% |
$41.78
|
138,378
62.61% of 50 DAV
50 DAV is 221,000
|
$41.48
0.19%
|
9/18/2017
|
$37.04
|
PP = $39.78
|
|
MB = $41.77
|
Most Recent Note - 10/16/2017 4:24:42 PM
Y - Matched its all-time high with today's 4th consecutive small gain lacking great volume conviction. Gains above the pivot point must be backed by at least +40% above average volume to trigger a proper new (or add-on) technical buy signal. Subsequent losses below the recent low ($34.41 on 8/18/17) would raise more serious concerns and trigger a technical sell signal.
>>> FEATURED STOCK ARTICLE : Rebounding Toward Prior High and New Pivot Point - 9/27/2017 |
View all notes |
Set NEW NOTE alert |
Company Profile |
SEC
News |
Chart |
Request a new note
C
A
S
I |
ICHR
-
NASDAQ
Ichor Holdings Ltd
ELECTRONICS - Semiconductor Equipment
|
$33.86
|
+0.52
1.56% |
$35.51
|
883,003
128.53% of 50 DAV
50 DAV is 687,000
|
$34.70
-2.42%
|
10/10/2017
|
$29.39
|
PP = $28.36
|
|
MB = $29.78
|
Most Recent Note - 10/19/2017 12:48:39 PM
G - Prior highs in the $29 area define initial support to watch on pullbacks. Very extended from its prior base after a streak of gains.
>>> FEATURED STOCK ARTICLE : Semiconductor Equipment Firm Finished Strong After Highlighted - 10/10/2017 |
View all notes |
Set NEW NOTE alert |
Company Profile |
SEC
News |
Chart |
Request a new note
C
A
S
I |