You are not logged in.
This means you
CAN ONLY VIEW reports that were published prior to Thursday, March 20, 2025.
You
MUST UPGRADE YOUR MEMBERSHIP if you want to see any current reports.
AFTER MARKET UPDATE - WEDNESDAY, OCTOBER 4TH, 2017
Previous After Market Report Next After Market Report >>>
|
|
|
|
DOW |
+19.97 |
22,661.64 |
+0.09% |
|
Volume |
735,773,170 |
+2% |
|
Volume |
1,942,946,610 |
-2% |
|
NASDAQ |
+2.92 |
6,534.63 |
+0.04% |
|
Advancers |
1,406 |
49% |
|
Advancers |
1,330 |
51% |
|
S&P 500 |
+3.16 |
2,537.74 |
+0.12% |
|
Decliners |
1,468 |
51% |
|
Decliners |
1,302 |
49% |
|
Russell 2000 |
-4.20 |
1,507.76 |
-0.28% |
|
52 Wk Highs |
232 |
|
|
52 Wk Highs |
292 |
|
|
S&P 600 |
-3.86 |
914.86 |
-0.42% |
|
52 Wk Lows |
10 |
|
|
52 Wk Lows |
20 |
|
|
 |
Major Averages Continue Rally Into New High Territory
Kenneth J. Gruneisen - Passed the CAN SLIM® Master's Exam
Stocks finished slightly higher on Wednesday. The Dow was up 19 points to 22661. The S&P 500 added 3 points to 2537. The Nasdaq Composite gained 2 points to 6534. Volume totals reported were mixed, higher than the prior session total on the NYSE and lighter on the Nasdaq exchange. Advancers and decliners were evenly mixed on the NYSE and on the Nasdaq exchange. There were 102 high-ranked companies from the Leaders List that made new 52-week highs and were listed on the BreakOuts Page, versus the total of 132 on the prior session. New 52-week highs totals solidly outnumbered new 52-week lows totals on the Nasdaq exchange and on the NYSE. The Featured Stocks Page provides the latest analysis on noteworthy high-ranked leaders. Charts used courtesy of www.stockcharts.com
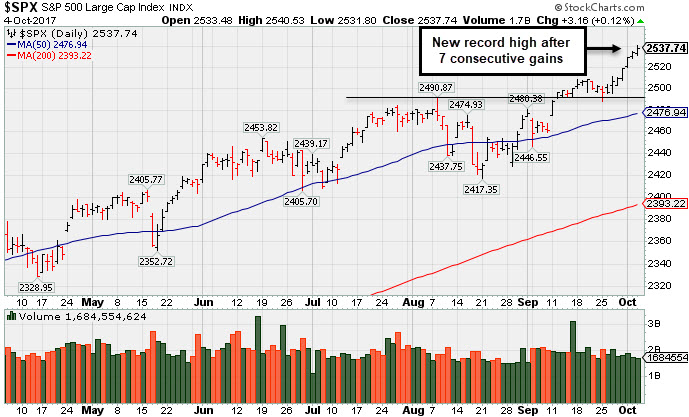 PICTURED: The S&P 500 Index hit a new record high with a 7th consecutive gain. During the recent consolidation it found support above the prior low after undercutting its 50-day moving average (DMA) line.
The major averages' (M criteria) are in a confirmed uptrend. Leadership has remained healthy. Investors should buy stocks meeting all key criteria of the fact-based investment system on a case-by-case basis as they trigger technical buy signals.
The S&P 500 extended its winning streak to seven sessions as investors digested economic releases. An update from the Institute for Supply Management on the services sector jumped to 59.8 in September, its highest level since 2005 and well above last month’s 55.3 reading. In a separate release, ADP reported private payrolls increased 135,000 in September, the lowest figure in eleven months. In political proceedings, Puerto Rican bonds tumbled after President Trump mentioned the possibility of “wiping out” the territory’s debt.
Six of 11 S&P 500 sectors advanced with Consumer Discretionary and Utilities shares outperforming while Financials lagged. Netflix (NFLX +2.94%) was a notable advancer, climbing after being the subject of positive analyst commentary. Mylan (MYL +16.20%) rallied after the drugmaker received FDA approval on a generic drug for multiple sclerosis. In earnings news, PepsiCo (PEP +0.19%) overcame early weakness and ended slightly higher despite reporting weaker-than-expected quarterly sales.
Treasuries were basically unchanged with the yield on the benchmark 10-year note finishing flat at 2.33%. In commodities, NYMEX WTI crude slipped 1.1% to $49.85/barrel as U.S. gasoline inventories climbed more than expected last week. COMEX gold added 0.2% to $1273.70/ounce while the dollar slipped modestly against the yen and euro. |
 Kenneth J. Gruneisen started out as a licensed stockbroker in August 1987, a couple of months prior to the historic stock market crash that took the Dow Jones Industrial Average down -22.6% in a single day. He has published daily fact-based fundamental and technical analysis on high-ranked stocks online for two decades. Through FACTBASEDINVESTING.COM, Kenneth provides educational articles, news, market commentary, and other information regarding proven investment systems that work in good times and bad.
Comments contained in the body of this report are technical opinions only and are not necessarily those of Gruneisen Growth Corp. The material herein has been obtained from sources believed to be reliable and accurate, however, its accuracy and completeness cannot be guaranteed. Our firm, employees, and customers may effect transactions, including transactions contrary to any recommendation herein, or have positions in the securities mentioned herein or options with respect thereto. Any recommendation contained in this report may not be suitable for all investors and it is not to be deemed an offer or solicitation on our part with respect to the purchase or sale of any securities. |
|
 |
Gold & Silver, Retail, Biotech and Semiconductor Indexes Rose
Kenneth J. Gruneisen - Passed the CAN SLIM® Master's Exam
On Wednesday the Broker/Dealer Index ($XBD -0.18%) and the Bank Index ($BKX -0.58%) finished slightly lower while the Retail Index ($RLX +0.55%) posted a modest gain. The tech sector was mixed as the Networking Index ($NWX -0.25%) edged lower and the Semiconductor Index ($SOX +0.24%) and the Biotechnology Index ($BTK +0.49%) rose. The Gold & Silver Index ($XAU +0.61%) rose while the Integrated Oil Index ($XOI -0.06%) and the Oil Services Index ($OSX -0.02%) both ended virtually unchanged. Charts courtesy www.stockcharts.com
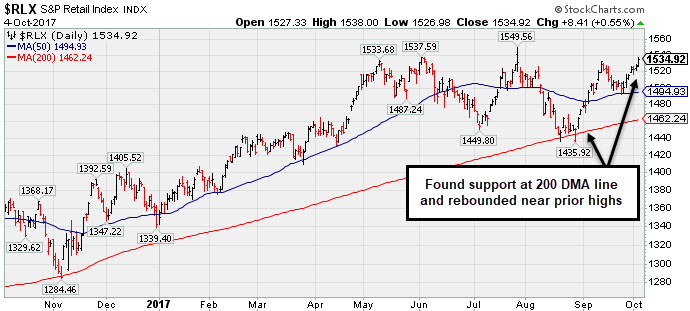 PICTURED: The Retail Index ($RLX +0.55%) has rallied well above its 200-day moving average (DMA) line, rebounding from August lows.
| Oil Services |
$OSX |
138.95 |
-0.02 |
-0.01% |
-24.40% |
| Integrated Oil |
$XOI |
1,218.04 |
-0.78 |
-0.06% |
-3.94% |
| Semiconductor |
$SOX |
1,185.24 |
+2.81 |
+0.24% |
+30.75% |
| Networking |
$NWX |
471.93 |
-1.19 |
-0.25% |
+5.79% |
| Broker/Dealer |
$XBD |
245.63 |
-0.45 |
-0.18% |
+19.66% |
| Retail |
$RLX |
1,534.92 |
+8.41 |
+0.55% |
+14.29% |
| Gold & Silver |
$XAU |
86.50 |
+0.52 |
+0.60% |
+9.69% |
| Bank |
$BKX |
99.23 |
-0.58 |
-0.58% |
+8.11% |
| Biotech |
$BTK |
4,296.94 |
+20.83 |
+0.49% |
+39.74% |
|
|
|
 |
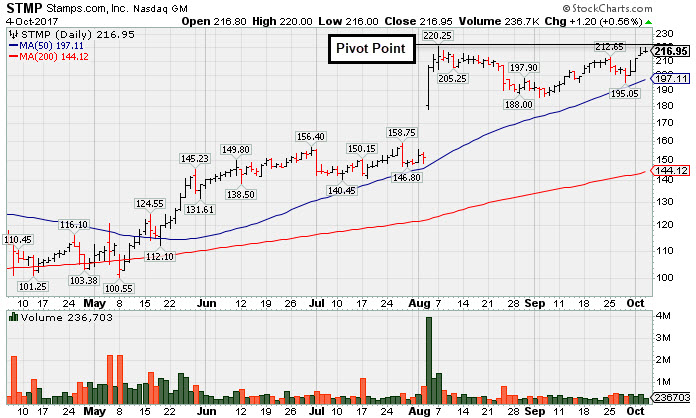
Perched Near Pivot Point With No Resistance Remaining
Kenneth J. Gruneisen - Passed the CAN SLIM® Master's Exam
Stamps.Com Inc (STMP +$1.20 or +0.56% to $216.95) posted a 4th consecutive gain today with light volume, rising toward the new pivot point cited based on its 8/07/17 high plus 10 cents. It faces very little near-term resistance. Subsequent volume-driven gains above the pivot point are needed to trigger a new (or add-on) technical buy signal. The recent low ($185.80 on 9/05/17) and its 50-day moving average (DMA) line ($197) define important near-term support where violations would trigger technical sell signals.
There was a considerable gap higher on 8/03/17 following strong earnings news as it reported Jun '17 quarterly earnings +61% on +38% sales revenues. Bullish action has continued since last shown in this FSU section with an annotated graph on 9/11/17 under the headline, "New Base Being Built After Considerable Gap Higher".
Fundamentals remain strong. It has earned an Earnings Per Share Rating of 99, putting it in the top 1% of all publicly traded stocks based on its earnings history over the past 5 years. Currently it has a Timeliness Rating of A and a Sponsorship rating of B.
The Retail - Internet group has a 90 Relative Strength Rating. The number of top-rated funds owning its shares rose from 354 in Dec '16 to 399 in Jun '17, a reassuring sign in recent months concerning the I criteria. Its current Up/Down Volume ratio of 2.1 is an unbiased indication its shares have been under accumulation over the past 50 days. Its small supply of only 16.9 million shares outstanding (S criteria) can contribute to greater price volatility in the event of institutional buying or selling. |
|
|
Color Codes Explained :
Y - Better candidates highlighted by our
staff of experts.
G - Previously featured
in past reports as yellow but may no longer be buyable under the
guidelines.
***Last / Change / Volume data in this table is the closing quote data***
Symbol/Exchange
Company Name
Industry Group |
PRICE |
CHANGE
(%Change) |
Day High |
Volume
(% DAV)
(% 50 day avg vol) |
52 Wk Hi
% From Hi |
Featured
Date |
Price
Featured |
Pivot Featured |
|
Max Buy |
MPX
-
NYSE
Marine Products Corp
AUTOMOTIVE - Recreational Vehicles
|
$16.19
|
+0.10
0.62% |
$16.40
|
17,254
47.93% of 50 DAV
50 DAV is 36,000
|
$17.12
-5.43%
|
9/26/2017
|
$16.30
|
PP = $16.35
|
|
MB = $17.17
|
Most Recent Note - 9/29/2017 12:53:13 PM
Y - Encountered damaging distributional pressure with a big loss today on higher volume. Members were cautioned in the prior note 5:19PM 9/27/17 - "Hit yet another new high with today's 6th consecutive gain, however, volume was only +13% above average, not indicative of heavy institutional buying demand. It was highlighted in yellow with pivot point cited based on its 7/12/17 high plus 10 cents in the 9/26/17 mid-day report. Gains above the pivot point must be backed by at least +40% above average volume to clinch a convincing technical buy signal. See the latest FSU analysis for more details and an annotated graph."
>>> FEATURED STOCK ARTICLE : Powerboat Maker Hit Another New 52-Week High - 9/26/2017 |
View all notes |
Set NEW NOTE alert |
Company Profile |
SEC
News |
Chart |
Request a new note
C
A
S
I |
THO
-
NYSE
Thor Industries Inc
AUTOMOTIVE - Recreational Vehicles
|
$125.92
|
-2.18
-1.70% |
$127.81
|
1,070,848
163.74% of 50 DAV
50 DAV is 654,000
|
$129.71
-2.92%
|
8/14/2017
|
$106.67
|
PP = $110.01
|
|
MB = $115.51
|
Most Recent Note - 10/2/2017 9:33:58 PM
G - Hit yet another new 52-week high with today's 6th consecutive volume-driven gain, getting more extended from the previously noted base. Prior highs in the $115 area define initial support to watch on pullbacks. Fundamentals remain strong.
>>> FEATURED STOCK ARTICLE : Wedged to New High Then Ended the Session Weak - 9/18/2017 |
View all notes |
Set NEW NOTE alert |
Company Profile |
SEC
News |
Chart |
Request a new note
C
A
S
I |
AVGO
-
NASDAQ
Broadcom Limited
ELECTRONICS - Semiconductor - Broad Line
|
$242.00
|
+2.50
1.04% |
$242.33
|
2,319,168
88.32% of 50 DAV
50 DAV is 2,626,000
|
$259.36
-6.69%
|
8/24/2017
|
$252.44
|
PP = $256.89
|
|
MB = $269.73
|
Most Recent Note - 10/3/2017 8:52:01 PM
G - A rebound above the 50 DMA line ($247.59) is needed for its outlook to improve. More damaging losses below the recent low ($231.53 on 9/25/17) would raise serious concerns and trigger a more worrisome technical sell signal.
>>> FEATURED STOCK ARTICLE : Technical Deterioration Raises Concerns - 9/21/2017 |
View all notes |
Set NEW NOTE alert |
Company Profile |
SEC
News |
Chart |
Request a new note
C
A
S
I |
YY
-
NASDAQ
YY Inc Ads
INTERNET - Internet Service Providers
|
$88.77
|
-1.55
-1.72% |
$90.56
|
1,747,121
97.44% of 50 DAV
50 DAV is 1,793,000
|
$94.00
-5.56%
|
9/25/2017
|
$80.26
|
PP = $83.10
|
|
MB = $87.26
|
Most Recent Note - 10/3/2017 11:45:17 AM
G - Hit another new 52-week high today, getting more extended from its prior base. Recent gains above the pivot point triggered a technical buy signal. Prior highs in the $83 area define initial support to watch on pullbacks.
>>> FEATURED STOCK ARTICLE : Encountered Distributional Pressure When Challenging Prior HIgh - 9/25/2017 |
View all notes |
Set NEW NOTE alert |
Company Profile |
SEC
News |
Chart |
Request a new note
C
A
S
I |
STMP
-
NASDAQ
Stamps.com Inc
INTERNET - Internet Software and Services
|
$216.95
|
+1.20
0.56% |
$220.00
|
235,903
51.51% of 50 DAV
50 DAV is 458,000
|
$220.25
-1.50%
|
9/11/2017
|
$193.65
|
PP = $220.35
|
|
MB = $231.37
|
 Most Recent Note - 10/4/2017 6:34:57 PM
Y - Posted a 4th consecutive gain today with light volume, rising near the new pivot point cited based on its 8/07/17 high plus 10 cents. Faces little near-term resistance. Subsequent volume-driven gains above the pivot point are needed to trigger a new (or add-on) technical buy signal. Recent low ($185.80 on 9/05/17) and its 50 DMA line ($197) define important near-term support where violations would trigger technical sell signals. See the latest FSU analysis for more details and a new annotated graph.
>>> FEATURED STOCK ARTICLE : Perched Near Pivot Point With No Resistance Remaining - 10/4/2017 |
View all notes |
Set NEW NOTE alert |
Company Profile |
SEC
News |
Chart |
Request a new note
C
A
S
I |
Symbol/Exchange
Company Name
Industry Group |
PRICE |
CHANGE
(%Change) |
Day High |
Volume
(% DAV)
(% 50 day avg vol) |
52 Wk Hi
% From Hi |
Featured
Date |
Price
Featured |
Pivot Featured |
|
Max Buy |
HTHT
-
NASDAQ
China Lodging Group Ads
LEISURE - Lodging
|
$121.87
|
-0.30
-0.25% |
$123.10
|
177,363
49.54% of 50 DAV
50 DAV is 358,000
|
$126.29
-3.50%
|
9/29/2016
|
$46.12
|
PP = $47.82
|
|
MB = $50.21
|
Most Recent Note - 10/3/2017 8:54:23 PM
G - Holding its ground near its all-time high , still very extended from any sound base. Recently reported earnings +19% on +18% sales revenues for the Jun '17 quarter, below the +25% minimum earnings guideline (C criteria). Its 50 DMA line ($109.80) defines near-term support.
>>> FEATURED STOCK ARTICLE : Considerable Rally However Fundamental Concerns Were Raised - 9/12/2017 |
View all notes |
Set NEW NOTE alert |
Company Profile |
SEC
News |
Chart |
Request a new note
C
A
S
I |
LMAT
-
NASDAQ
Lemaitre Vascular Inc
Medical-Products
|
$38.16
|
+0.99
2.66% |
$38.27
|
158,897
73.56% of 50 DAV
50 DAV is 216,000
|
$39.29
-2.88%
|
7/28/2017
|
$33.50
|
PP = $33.32
|
|
MB = $34.99
|
Most Recent Note - 10/4/2017 6:30:02 PM
G - Posted a gain today on lighter than average volume. The 50 DMA line ($35.70) defines near-term support to watch above prior highs in the $33 area.
>>> FEATURED STOCK ARTICLE : Quietly Pulling Back From High After More Volume-Driven Gains - 9/22/2017 |
View all notes |
Set NEW NOTE alert |
Company Profile |
SEC
News |
Chart |
Request a new note
C
A
S
I |
ESNT
-
NYSE
Essent Group Ltd
Finance-MrtgandRel Svc
|
$39.92
|
-0.62
-1.53% |
$40.70
|
900,169
123.48% of 50 DAV
50 DAV is 729,000
|
$41.44
-3.67%
|
7/3/2017
|
$38.05
|
PP = $39.60
|
|
MB = $41.58
|
Most Recent Note - 9/29/2017 6:36:07 PM
Y - Consolidating above its 50 DMA line with very little resistance remaining due to overhead supply. See the latest FSU analysis for more details for a new annotated graph.
>>> FEATURED STOCK ARTICLE : Perched Within Close Striking Distance of Prior High - 9/29/2017 |
View all notes |
Set NEW NOTE alert |
Company Profile |
SEC
News |
Chart |
Request a new note
C
A
S
I |
OLED
-
NASDAQ
Universal Display Corp
Elec-Misc Products
|
$128.30
|
-0.40
-0.31% |
$128.40
|
670,915
76.50% of 50 DAV
50 DAV is 877,000
|
$145.30
-11.70%
|
8/31/2017
|
$128.22
|
PP = $127.78
|
|
MB = $134.17
|
Most Recent Note - 9/28/2017 6:00:43 PM
Y - Holding its ground after pulling back near prior highs in the $127-130 area. Its 50 DMA line ($122.36) defines the next important support to watch. See the latest FSU analysis for more details and a new annotated graph
>>> FEATURED STOCK ARTICLE : Consolidating Near Prior Highs Following Recent Breakout - 9/28/2017 |
View all notes |
Set NEW NOTE alert |
Company Profile |
SEC
News |
Chart |
Request a new note
C
A
S
I |
ANET
-
NYSE
Arista Networks Inc
TELECOMMUNICATIONS - Communication Equipment
|
$190.68
|
+1.26
0.67% |
$191.03
|
390,558
46.06% of 50 DAV
50 DAV is 848,000
|
$193.24
-1.32%
|
8/4/2017
|
$173.31
|
PP = $163.07
|
|
MB = $171.22
|
Most Recent Note - 10/3/2017 8:44:52 PM
G - Hovering near its all-time high. extended from any sound base. Its 50 DMA line ($172.60) defines important near-term support to watch. Fundamentals remain very strong.
>>> FEATURED STOCK ARTICLE : Extended From Any Sound Base After Additional Volume-Driven Gains - 9/19/2017 |
View all notes |
Set NEW NOTE alert |
Company Profile |
SEC
News |
Chart |
Request a new note
C
A
S
I |
Symbol/Exchange
Company Name
Industry Group |
PRICE |
CHANGE
(%Change) |
Day High |
Volume
(% DAV)
(% 50 day avg vol) |
52 Wk Hi
% From Hi |
Featured
Date |
Price
Featured |
Pivot Featured |
|
Max Buy |
GRUB
-
NYSE
Grubhub Inc
COMPUTER SOFTWARE and SERVICES - Technical and System Software
|
$54.10
|
-0.13
-0.24% |
$54.34
|
803,761
41.03% of 50 DAV
50 DAV is 1,959,000
|
$57.61
-6.09%
|
6/21/2017
|
$47.33
|
PP = $46.94
|
|
MB = $49.29
|
Most Recent Note - 10/2/2017 9:28:37 PM
G - Posted a gain today with near average volume, rebounding above its 50 DMA line, helping its outlook to improve. More damaging losses below the recent low ($49.60 on 9/22/17) would raise greater concerns. The next near-term support is prior highs in the $47 area. Recently reported earnings +13% on +32% sales revenues for the Jun '17 quarter, below the +25% minimum earnings guideline (C criteria) raising fundamental concerns. See the latest FSU analysis for more details and a new annotated graph.
>>> FEATURED STOCK ARTICLE : Gain Above 50-Day Moving Average Line Helped Technical Stance - 10/2/2017 |
View all notes |
Set NEW NOTE alert |
Company Profile |
SEC
News |
Chart |
Request a new note
C
A
S
I |
IBP
-
NYSE
Installed Building Prod
DIVERSIFIED SERVICES - Business/Management Services
|
$65.00
|
-1.95
-2.91% |
$67.15
|
160,658
102.33% of 50 DAV
50 DAV is 157,000
|
$67.00
-2.99%
|
9/19/2017
|
$59.15
|
PP = $60.10
|
|
MB = $63.11
|
Most Recent Note - 9/28/2017 12:34:39 PM
Y - There was a "negative reversal" after early gains into new high territory today following 2 consecutive volume-driven gains. Color code is changed to yellow after retreating below its "max buy" level. Prior highs in the $60 area define initial support after the technical breakout this week.
>>> FEATURED STOCK ARTICLE : Found Prompt Support Near Prior Highs and 50 Day Average - 9/13/2017 |
View all notes |
Set NEW NOTE alert |
Company Profile |
SEC
News |
Chart |
Request a new note
C
A
S
I |
NCOM
-
NASDAQ
National Commerce Corp
BANKING - Regional - Southeast Banks
|
$42.55
|
-1.20
-2.74% |
$43.70
|
34,994
92.09% of 50 DAV
50 DAV is 38,000
|
$43.80
-2.85%
|
4/25/2017
|
$38.95
|
PP = $40.09
|
|
MB = $42.09
|
Most Recent Note - 10/3/2017 11:41:02 AM
G - Perched at its 52-week high following to an impressive spurt of volume-driven gains. Recently reported Jun '17 earnings +23% on +45% sales revenues, below the +25% minimum earnings guideline (C criteria), raising fundamental concerns.
>>> FEATURED STOCK ARTICLE : Relative Strength Rating Fell Below 80+ Minimum Guideline - 9/14/2017 |
View all notes |
Set NEW NOTE alert |
Company Profile |
SEC
News |
Chart |
Request a new note
C
A
S
I |
OLLI
-
NASDAQ
Ollie's Bargain Outlet
Retail-DiscountandVariety
|
$46.75
|
+0.45
0.97% |
$46.75
|
292,906
51.84% of 50 DAV
50 DAV is 565,000
|
$46.82
-0.15%
|
9/8/2017
|
$45.20
|
PP = $46.18
|
|
MB = $48.49
|
Most Recent Note - 10/4/2017 6:33:36 PM
Y - Closed at a best-ever high with today's 2nd consecutive gain backed by light volume. Subsequent gains above the latest pivot point with at least the minimum +40% above average volume may trigger a proper new (or add-on) technical buy signal. Fundamentals remain strong.
>>> FEATURED STOCK ARTICLE : Quietly Hit New Highs Without Great Volume Conviction - 10/3/2017 |
View all notes |
Set NEW NOTE alert |
Company Profile |
SEC
News |
Chart |
Request a new note
C
A
S
I |
HLI
-
NYSE
Houlihan Lokey Inc Cl A
Finance-Invest Bnk/Bkrs
|
$40.23
|
+0.17
0.42% |
$40.50
|
129,613
55.63% of 50 DAV
50 DAV is 233,000
|
$40.21
0.05%
|
9/18/2017
|
$37.04
|
PP = $39.78
|
|
MB = $41.77
|
Most Recent Note - 10/4/2017 6:28:47 PM
Y - Hit a new high as it posted a 3rd consecutive gain today with below average volume. Gains above the pivot point must be backed by at least +40% above average volume to trigger a proper new (or add-on) technical buy signal. Subsequent losses below the recent low ($34.41 on 8/18/17) would raise more serious concerns and trigger a technical sell signal.
>>> FEATURED STOCK ARTICLE : Rebounding Toward Prior High and New Pivot Point - 9/27/2017 |
View all notes |
Set NEW NOTE alert |
Company Profile |
SEC
News |
Chart |
Request a new note
C
A
S
I |
Symbol/Exchange
Company Name
Industry Group |
PRICE |
CHANGE
(%Change) |
Day High |
Volume
(% DAV)
(% 50 day avg vol) |
52 Wk Hi
% From Hi |
Featured
Date |
Price
Featured |
Pivot Featured |
|
Max Buy |
|
|
|
THESE ARE NOT BUY RECOMMENDATIONS!
Comments contained in the body of this report are technical
opinions only. The material herein has been obtained
from sources believed to be reliable and accurate, however,
its accuracy and completeness cannot be guaranteed.
This site is not an investment advisor, hence it does
not endorse or recommend any securities or other investments.
Any recommendation contained in this report may not
be suitable for all investors and it is not to be deemed
an offer or solicitation on our part with respect to
the purchase or sale of any securities. All trademarks,
service marks and trade names appearing in this report
are the property of their respective owners, and are
likewise used for identification purposes only.
This report is a service available
only to active Paid Premium Members.
You may opt-out of receiving report notifications
at any time. Questions or comments may be submitted
by writing to Premium Membership Services 665 S.E. 10 Street, Suite 201 Deerfield Beach, FL 33441-5634 or by calling 1-800-965-8307
or 954-785-1121.
|
|
|