You are not logged in.
This means you
CAN ONLY VIEW reports that were published prior to Thursday, March 20, 2025.
You
MUST UPGRADE YOUR MEMBERSHIP if you want to see any current reports.
AFTER MARKET UPDATE - THURSDAY, OCTOBER 12TH, 2017
Previous After Market Report Next After Market Report >>>
|
|
|
|
DOW |
-31.88 |
22,841.01 |
-0.14% |
|
Volume |
787,833,700 |
+6% |
|
Volume |
2,009,776,285 |
+10% |
|
NASDAQ |
-12.04 |
6,591.51 |
-0.18% |
|
Advancers |
1,573 |
54% |
|
Advancers |
1,148 |
41% |
|
S&P 500 |
-4.31 |
2,550.93 |
-0.17% |
|
Decliners |
1,328 |
46% |
|
Decliners |
1,644 |
59% |
|
Russell 2000 |
-1.76 |
1,505.16 |
-0.12% |
|
52 Wk Highs |
218 |
|
|
52 Wk Highs |
223 |
|
|
S&P 600 |
-1.11 |
909.43 |
-0.12% |
|
52 Wk Lows |
31 |
|
|
52 Wk Lows |
40 |
|
|
 |
Losses Small as Indices Pull Back From Record Highs
Kenneth J. Gruneisen - Passed the CAN SLIM® Master's Exam
Stocks finished lower Thursday. The Dow was down 31 points to 22841. The S&P 500 lost 4 points to 2550. The Nasdaq Composite dropped 12 points to 6591. Volume totals reported were higher than the prior session totals on the NYSE and on the Nasdaq exchange. Advancers led decliners by an 8-7 margin on the NYSE, but decliners led advancers by 4-3 on the Nasdaq exchange. There were 90 high-ranked companies from the Leaders List that made new 52-week highs and were listed on the BreakOuts Page, versus the total of 87 on the prior session. New 52-week highs totals solidly outnumbered new 52-week lows totals on the Nasdaq exchange and on the NYSE. The Featured Stocks Page provides the latest analysis on noteworthy high-ranked leaders. Charts used courtesy of www.stockcharts.com
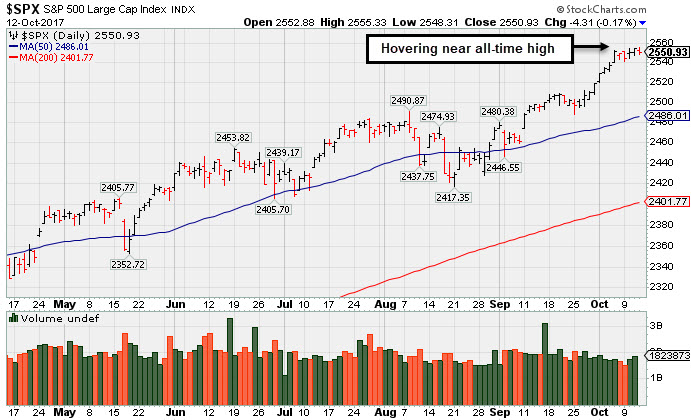 PICTURED: The S&P 500 Index is hovering near its record high.
The major averages' (M criteria) are in a confirmed uptrend. Leadership has remained healthy. Investors should buy stocks meeting all key criteria of the fact-based investment system on a case-by-case basis as they trigger technical buy signals.
The major averages fell from record highs as investors digested several economic updates and earnings reports from big banks. On the data front, a release today revealed core producer prices rose 0.4% in September, topping analyst projections of a 0.2% increase. In a separate release, initial jobless claims fell to 243,000 last week, below consensus estimates of 250,000.
Six of 11 S&P 500 sectors were higher with Consumer Staples and Industrials outperforming and Telecom lagging. ConAgra (CAG +2.37%) and Fastenal (FAST +3.22%) rose on positive analyst commentary surrounding both companies. AT&T (T -6.10%) fell after revealing its third-quarter results were negatively impacted by the recent natural disasters. In earnings news, Citigroup (C -3.43%) despite posting quarterly results above consensus expectations. J.P. Morgan (JPM -0.88%) after the bank posted earnings ahead of analyst estimates but revealed fixed income trading revenue tumbled 27% from the same point last year.
Treasuries were slightly higher with the yield on the benchmark 10-year note down one basis point to 2.32%. In commodities, NYMEX WTI crude declined 1.3% to $50.64/barrel. COMEX Gold was up 0.6% to $1293.30. In FOREX trading the U.S. dollar index gained 0.1% against its peers. |
 Kenneth J. Gruneisen started out as a licensed stockbroker in August 1987, a couple of months prior to the historic stock market crash that took the Dow Jones Industrial Average down -22.6% in a single day. He has published daily fact-based fundamental and technical analysis on high-ranked stocks online for two decades. Through FACTBASEDINVESTING.COM, Kenneth provides educational articles, news, market commentary, and other information regarding proven investment systems that work in good times and bad.
Comments contained in the body of this report are technical opinions only and are not necessarily those of Gruneisen Growth Corp. The material herein has been obtained from sources believed to be reliable and accurate, however, its accuracy and completeness cannot be guaranteed. Our firm, employees, and customers may effect transactions, including transactions contrary to any recommendation herein, or have positions in the securities mentioned herein or options with respect thereto. Any recommendation contained in this report may not be suitable for all investors and it is not to be deemed an offer or solicitation on our part with respect to the purchase or sale of any securities. |
|
 |
Financial, Tech, and Energy-Linked Groups Fell
Kenneth J. Gruneisen - Passed the CAN SLIM® Master's Exam
On Thursday the Bank Index ($BKX -1.05%)outpaced the Broker/Dealer Index ($XBD -0.42%) to the downside while the Retail Index ($RLX -0.07%) essentially held its ground. The tech sector had a slightly negative bias as the Semiconductor Index ($SOX -0.34%), Networking Index ($NWX -0.52%), and the Biotechnology Index ($BTK -0.14%) ended unanimously in the red. The Gold & Silver Index ($XAU -0.02%) finished flat while the Integrated Oil Index ($XOI -0.33%) and the Oil Services Index ($OSX -1.34%) ended the day lower. Charts courtesy www.stockcharts.com
 PICTURED: The Oil Services Index ($OSX -1.34%) is consolidating after rebounding from multi-year lows hit in August.
| Oil Services |
$OSX |
136.95 |
-1.86 |
-1.34% |
-25.49% |
| Integrated Oil |
$XOI |
1,217.86 |
-3.98 |
-0.33% |
-3.95% |
| Semiconductor |
$SOX |
1,211.10 |
-4.09 |
-0.34% |
+33.61% |
| Networking |
$NWX |
465.38 |
-2.45 |
-0.52% |
+4.32% |
| Broker/Dealer |
$XBD |
247.35 |
-1.04 |
-0.42% |
+20.49% |
| Retail |
$RLX |
1,552.36 |
-1.14 |
-0.07% |
+15.59% |
| Gold & Silver |
$XAU |
87.12 |
-0.02 |
-0.02% |
+10.47% |
| Bank |
$BKX |
99.36 |
-1.06 |
-1.06% |
+8.25% |
| Biotech |
$BTK |
4,269.74 |
-5.97 |
-0.14% |
+38.85% |
|
|
|
 |
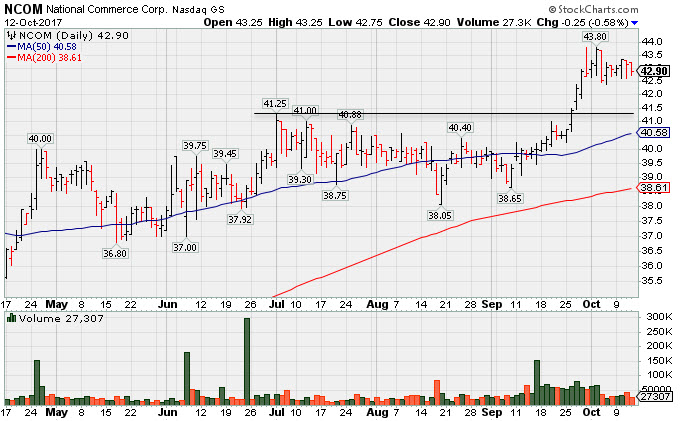
Holding Ground Following Impressive Volume-Driven Gains
Kenneth J. Gruneisen - Passed the CAN SLIM® Master's Exam
National Commerce Corp (NCOM -$0.30 or -0.70% to $42.85) has been stubbornly holding its ground at its 52-week high following an impressive spurt of volume-driven gains. Prior highs and its 50-day moving average (DMA) line ($40.58) define near-term support to watch on pullbacks. Its Relative Strength rating is currently 82, above the minimum guideline for buy candidates.
Recently it reported Jun '17 earnings +23% on +45% sales revenues, below the +25% minimum earnings guideline (C criteria), raising fundamental concerns while ending its streak of 9 consecutive quarterly comparisons with earnings increasing above the +25% minimum guideline (C criteria). Still, it has a very high 98 Earnings Per Share Rating.
NCOM showed bullish action since last shown in this FSU section on 9/14/17 with an annotated graph under the headline, "Relative Strength Rating Fell Below 80+ Minimum Guideline". It was first highlighted in yellow in the 4/25/17 mid-day report with new pivot point cited based on its 1/27/17 high plus 10 cents (read here). Currently, it has a Timeliness rating of A and a Sponsorship rating of A. The number of top-rated funds owning its shares rose from 94 in Jun '16 to 162 in Jun'17, a reassuring sign concerning the I criteria. Its current Up/Down Volume Ratio of 1.6 is an unbiased indication its shares have been under accumulation over the past 50 days. Its small supply of only 11.3 million shares (S criteria) in the public float can contribute to greater price volatility in the event of institutional buying or selling. The Bank holding company's annual earnings (A criteria) history has been strong. It is up from its $20 IPO on 3/19/15. |
|
|
Color Codes Explained :
Y - Better candidates highlighted by our
staff of experts.
G - Previously featured
in past reports as yellow but may no longer be buyable under the
guidelines.
***Last / Change / Volume data in this table is the closing quote data***
Symbol/Exchange
Company Name
Industry Group |
PRICE |
CHANGE
(%Change) |
Day High |
Volume
(% DAV)
(% 50 day avg vol) |
52 Wk Hi
% From Hi |
Featured
Date |
Price
Featured |
Pivot Featured |
|
Max Buy |
MPX
-
NYSE
Marine Products Corp
AUTOMOTIVE - Recreational Vehicles
|
$15.60
|
-0.39
-2.44% |
$15.90
|
17,802
53.95% of 50 DAV
50 DAV is 33,000
|
$17.12
-8.88%
|
9/26/2017
|
$16.30
|
PP = $16.35
|
|
MB = $17.17
|
Most Recent Note - 10/11/2017 5:07:28 PM
Y - Volume totals have been cooling. Recent losses negated the breakout attempt and it slumped back into the prior base raising concerns. Confirming volume-driven gains above the pivot point and for new highs would be a very reassuring sign of fresh institutional buying demand,
>>> FEATURED STOCK ARTICLE : Powerboat Maker Hit Another New 52-Week High - 9/26/2017 |
View all notes |
Set NEW NOTE alert |
Company Profile |
SEC
News |
Chart |
Request a new note
C
A
S
I |
THO
-
NYSE
Thor Industries Inc
AUTOMOTIVE - Recreational Vehicles
|
$128.23
|
+0.46
0.36% |
$128.60
|
408,203
59.59% of 50 DAV
50 DAV is 685,000
|
$129.88
-1.27%
|
8/14/2017
|
$106.67
|
PP = $110.01
|
|
MB = $115.51
|
Most Recent Note - 10/9/2017 5:31:21 PM
G - Touched a new 52-week high with light volume behind today's gain, getting more extended from the previously noted base. Prior highs in the $115 area define initial support to watch on pullbacks. Fundamentals remain strong.
>>> FEATURED STOCK ARTICLE : Wedged to New High Then Ended the Session Weak - 9/18/2017 |
View all notes |
Set NEW NOTE alert |
Company Profile |
SEC
News |
Chart |
Request a new note
C
A
S
I |
PFBC
-
NASDAQ
Preferred Bank Los Angls
BANKING - Regional - Pacific Banks
|
$59.46
|
+0.10
0.17% |
$59.55
|
86,587
135.29% of 50 DAV
50 DAV is 64,000
|
$60.99
-2.51%
|
10/10/2017
|
$59.38
|
PP = $59.08
|
|
MB = $62.03
|
Most Recent Note - 10/11/2017 6:04:51 PM
Y - Ended slightly lower with a 3rd consecutive small loss today with above average volume. It was highlighted in yellow with pivot point cited based on its 7/20/17 high plus 10 cents in the 10/10/17 mid-day report. Hit new 52-week highs, triggering a technical buy signal with considerable volume-driven gains on 9/27 and 9/28. Faces no resistance due to overhead supply. Reported earnings +31% on +26% sales revenues for the Jun '17 quarter, its 3rd consecutive quarterly comparison above the +25% minimum guideline (C criteria). See the latest FSU analysis for more details and a new annotated graph.
>>> FEATURED STOCK ARTICLE : Perched Near High Following Volume-Driven Breakout Gains - 10/11/2017 |
View all notes |
Set NEW NOTE alert |
Company Profile |
SEC
News |
Chart |
Request a new note
C
A
S
I |
AVGO
-
NASDAQ
Broadcom Limited
ELECTRONICS - Semiconductor - Broad Line
|
$248.74
|
-1.66
-0.66% |
$251.28
|
2,000,058
77.01% of 50 DAV
50 DAV is 2,597,000
|
$259.36
-4.09%
|
8/24/2017
|
$252.44
|
PP = $256.89
|
|
MB = $269.73
|
Most Recent Note - 10/10/2017 5:52:09 PM
G - Met resistance today, meanwhile, a rebound above the 50 DMA line ($246.88) is needed for its outlook to improve. Damaging losses below the recent low ($231.53 on 9/25/17) would raise serious concerns and trigger a more worrisome technical sell signal.
>>> FEATURED STOCK ARTICLE : Technical Deterioration Raises Concerns - 9/21/2017 |
View all notes |
Set NEW NOTE alert |
Company Profile |
SEC
News |
Chart |
Request a new note
C
A
S
I |
YY
-
NASDAQ
YY Inc Ads
INTERNET - Internet Service Providers
|
$91.08
|
+0.90
1.00% |
$91.51
|
1,387,182
76.89% of 50 DAV
50 DAV is 1,804,000
|
$94.00
-3.11%
|
9/25/2017
|
$80.26
|
PP = $83.10
|
|
MB = $87.26
|
Most Recent Note - 10/10/2017 5:55:07 PM
G - Encountered distributional pressure after getting extended from its prior base. Prior highs in the $83 area define initial support to watch above its 50 DMA line ($78.22).
>>> FEATURED STOCK ARTICLE : Encountered Distributional Pressure When Challenging Prior HIgh - 9/25/2017 |
View all notes |
Set NEW NOTE alert |
Company Profile |
SEC
News |
Chart |
Request a new note
C
A
S
I |
Symbol/Exchange
Company Name
Industry Group |
PRICE |
CHANGE
(%Change) |
Day High |
Volume
(% DAV)
(% 50 day avg vol) |
52 Wk Hi
% From Hi |
Featured
Date |
Price
Featured |
Pivot Featured |
|
Max Buy |
STMP
-
NASDAQ
Stamps.com Inc
INTERNET - Internet Software and Services
|
$222.35
|
+4.65
2.14% |
$224.30
|
436,941
97.75% of 50 DAV
50 DAV is 447,000
|
$222.90
-0.25%
|
9/11/2017
|
$193.65
|
PP = $220.35
|
|
MB = $231.37
|
Most Recent Note - 10/11/2017 4:41:41 PM
Y - Faces no resistance and hit a new 52-week high today but quietly ended the session in the lower half of its intra-day range. The new pivot point cited was based on its 8/07/17 high plus 10 cents. Subsequent volume-driven gains above the pivot point are needed to trigger a new (or add-on) technical buy signal. Recent low ($185.80 on 9/05/17) and its 50 DMA line ($203) define important near-term support where violations would trigger technical sell signals.
>>> FEATURED STOCK ARTICLE : Perched Near Pivot Point With No Resistance Remaining - 10/4/2017 |
View all notes |
Set NEW NOTE alert |
Company Profile |
SEC
News |
Chart |
Request a new note
C
A
S
I |
HTHT
-
NASDAQ
China Lodging Group Ads
LEISURE - Lodging
|
$125.66
|
-3.95
-3.05% |
$130.70
|
436,444
119.90% of 50 DAV
50 DAV is 364,000
|
$138.44
-9.23%
|
9/29/2016
|
$46.12
|
PP = $47.82
|
|
MB = $50.21
|
Most Recent Note - 10/10/2017 12:11:46 PM
G - Retreating today from a record high hit on the prior session. Very extended from any sound base. Earnings +19% on +18% sales revenues for the Jun '17 quarter were below the +25% minimum earnings guideline (C criteria). Its 50 DMA line ($113) defines near-term support.
>>> FEATURED STOCK ARTICLE : Holding Ground Stubbornly After Considerable Rally - 10/5/2017 |
View all notes |
Set NEW NOTE alert |
Company Profile |
SEC
News |
Chart |
Request a new note
C
A
S
I |
LMAT
-
NASDAQ
Lemaitre Vascular Inc
Medical-Products
|
$37.28
|
-0.15
-0.40% |
$37.59
|
73,659
39.60% of 50 DAV
50 DAV is 186,000
|
$39.29
-5.12%
|
7/28/2017
|
$33.50
|
PP = $33.32
|
|
MB = $34.99
|
Most Recent Note - 10/11/2017 3:59:48 PM
G - Extended from any sound base, and volume totals have been cooling while consolidating. Near-term support at its 50 DMA line coincides with prior highs in the $36 area.
>>> FEATURED STOCK ARTICLE : Quietly Pulling Back From High After More Volume-Driven Gains - 9/22/2017 |
View all notes |
Set NEW NOTE alert |
Company Profile |
SEC
News |
Chart |
Request a new note
C
A
S
I |
ESNT
-
NYSE
Essent Group Ltd
Finance-MrtgandRel Svc
|
$40.52
|
+0.25
0.62% |
$40.72
|
629,122
81.27% of 50 DAV
50 DAV is 774,100
|
$41.44
-2.22%
|
10/9/2017
|
$39.75
|
PP = $41.54
|
|
MB = $43.62
|
Most Recent Note - 10/9/2017 11:57:01 AM
Y - Perched within striking distance of its all-time high, but pulling back toward its 50 DMA line ($38.93) which recently acted as support. Little resistance remains due to overhead supply. New pivot point is cited based on its 8/07/17 high plus 10 cents. Subsequent volume-driven gains above the pivot point may trigger a new (or add-on) technical buy signal.
>>> FEATURED STOCK ARTICLE : Perched Within Close Striking Distance of Prior High - 9/29/2017 |
View all notes |
Set NEW NOTE alert |
Company Profile |
SEC
News |
Chart |
Request a new note
C
A
S
I |
FIVE
-
NASDAQ
Five Below Inc
Retail-DiscountandVariety
|
$54.99
|
-0.99
-1.77% |
$56.00
|
874,659
99.51% of 50 DAV
50 DAV is 879,000
|
$57.65
-4.61%
|
10/6/2017
|
$57.13
|
PP = $54.23
|
|
MB = $56.94
|
Most Recent Note - 10/11/2017 4:52:17 PM
Y - Pulled back today for a 3rd small loss on ever-decreasing volume. Prior highs in the $54 area define near-term support. Technically, volume was +130% above average behind a big breakout gain on 10/06/17, when it was highlighted in yellow in the mid-day report.
>>> FEATURED STOCK ARTICLE : Finished Strong With Above Average Volume Behind Big Gain - 10/6/2017 |
View all notes |
Set NEW NOTE alert |
Company Profile |
SEC
News |
Chart |
Request a new note
C
A
S
I |
Symbol/Exchange
Company Name
Industry Group |
PRICE |
CHANGE
(%Change) |
Day High |
Volume
(% DAV)
(% 50 day avg vol) |
52 Wk Hi
% From Hi |
Featured
Date |
Price
Featured |
Pivot Featured |
|
Max Buy |
OLED
-
NASDAQ
Universal Display Corp
Elec-Misc Products
|
$134.60
|
+4.40
3.38% |
$136.41
|
1,452,043
167.29% of 50 DAV
50 DAV is 868,000
|
$145.30
-7.36%
|
8/31/2017
|
$128.22
|
PP = $127.78
|
|
MB = $134.17
|
Most Recent Note - 10/11/2017 5:01:33 PM
Y - Volume totals have been cooling in recent weeks after abruptly pulling back near prior highs. Its 50 DMA line and recent lows define important near-term support to watch in the $123-124 area.
>>> FEATURED STOCK ARTICLE : Consolidating Near Prior Highs Following Recent Breakout - 9/28/2017 |
View all notes |
Set NEW NOTE alert |
Company Profile |
SEC
News |
Chart |
Request a new note
C
A
S
I |
ANET
-
NYSE
Arista Networks Inc
TELECOMMUNICATIONS - Communication Equipment
|
$191.21
|
-1.74
-0.90% |
$193.11
|
508,816
62.51% of 50 DAV
50 DAV is 814,000
|
$196.27
-2.58%
|
8/4/2017
|
$173.31
|
PP = $163.07
|
|
MB = $171.22
|
Most Recent Note - 10/10/2017 5:50:32 PM
G - Quietly hovering near its all-time high, extended from any sound base. Its 50 DMA line and prior highs coincide in the $176 area, defining important near-term support to watch on pullbacks. Fundamentals remain very strong.
>>> FEATURED STOCK ARTICLE : Extended From Any Sound Base After Additional Volume-Driven Gains - 9/19/2017 |
View all notes |
Set NEW NOTE alert |
Company Profile |
SEC
News |
Chart |
Request a new note
C
A
S
I |
GRUB
-
NYSE
Grubhub Inc
COMPUTER SOFTWARE and SERVICES - Technical and System Software
|
$52.16
|
+0.18
0.35% |
$52.21
|
807,045
42.63% of 50 DAV
50 DAV is 1,893,000
|
$57.61
-9.46%
|
6/21/2017
|
$47.33
|
PP = $46.94
|
|
MB = $49.29
|
Most Recent Note - 10/11/2017 4:55:13 PM
G - Still sputtering below its 50 DMA line ($53.90), and the longer it lingers below that short-term average the worse its outlook gets. The recent low ($49.60 on 9/22/17) defines near-term support above prior highs in the $47 area. Recently reported earnings +13% on +32% sales revenues for the Jun '17 quarter, below the +25% minimum earnings guideline (C criteria) raising fundamental concerns.
>>> FEATURED STOCK ARTICLE : Gain Above 50-Day Moving Average Line Helped Technical Stance - 10/2/2017 |
View all notes |
Set NEW NOTE alert |
Company Profile |
SEC
News |
Chart |
Request a new note
C
A
S
I |
IBP
-
NYSE
Installed Building Prod
DIVERSIFIED SERVICES - Business/Management Services
|
$64.95
|
-0.25
-0.38% |
$65.75
|
84,921
53.08% of 50 DAV
50 DAV is 160,000
|
$67.15
-3.28%
|
9/19/2017
|
$59.15
|
PP = $60.10
|
|
MB = $63.11
|
Most Recent Note - 10/11/2017 4:58:37 PM
G - Volume totals have been cooling while consolidating. It is extended from prior highs in the $60 area that define initial support above its 50 DMA line ($59.13).
>>> FEATURED STOCK ARTICLE : Building - Maintenance & Service Firm Extended From Latest Base - 10/9/2017 |
View all notes |
Set NEW NOTE alert |
Company Profile |
SEC
News |
Chart |
Request a new note
C
A
S
I |
NCOM
-
NASDAQ
National Commerce Corp
BANKING - Regional - Southeast Banks
|
$42.90
|
-0.25
-0.58% |
$43.25
|
27,137
69.58% of 50 DAV
50 DAV is 39,000
|
$43.80
-2.05%
|
4/25/2017
|
$38.95
|
PP = $40.09
|
|
MB = $42.09
|
 Most Recent Note - 10/12/2017 5:06:45 PM
G - Still stubbornly holding its ground near its 52-week high following an impressive spurt of volume-driven gains. Recently reported Jun '17 earnings +23% on +45% sales revenues, below the +25% minimum earnings guideline (C criteria), raising fundamental concerns. See the latest FSU analysis for more details and a new annotated graph.
>>> FEATURED STOCK ARTICLE : Holding Ground Following Impressive Volume-Driven Gains - 10/12/2017 |
View all notes |
Set NEW NOTE alert |
Company Profile |
SEC
News |
Chart |
Request a new note
C
A
S
I |
Symbol/Exchange
Company Name
Industry Group |
PRICE |
CHANGE
(%Change) |
Day High |
Volume
(% DAV)
(% 50 day avg vol) |
52 Wk Hi
% From Hi |
Featured
Date |
Price
Featured |
Pivot Featured |
|
Max Buy |
OLLI
-
NASDAQ
Ollie's Bargain Outlet
Retail-DiscountandVariety
|
$45.20
|
-0.25
-0.55% |
$45.50
|
362,275
65.39% of 50 DAV
50 DAV is 554,000
|
$46.90
-3.62%
|
9/8/2017
|
$45.20
|
PP = $46.18
|
|
MB = $48.49
|
Most Recent Note - 10/11/2017 4:03:14 PM
Y - Hovering near its all-time high with volume totals cooling. Recent gains above the latest pivot point did not meet the minimum +40% above average volume threshold necessary to trigger a proper new (or add-on) technical buy signal. Confirming volume-driven gains would be a reassuring sign of fresh institutional buying demand. Fundamentals remain strong.
>>> FEATURED STOCK ARTICLE : Quietly Hit New Highs Without Great Volume Conviction - 10/3/2017 |
View all notes |
Set NEW NOTE alert |
Company Profile |
SEC
News |
Chart |
Request a new note
C
A
S
I |
HLI
-
NYSE
Houlihan Lokey Inc Cl A
Finance-Invest Bnk/Bkrs
|
$39.89
|
+0.47
1.19% |
$40.02
|
158,807
73.86% of 50 DAV
50 DAV is 215,000
|
$40.63
-1.82%
|
9/18/2017
|
$37.04
|
PP = $39.78
|
|
MB = $41.77
|
Most Recent Note - 10/11/2017 3:55:42 PM
Y - Quietly consolidating after wedging to new highs with recent gains lacking volume conviction. Gains above the pivot point must be backed by at least +40% above average volume to trigger a proper new (or add-on) technical buy signal. Subsequent losses below the recent low ($34.41 on 8/18/17) would raise more serious concerns and trigger a technical sell signal.
>>> FEATURED STOCK ARTICLE : Rebounding Toward Prior High and New Pivot Point - 9/27/2017 |
View all notes |
Set NEW NOTE alert |
Company Profile |
SEC
News |
Chart |
Request a new note
C
A
S
I |
ICHR
-
NASDAQ
Ichor Holdings Ltd
ELECTRONICS - Semiconductor Equipment
|
$31.34
|
+1.14
3.77% |
$31.37
|
876,398
119.24% of 50 DAV
50 DAV is 735,000
|
$31.68
-1.07%
|
10/10/2017
|
$29.39
|
PP = $28.36
|
|
MB = $29.78
|
Most Recent Note - 10/11/2017 12:18:35 PM
Y - Hit a new high today but reversed into the red. Finished strong on the prior session after highlighted in yellow with pivot point cited based on its 10/02/17 high. It rallied from a cup-with-handle base. Reported great increases for the past 4 quarterly comparisons through Jun '17, helping it better match the fact-based investment system's fundamental guidelines. Limited history is a concern and it is up considerably from its $9 IPO on 12/09/16. See the latest FSU analysis for more details and an annotated graph.
>>> FEATURED STOCK ARTICLE : Semiconductor Equipment Firm Finished Strong After Highlighted - 10/10/2017 |
View all notes |
Set NEW NOTE alert |
Company Profile |
SEC
News |
Chart |
Request a new note
C
A
S
I |
|
|
|
THESE ARE NOT BUY RECOMMENDATIONS!
Comments contained in the body of this report are technical
opinions only. The material herein has been obtained
from sources believed to be reliable and accurate, however,
its accuracy and completeness cannot be guaranteed.
This site is not an investment advisor, hence it does
not endorse or recommend any securities or other investments.
Any recommendation contained in this report may not
be suitable for all investors and it is not to be deemed
an offer or solicitation on our part with respect to
the purchase or sale of any securities. All trademarks,
service marks and trade names appearing in this report
are the property of their respective owners, and are
likewise used for identification purposes only.
This report is a service available
only to active Paid Premium Members.
You may opt-out of receiving report notifications
at any time. Questions or comments may be submitted
by writing to Premium Membership Services 665 S.E. 10 Street, Suite 201 Deerfield Beach, FL 33441-5634 or by calling 1-800-965-8307
or 954-785-1121.
|
|
|