***Last / Change / Volume data in this table is the closing quote data***
Symbol/Exchange
Company Name
Industry Group |
PRICE |
CHANGE
(%Change) |
Day High |
Volume
(% DAV)
(% 50 day avg vol) |
52 Wk Hi
% From Hi |
Featured
Date |
Price
Featured |
Pivot Featured |
|
Max Buy |
 SIVB
-
NASDAQ
SIVB
-
NASDAQ
S V B Financial Group
BANKING - Regional - Pacific Banks
|
$591.60
|
+1.97
0.33% |
$597.45
|
294,780
75.20% of 50 DAV
50 DAV is 392,000
|
$608.84
-2.83%
|
8/6/2021
|
$589.70
|
PP = $608.94
|
|
MB = $639.39
|
Most Recent Note - 9/7/2021 5:16:45 PM
Y - Color code is changed to yellow after rebounding back above its 50 DMA line ($566) helping its outlook improve. Prior lows in the $530 area define the next important near-term support to watch. Completed a new Public Offering on 8/11/21.
>>> FEATURED STOCK ARTICLE : Consolidating Near Prior Highs Facing Little Resistance - 8/9/2021 |
View all notes |
Set NEW NOTE alert |
Company Profile |
SEC
News |
Chart |
Request a new note
C
A
S
I |
BLDR
-
NYSE
Builders Firstsource Inc
Bldg-Constr Prds/Misc
|
$53.47
|
-0.90
-1.66% |
$55.00
|
1,937,938
82.54% of 50 DAV
50 DAV is 2,348,000
|
$55.17
-3.08%
|
8/12/2021
|
$52.38
|
PP = $54.09
|
|
MB = $56.79
|
Most Recent Note - 9/8/2021 5:18:22 PM
Y - Volume totals have been below average while stubbornly holding its ground perched at its all-time high. Subsequent gains above the pivot point backed by at least +40% above average volume may clinch a proper technical buy signal. Fundamentals remain strong.
>>> FEATURED STOCK ARTICLE : Rebounding Near Prior High After Another Strong Quarter - 8/12/2021 |
View all notes |
Set NEW NOTE alert |
Company Profile |
SEC
News |
Chart |
Request a new note
C
A
S
I |
SNPS
-
NASDAQ
Synopsys Inc
COMPUTER SOFTWARE and SERVICES - Technical and System Software
|
$332.49
|
-1.06
-0.32% |
$336.78
|
491,427
74.62% of 50 DAV
50 DAV is 658,600
|
$340.66
-2.40%
|
8/18/2021
|
$293.22
|
PP = $301.01
|
|
MB = $316.06
|
Most Recent Note - 9/8/2021 5:24:11 PM
G - Perched at its all-time high, extended from any sound base. Prior high in the $300 area defines initial support above its 50 DMA line ($296.61).
>>> FEATURED STOCK ARTICLE : Latest Earnings Report Missed the +25% Minimum Guideline - 8/18/2021 |
View all notes |
Set NEW NOTE alert |
Company Profile |
SEC
News |
Chart |
Request a new note
C
A
S
I |
CROX
-
NASDAQ
Crocs Inc
CONSUMER NON-DURABLES - Textile - Apparel Footwear
|
$144.11
|
+2.58
1.82% |
$146.34
|
1,323,088
124.70% of 50 DAV
50 DAV is 1,061,000
|
$147.76
-2.47%
|
6/14/2021
|
$112.64
|
PP = $110.01
|
|
MB = $115.51
|
Most Recent Note - 9/9/2021 5:37:46 PM
G - Perched within striking distance of its all-time high with recent gains showing support above its 50 DMA line ($132.58).
>>> FEATURED STOCK ARTICLE : Wedging Higher and Very Extended From Any Sound Base - 8/16/2021 |
View all notes |
Set NEW NOTE alert |
Company Profile |
SEC
News |
Chart |
Request a new note
C
A
S
I |
KFRC
-
NASDAQ
Kforce Inc
Comml Svcs-Staffing
|
$59.89
|
+0.01
0.02% |
$60.35
|
167,443
164.16% of 50 DAV
50 DAV is 102,000
|
$64.38
-6.97%
|
9/10/2021
|
$59.53
|
PP = $64.48
|
|
MB = $67.70
|
 Most Recent Note - 9/10/2021 5:51:27 PM
Y - Posted a 3rd consecutive gain with ever increasing volume. Color code was changed to yellow with pivot point cited based on its 6/02/21 high plus 10 cents in the earlier mid-day report. Rose near its 50 DMA line ($60.23) which may act as resistance while trying to rebound toward its all-time high. Subsequent gains above its pivot point backed by at least +40% above average volume are needed to trigger a technical buy signal. Reported earnings +113% on +18% sales revenues for the Jun '21 quarter versus the year ago period, its 4th quarterly earnings increase above the +25% minimum earnings guideline (C criteria). Annual earnings (A criteria) growth has been steady.
There are no Featured Stock Updates™ available for this stock at this time. You may request one by clicking the Request a New Note link below |
View all notes |
Set NEW NOTE alert |
Company Profile |
SEC
News |
Chart |
Request a new note
C
A
S
I |
Symbol/Exchange
Company Name
Industry Group |
PRICE |
CHANGE
(%Change) |
Day High |
Volume
(% DAV)
(% 50 day avg vol) |
52 Wk Hi
% From Hi |
Featured
Date |
Price
Featured |
Pivot Featured |
|
Max Buy |
CRL
-
NYSE
Charles River Labs Intl
DRUGS - Biotechnology
|
$441.00
|
-2.00
-0.45% |
$446.94
|
595,638
229.09% of 50 DAV
50 DAV is 260,000
|
$450.84
-2.18%
|
6/9/2021
|
$345.91
|
PP = $349.23
|
|
MB = $366.69
|
Most Recent Note - 9/10/2021 12:27:45 PM
G - Churning higher volume while remaining perched at its all-time high, extended from any sound base. Its 50 DMA line ($410) defines near-term support to watch on pullbacks. Fundamentals remain strong.
>>> FEATURED STOCK ARTICLE : Wedging Higher With Gains Lacking Volume Conviction - 8/24/2021 |
View all notes |
Set NEW NOTE alert |
Company Profile |
SEC
News |
Chart |
Request a new note
C
A
S
I |
REGN
-
NASDAQ
Regeneron Pharmaceutical
DRUGS - Biotechnology
|
$650.49
|
+4.38
0.68% |
$659.76
|
738,762
97.85% of 50 DAV
50 DAV is 755,000
|
$686.62
-5.26%
|
8/20/2021
|
$669.82
|
PP = $664.74
|
|
MB = $697.98
|
Most Recent Note - 9/9/2021 5:34:06 PM
Y - Pulled back with higher volume today raising concerns after recently wedging to its all-time high with gains lacking great volume conviction. Gains above a stock's pivot point must be backed by at least +40% above average volume to trigger a proper technical buy signal.
>>> FEATURED STOCK ARTICLE : Regeneron Featured Hitting a New High - 8/20/2021 |
View all notes |
Set NEW NOTE alert |
Company Profile |
SEC
News |
Chart |
Request a new note
C
A
S
I |
GNRC
-
NYSE
Generac Hldgs Inc
Electrical-Power/Equipmt
|
$451.31
|
-3.93
-0.86% |
$466.92
|
525,629
72.20% of 50 DAV
50 DAV is 728,000
|
$460.00
-1.89%
|
8/30/2021
|
$449.36
|
PP = $457.10
|
|
MB = $479.96
|
Most Recent Note - 9/9/2021 5:31:47 PM
Y - Posted a gain today with light volume and finished in the upper half of its intra-day range for a best-ever close. Subsequent gains and a strong close above the pivot point backed by at least +40% above average volume may trigger a new (or add-on) technical buy signal. Fundamentals remain strong. Recent low ($385) defines important near term support to watch.
>>> FEATURED STOCK ARTICLE : Rebound Above 50-Day Moving Average Helps Outlook - 8/23/2021 |
View all notes |
Set NEW NOTE alert |
Company Profile |
SEC
News |
Chart |
Request a new note
C
A
S
I |
CAMT
-
NASDAQ
Camtek Ltd
ELECTRONICS - Scientific and Technical Instrum
|
$41.20
|
+0.34
0.83% |
$41.46
|
166,707
95.81% of 50 DAV
50 DAV is 174,000
|
$42.88
-3.92%
|
8/4/2021
|
$39.67
|
PP = $40.57
|
|
MB = $42.60
|
Most Recent Note - 9/8/2021 5:19:55 PM
Y - Pulled back today after wedging to new all-time highs with recent gains backed by light volume. Its 50 DMA line ($37.26) and prior low ($34.68 on 8/17/21) define important near-term support to watch. Fundamentals remain strong.
>>> FEATURED STOCK ARTICLE : Recent 50-Day Moving Average Violation Again Raised Concerns - 8/17/2021 |
View all notes |
Set NEW NOTE alert |
Company Profile |
SEC
News |
Chart |
Request a new note
C
A
S
I |
PKI
-
NYSE
Perkinelmer Inc
ELECTRONICS - Scientific and Technical Instrum
|
$187.05
|
+0.20
0.11% |
$188.43
|
441,658
61.86% of 50 DAV
50 DAV is 714,000
|
$191.07
-2.10%
|
8/18/2021
|
$181.07
|
PP = $188.50
|
|
MB = $197.93
|
Most Recent Note - 9/10/2021 5:48:24 PM
Y - Volume totals have been cooling after it recently wedged to new all-time highs. After forming a noted "3-weeks tight" base its color code was changed to yellow with new pivot point cited based on its 8/05/21 high plus 10 cents. Its 50 DMA line ($174.59).and prior high ($162) define important near-term support to watch. Fundamentals remain strong.
>>> FEATURED STOCK ARTICLE : Powerful Volume-Driven Breakout After Earnings Report - 7/26/2021 |
View all notes |
Set NEW NOTE alert |
Company Profile |
SEC
News |
Chart |
Request a new note
C
A
S
I |
Symbol/Exchange
Company Name
Industry Group |
PRICE |
CHANGE
(%Change) |
Day High |
Volume
(% DAV)
(% 50 day avg vol) |
52 Wk Hi
% From Hi |
Featured
Date |
Price
Featured |
Pivot Featured |
|
Max Buy |
TRMB
-
NASDAQ
Trimble Inc
ELECTRONICS - Scientific and Technical Instrum
|
$93.88
|
+0.23
0.25% |
$94.83
|
824,943
83.75% of 50 DAV
50 DAV is 985,000
|
$96.49
-2.70%
|
8/5/2021
|
$88.83
|
PP = $84.97
|
|
MB = $89.22
|
Most Recent Note - 9/8/2021 5:28:04 PM
G - Pulled back with slightly higher volume today yet it remains perched near its all-time high. Its 50 DMA line ($87.13) defines near-term support above prior highs in the $84 area. Fundamentals remain strong.
>>> FEATURED STOCK ARTICLE : Finished Strong With Gain for New High Backed by Volume - 8/5/2021 |
View all notes |
Set NEW NOTE alert |
Company Profile |
SEC
News |
Chart |
Request a new note
C
A
S
I |
UMC
-
NYSE
United Microelectrnc Adr
ELECTRONICS - Semiconductor - Integrated Cir
|
$12.22
|
+0.08
0.66% |
$12.54
|
4,984,448
65.46% of 50 DAV
50 DAV is 7,614,000
|
$12.62
-3.17%
|
8/5/2021
|
$11.62
|
PP = $11.38
|
|
MB = $11.95
|
Most Recent Note - 9/7/2021 12:52:20 PM
G - Gapped up on the prior session rallying above its "max buy" level hitting another new all-time high and its color code was changed to green. Prior highs in the $11.25 area define initial support to watch above its 50 DMA line ($10.29).
>>> FEATURED STOCK ARTICLE : Taiwan-Based Semiconductor Firm's Breakout Highlighted This Week - 8/6/2021 |
View all notes |
Set NEW NOTE alert |
Company Profile |
SEC
News |
Chart |
Request a new note
C
A
S
I |
ASML
-
NASDAQ
A S M L Holding N.V. NY
ELECTRONICS - Semiconductor Equipment and Mate
|
$858.87
|
+5.37
0.63% |
$875.36
|
1,136,587
174.06% of 50 DAV
50 DAV is 653,000
|
$868.88
-1.15%
|
5/25/2021
|
$669.59
|
PP = $675.75
|
|
MB = $709.54
|
Most Recent Note - 9/10/2021 12:20:41 PM
G - Extended from any base and hitting another new all-time high with today's gain adding to volume-driven gains. Stubbornly holding its ground and making steady progress. Its 50 DMA line ($770) defines important near-term support to watch on pullbacks.
>>> FEATURED STOCK ARTICLE : Semi Equipment Firm Extended From Any Sound Base - 8/11/2021 |
View all notes |
Set NEW NOTE alert |
Company Profile |
SEC
News |
Chart |
Request a new note
C
A
S
I |
ENTG
-
NASDAQ
Entegris Inc
ELECTRONICS - Semiconductor Equipment and Mate
|
$120.64
|
+0.93
0.78% |
$123.38
|
490,998
83.50% of 50 DAV
50 DAV is 588,000
|
$126.41
-4.56%
|
8/4/2021
|
$125.33
|
PP = $126.51
|
|
MB = $132.84
|
Most Recent Note - 9/8/2021 5:22:51 PM
Y - Volume totals have been cooling while holding its ground above the 50 DMA line ($118). Recent lows in the $109 area define important near-term support above its 200 DMA line. Subsequent gains and a close above the pivot point backed by at least +40% above average volume may trigger a proper technical buy signal. Fundamentals remain strong as it reported Jun '21 quarterly earnings +42% on +27% sales revenues.
>>> FEATURED STOCK ARTICLE : Perched Near High After 6th Consecutive Gain - 8/4/2021 |
View all notes |
Set NEW NOTE alert |
Company Profile |
SEC
News |
Chart |
Request a new note
C
A
S
I |
AMRC
-
NYSE
Ameresco Inc Cl A
ENERGY - Alternative
|
$69.61
|
-0.58
-0.83% |
$71.68
|
368,638
149.85% of 50 DAV
50 DAV is 246,000
|
$75.88
-8.26%
|
9/2/2021
|
$70.97
|
PP = $70.33
|
|
MB = $73.85
|
Most Recent Note - 9/7/2021 11:58:58 AM
Y - Reversed into the red after a strong start today. Color code was changed to yellow with new pivot point cited based on its 8/25/21 high in the 9/02/21mid-day report. Hit a new all-time high with +55% above average volume behind a gain triggering a technical buy signal. Fundamentals remain strong after it reported Jun '21 quarterly earnings +79% on +23% sales revenues versus the year ago period. Completed a new Public Offering on 3/05/21 and went through a deep consolidation and rebounded from support at its 200 DMA line since dropped from the Featured Stocks list on 2/25/21. See the latest FSU analysis for more details and an annotated graph.
>>> FEATURED STOCK ARTICLE : Volume +55% Above Average Behind Gain for a New High - 9/2/2021 |
View all notes |
Set NEW NOTE alert |
Company Profile |
SEC
News |
Chart |
Request a new note
C
A
S
I |
Symbol/Exchange
Company Name
Industry Group |
PRICE |
CHANGE
(%Change) |
Day High |
Volume
(% DAV)
(% 50 day avg vol) |
52 Wk Hi
% From Hi |
Featured
Date |
Price
Featured |
Pivot Featured |
|
Max Buy |
HIBB
-
NASDAQ
Hibbett Sports Inc
SPECIALTY RETAIL - Sporting Goods Stores
|
$80.73
|
-1.43
-1.74% |
$83.68
|
637,148
138.27% of 50 DAV
50 DAV is 460,800
|
$100.32
-19.53%
|
8/25/2021
|
$99.58
|
PP = $98.45
|
|
MB = $103.37
|
Most Recent Note - 9/8/2021 5:29:58 PM
G - Color code is changed to green after 2 big volume-driven losses violated its 50 DMA line ($90.21) raising concerns and triggering a technical sell signal. Recently reported Jul '21 earnings +0% on -5% sales revenues versus the year ago period, raising fundamental concerns.
>>> FEATURED STOCK ARTICLE : Volume-Driven Gain for New High Ahead of Earnings Report - 8/26/2021 |
View all notes |
Set NEW NOTE alert |
Company Profile |
SEC
News |
Chart |
Request a new note
C
A
S
I |
CLFD
-
NASDAQ
Clearfield Inc
TELECOMMUNICATIONS - Cables / Satalite Equipment
|
$44.58
|
-0.19
-0.42% |
$45.77
|
41,775
43.52% of 50 DAV
50 DAV is 96,000
|
$46.93
-5.01%
|
7/23/2021
|
$40.23
|
PP = $43.74
|
|
MB = $45.93
|
Most Recent Note - 9/10/2021 5:42:41 PM
Y - Color code is changed to yellow while quietly pulling back below its "max buy" level. Its 50 DMA line ($41.33) defines important near-term support to watch on pullbacks. Fundamentals remain strong.
>>> FEATURED STOCK ARTICLE : Big Volume-Driven Gain Challenging Prior High After Earnings - 7/23/2021 |
View all notes |
Set NEW NOTE alert |
Company Profile |
SEC
News |
Chart |
Request a new note
C
A
S
I |
POOL
-
NASDAQ
Pool Corp
WHOLESALE - Basic Materials Wholesale
|
$493.43
|
+1.79
0.36% |
$498.77
|
197,929
87.19% of 50 DAV
50 DAV is 227,000
|
$500.85
-1.48%
|
8/19/2021
|
$484.37
|
PP = $495.32
|
|
MB = $520.09
|
Most Recent Note - 9/8/2021 5:14:08 PM
Y - Touched a new high today with light volume. After forming an advanced "3-weeks tight" base, subsequent gains above the pivot point backed by at least +40% above average volume may clinch a proper new (or add-on) technical buy signal. Volume totals cooled while stubbornly holding its ground. Its 50 DMA line ($476) defines important near-term support to watch on pullbacks. See the latest FSU analysis for more details and a new annotated graph.
>>> FEATURED STOCK ARTICLE : Touched New High With a Gain on Light Volume - 9/8/2021 |
View all notes |
Set NEW NOTE alert |
Company Profile |
SEC
News |
Chart |
Request a new note
C
A
S
I |
SMPL
-
NASDAQ
Simply Good Foods Co
Food-Confectionery
|
$35.17
|
+0.52
1.50% |
$35.55
|
360,990
95.91% of 50 DAV
50 DAV is 376,400
|
$38.50
-8.65%
|
12/28/2020
|
$30.40
|
PP = $31.44
|
|
MB = $33.01
|
Most Recent Note - 9/9/2021 5:39:18 PM
G - Still sputtering with volume totals cooling. A rebound above the 50 DMA line ($36.24) is needed for its outlook to improve. Recent low ($33.91 on 8/19/21) defines important support where more damaging losses would raise greater concerns. Fundamentals remain strong.
>>> FEATURED STOCK ARTICLE : Still Lingering Below 50-Day Moving Average Line - 8/30/2021 |
View all notes |
Set NEW NOTE alert |
Company Profile |
SEC
News |
Chart |
Request a new note
C
A
S
I |
WDAY
-
NYSE
Workday Inc Cl A
Computer Sftwr-Enterprse
|
$267.53
|
-2.47
-0.91% |
$271.92
|
1,220,737
76.08% of 50 DAV
50 DAV is 1,604,500
|
$282.77
-5.39%
|
9/7/2021
|
$275.69
|
PP = $282.87
|
|
MB = $297.01
|
Most Recent Note - 9/7/2021 5:10:04 PM
Y - Lost ground today and ended near the session low after highlighted in yellow with pivot point cited based on its 2/16/21 high plus 10 cents in the earlier mid-day report. It is perched within striking distance of its 52-week high after a big gap up 8/27/21 and additional volume-driven gains. Subsequent gains above the pivot point backed by at least +40% above average volume may trigger a technical buy signal. Reported Jul '21 quarterly earnings +46% on +19% sales revenues versus the year ago period, its 5th consecutive quarterly comparison well above the +25% minimum guideline (C criteria). See the latest FSU analysis for more details and a new annotated graph.
>>> FEATURED STOCK ARTICLE : Gap Up and Recent Gains Challenge All-Time High - 9/7/2021 |
View all notes |
Set NEW NOTE alert |
Company Profile |
SEC
News |
Chart |
Request a new note
C
A
S
I |
Symbol/Exchange
Company Name
Industry Group |
PRICE |
CHANGE
(%Change) |
Day High |
Volume
(% DAV)
(% 50 day avg vol) |
52 Wk Hi
% From Hi |
Featured
Date |
Price
Featured |
Pivot Featured |
|
Max Buy |
CTLT
-
NYSE
Catalent Inc
DRUGS - Biotechnology
|
$137.66
|
-3.37
-2.39% |
$140.78
|
1,161,304
153.82% of 50 DAV
50 DAV is 755,000
|
$142.64
-3.49%
|
8/25/2021
|
$128.72
|
PP = $127.78
|
|
MB = $134.17
|
Most Recent Note - 9/10/2021 5:46:55 PM
G - Pulled back from its all-time high today's loss backed by slightly higher volume. Prior highs in the $124-127 area define initial support to watch above its 50 DMA line ($121.52). Fundamentals remain strong.
>>> FEATURED STOCK ARTICLE : Strong Gain Triggered Technical Buy Signal - 8/25/2021 |
View all notes |
Set NEW NOTE alert |
Company Profile |
SEC
News |
Chart |
Request a new note
C
A
S
I |
SQ
-
NYSE
Square Inc Cl A
Finance-CrdtCard/PmtPr
|
$247.90
|
-3.64
-1.45% |
$254.75
|
6,481,322
84.26% of 50 DAV
50 DAV is 7,692,000
|
$289.23
-14.29%
|
8/2/2021
|
$273.78
|
PP = $283.29
|
|
MB = $297.45
|
Most Recent Note - 9/8/2021 5:26:27 PM
G - Color code is changed to green after today's big volume-driven loss violated its 50 DMA line ($258) raising concerns and triggering a technical sell signal. Only a prompt rebound above the 50 DMA line would help its outlook improve. Fundamentals remain strong.
>>> FEATURED STOCK ARTICLE : Pullback Following Big Gain on Strong Earnings and M&A News - 8/3/2021 |
View all notes |
Set NEW NOTE alert |
Company Profile |
SEC
News |
Chart |
Request a new note
C
A
S
I |
BLD
-
NYSE
Topbuild Corp
Bldg-Constr Prds/Misc
|
$225.29
|
+1.56
0.70% |
$230.54
|
488,236
174.99% of 50 DAV
50 DAV is 279,000
|
$235.50
-4.34%
|
9/9/2021
|
$227.02
|
PP = $229.89
|
|
MB = $241.38
|
Most Recent Note - 9/10/2021 12:23:13 PM
Y - On track today for a 3rd consecutive volume-driven gain. Highlighted in yellow in the 9/09/21 mid-day report with pivot point cited based on its 8/12 /21 high after a cup-with-handle base. A gain and strong close above the pivot point backed by at least +40% above average volume may trigger a technical buy signal. Little resistance remains while rallying near its all-time high. Reported Jun '21 quarterly earnings +64% on +29% sales revenues versus the year ago period, marking its 4th consecutive comparison above the +25% minimum guideline (C criteria). Sequential comparisons show encouraging acceleration in its sales revenues growth rate, also helping it better match the fact-based investment system's winning models. Annual earnings growth (A criteria) has been strong. See the latest FSU analysis for more details and an annotated graph.
>>> FEATURED STOCK ARTICLE : Close in Lower Half of Range Indicates Distributional Pressure - 9/9/2021 |
View all notes |
Set NEW NOTE alert |
Company Profile |
SEC
News |
Chart |
Request a new note
C
A
S
I |
SHOP
-
NYSE
Shopify Inc Cl A
Computer Sftwr-Enterprse
|
$1,484.10
|
-19.98
-1.33% |
$1,517.71
|
498,944
44.99% of 50 DAV
50 DAV is 1,109,000
|
$1,650.00
-10.05%
|
7/2/2021
|
$1,468.00
|
PP = $1,552.23
|
|
MB = $1,629.84
|
Most Recent Note - 9/8/2021 5:32:49 PM
G - Color code is changed to green after violating its 50 DMA line ($1,514) with today's big loss on higher (near average) volume raising concerns. Prior low ($1437.50 on 8/20/21) defines important near-term support to watch. Fundamentals remain strong.
>>> FEATURED STOCK ARTICLE : Volume Cools While Consolidating Above 50-Day Moving Average - 8/31/2021 |
View all notes |
Set NEW NOTE alert |
Company Profile |
SEC
News |
Chart |
Request a new note
C
A
S
I |
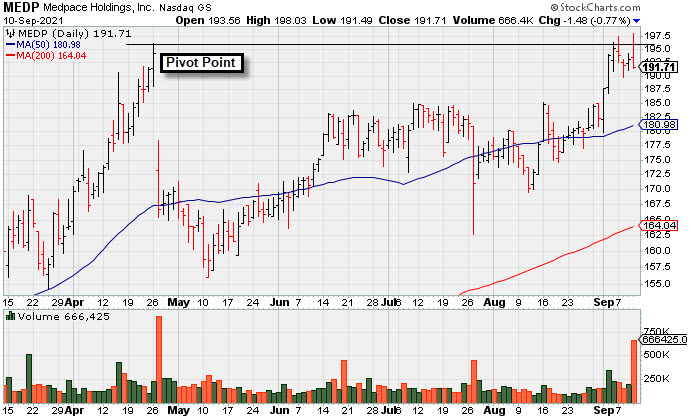
MEDP
-
NASDAQ
Medpace Holdings Inc
Medical-Research Eqp/Svc
|
$191.71
|
-1.48
-0.77% |
$198.03
|
666,424
432.74% of 50 DAV
50 DAV is 154,000
|
$197.61
-2.99%
|
9/10/2021
|
$196.32
|
PP = $196.22
|
|
MB = $206.03
|
Most Recent Note - 9/10/2021 5:39:43 PM
Y - There was a "negative reversal" for a loss with heavy volume today after highlighted in yellow with pivot point cited based on its 4/26/21 high plus 10 cents in the earlier mid-day report. Subsequent gains and strong close above the pivot point backed by at least +40% above average volume may trigger a technical buy signal. Reported Jun '21 earnings +66% on +36% sales revenues versus the year ago period, its 4rd strong earnings increase above the +25% minimum guideline (C criteria), helping it better match the winning models of the fact-based investment system. Annual earnings history has still been strong. It made choppy progress since dropped from the Featured Stocks list on 3/05/19. See the latest FSU analysis for more details and a new annotated graph.
>>> FEATURED STOCK ARTICLE : Negative Reversal Indicative of Distributional Pressure - 9/10/2021 |
View all notes |
Set NEW NOTE alert |
Company Profile |
SEC
News |
Chart |
Request a new note
C
A
S
I |
Symbol/Exchange
Company Name
Industry Group |
PRICE |
CHANGE
(%Change) |
Day High |
Volume
(% DAV)
(% 50 day avg vol) |
52 Wk Hi
% From Hi |
Featured
Date |
Price
Featured |
Pivot Featured |
|
Max Buy |
YETI
-
NYSE
Yeti Holdings Inc
Leisure-Products
|
$99.78
|
+0.24
0.24% |
$102.32
|
628,734
87.20% of 50 DAV
50 DAV is 721,000
|
$105.62
-5.53%
|
5/13/2021
|
$84.20
|
PP = $90.65
|
|
MB = $95.18
|
Most Recent Note - 9/7/2021 5:14:31 PM
G - There was a "negative reversal" after a positive start and it closed near the session low with a loss on higher (average) volume. Its 50 DMA line ($96.69) defines near-term support to watch above the recent low ($94.15). There was a noted "negative reversal" after hitting a new all-time high on 8/06/21. Fundamentals remain strong.
>>> FEATURED STOCK ARTICLE : Important Test of 50-Day Moving Average Line - 8/19/2021 |
View all notes |
Set NEW NOTE alert |
Company Profile |
SEC
News |
Chart |
Request a new note
C
A
S
I |
DOCU
-
NASDAQ
Docusign Inc
Computer Sftwr-Enterprse
|
$277.15
|
-4.16
-1.48% |
$285.62
|
2,335,320
110.26% of 50 DAV
50 DAV is 2,118,000
|
$314.76
-11.95%
|
7/6/2021
|
$288.96
|
PP = $290.33
|
|
MB = $304.85
|
Most Recent Note - 9/8/2021 11:59:32 AM
G - Color code is changed to green while slumping below its 50 DMA line ($293) with above average volume behind losses raising concerns. Prior low ($281,28) defines the next important near-term chart support. More damaging losses would raise greater concerns. Reported Jul '21 quarterly earnings +176% on +50% sales revenues versus the year ago period.
>>> FEATURED STOCK ARTICLE : Reversed From High After Recently Wedging Higher Without Volume - 8/13/2021 |
View all notes |
Set NEW NOTE alert |
Company Profile |
SEC
News |
Chart |
Request a new note
C
A
S
I |
JEF
-
NYSE
Jefferies Financial Grp
Finance-Invest Bnk/Bkrs
|
$36.62
|
-0.18
-0.49% |
$37.15
|
1,375,885
80.79% of 50 DAV
50 DAV is 1,703,000
|
$37.85
-3.25%
|
6/28/2021
|
$31.81
|
PP = $34.42
|
|
MB = $36.14
|
Most Recent Note - 9/10/2021 5:49:26 PM
G - Still stubbornly holding its ground stubbornly near its all-time high. Prior highs in the $34-35 range define initial support to watch above its 50 DMA line ($34.49).
>>> FEATURED STOCK ARTICLE : Quiet Gains for New High Closes - 8/10/2021 |
View all notes |
Set NEW NOTE alert |
Company Profile |
SEC
News |
Chart |
Request a new note
C
A
S
I |
DBX
-
NASDAQ
Dropbox Inc Cl A
Computer Sftwr-Database
|
$31.53
|
-0.57
-1.78% |
$32.38
|
3,224,578
81.90% of 50 DAV
50 DAV is 3,937,000
|
$33.00
-4.45%
|
9/3/2021
|
$32.45
|
PP = $33.00
|
|
MB = $34.65
|
Most Recent Note - 9/10/2021 5:44:55 PM
Y - Pulled back today with light volume. It has sputtered since highlighted in yellow in the 9/03/21mid-day report while noted - "A valid "secondary buy point" exists up to +5% above the latest high, as it found support at the 10 WMA following an earlier breakout."
>>> FEATURED STOCK ARTICLE : Volume Higher on 6th Consecutive Gain for Dropbox - 9/3/2021 |
View all notes |
Set NEW NOTE alert |
Company Profile |
SEC
News |
Chart |
Request a new note
C
A
S
I |
CLAR
-
NASDAQ
Clarus Corporation
Leisure-Products
|
$27.44
|
-0.18
-0.65% |
$28.13
|
61,392
36.33% of 50 DAV
50 DAV is 169,000
|
$32.36
-15.20%
|
5/12/2021
|
$21.40
|
PP = $19.73
|
|
MB = $20.72
|
Most Recent Note - 9/8/2021 5:21:25 PM
G - Slumping below its 50 DMA line ($27.69) with losses this week raising concerns. It has not formed a sound base of sufficient length, and a rebound above the 50 DMA line is needed for its outlook to improve. Fundamentals remain strong.
>>> FEATURED STOCK ARTICLE : Fundamentals Strong and Finding Support at 50-Day Moving Average - 9/1/2021 |
View all notes |
Set NEW NOTE alert |
Company Profile |
SEC
News |
Chart |
Request a new note
C
A
S
I |
Symbol/Exchange
Company Name
Industry Group |
PRICE |
CHANGE
(%Change) |
Day High |
Volume
(% DAV)
(% 50 day avg vol) |
52 Wk Hi
% From Hi |
Featured
Date |
Price
Featured |
Pivot Featured |
|
Max Buy |
AVTR
-
NYSE
Avantor Inc
Medical-Research Eqp/Svc
|
$42.33
|
+0.46
1.10% |
$42.69
|
3,889,810
124.00% of 50 DAV
50 DAV is 3,137,000
|
$42.57
-0.56%
|
6/10/2021
|
$32.94
|
PP = $34.09
|
|
MB = $35.79
|
Most Recent Note - 9/8/2021 5:16:15 PM
G - Perched at its all-time high, very extended from any sound base. Its 50 DMA line ($37.87) defines near-term support to watch on pullbacks.
>>> FEATURED STOCK ARTICLE : Steady Progress Made Since Featured - 8/27/2021 |
View all notes |
Set NEW NOTE alert |
Company Profile |
SEC
News |
Chart |
Request a new note
C
A
S
I |
MIME
-
NASDAQ
Mimecast Limited
Computer Sftwr-Security
|
$68.13
|
-0.10
-0.15% |
$68.77
|
413,905
42.28% of 50 DAV
50 DAV is 979,000
|
$71.45
-4.65%
|
8/2/2021
|
$56.12
|
PP = $59.58
|
|
MB = $62.56
|
Most Recent Note - 9/10/2021 5:40:47 PM
G - Still stubbornly holding its ground near its all-time high with volume totals cooling. Disciplined investors avoid buying stocks more than +5% above their pivot point or prior high. Prior highs in the $59 area define initial support to watch on pullbacks. Fundamentals remain strong.
>>> FEATURED STOCK ARTICLE : Perched Not Far From High With Earnings News Due Pre-Open - 8/2/2021 |
View all notes |
Set NEW NOTE alert |
Company Profile |
SEC
News |
Chart |
Request a new note
C
A
S
I |