***Last / Change / Volume data in this table is the closing quote data***
Symbol/Exchange
Company Name
Industry Group |
PRICE |
CHANGE
(%Change) |
Day High |
Volume
(% DAV)
(% 50 day avg vol) |
52 Wk Hi
% From Hi |
Featured
Date |
Price
Featured |
Pivot Featured |
|
Max Buy |
 SIVB
-
NASDAQ
SIVB
-
NASDAQ
S V B Financial Group
BANKING - Regional - Pacific Banks
|
$574.48
|
+13.72
2.45% |
$577.07
|
310,453
77.23% of 50 DAV
50 DAV is 402,000
|
$608.84
-5.64%
|
8/6/2021
|
$589.70
|
PP = $608.94
|
|
MB = $639.39
|
Most Recent Note - 8/25/2021 5:21:39 PM
Y - Color code is changed to yellow after rebounding above its 50 DMA line ($564) with today's 4th consecutive gain backed by light volume. Prior lows in the $530 area define the next important near-term support to watch. Completed a new Public Offering on 8/11/21.
>>> FEATURED STOCK ARTICLE : Consolidating Near Prior Highs Facing Little Resistance - 8/9/2021 |
View all notes |
Set NEW NOTE alert |
Company Profile |
SEC
News |
Chart |
Request a new note
C
A
S
I |
BLDR
-
NYSE
Builders Firstsource Inc
Bldg-Constr Prds/Misc
|
$53.25
|
+1.50
2.90% |
$53.74
|
1,976,561
63.17% of 50 DAV
50 DAV is 3,129,000
|
$53.99
-1.37%
|
8/12/2021
|
$52.38
|
PP = $54.09
|
|
MB = $56.79
|
 Most Recent Note - 8/27/2021 5:41:13 PM
Y - Posted another gain today with below average volume for a best-ever close. Highlighted in yellow with pivot point cited based on its 5/10/21 high plus 10 cents in the 8/12/21 mid-day report. Subsequent gains above the pivot point backed by at least +40% above average volume may trigger a technical buy signal. Found support near its 200 DMA line. Fundamentals remain strong.
>>> FEATURED STOCK ARTICLE : Rebounding Near Prior High After Another Strong Quarter - 8/12/2021 |
View all notes |
Set NEW NOTE alert |
Company Profile |
SEC
News |
Chart |
Request a new note
C
A
S
I |
SNPS
-
NASDAQ
Synopsys Inc
COMPUTER SOFTWARE and SERVICES - Technical and System Software
|
$331.81
|
+5.30
1.62% |
$333.46
|
510,238
69.60% of 50 DAV
50 DAV is 733,100
|
$327.62
1.28%
|
8/18/2021
|
$293.22
|
PP = $301.01
|
|
MB = $316.06
|
Most Recent Note - 8/25/2021 5:24:27 PM
G - Hit a new all-time high above its "max buy" level and its color code is changed to green after today's 5th gain following a noted "breakaway gap" backed by heavy volume. Prior high in the $300 area defines initial support to watch on pullbacks.
>>> FEATURED STOCK ARTICLE : Latest Earnings Report Missed the +25% Minimum Guideline - 8/18/2021 |
View all notes |
Set NEW NOTE alert |
Company Profile |
SEC
News |
Chart |
Request a new note
C
A
S
I |
CROX
-
NASDAQ
Crocs Inc
CONSUMER NON-DURABLES - Textile - Apparel Footwear
|
$146.09
|
+2.99
2.09% |
$147.70
|
831,242
76.68% of 50 DAV
50 DAV is 1,084,000
|
$147.31
-0.83%
|
6/14/2021
|
$112.64
|
PP = $110.01
|
|
MB = $115.51
|
Most Recent Note - 8/26/2021 3:35:17 PM
G - Volume totals have been cooling while holding its ground near its all-time high, extended from any sound base. Near-term support to watch is at its 50 DMA line ($127).
>>> FEATURED STOCK ARTICLE : Wedging Higher and Very Extended From Any Sound Base - 8/16/2021 |
View all notes |
Set NEW NOTE alert |
Company Profile |
SEC
News |
Chart |
Request a new note
C
A
S
I |
CRL
-
NYSE
Charles River Labs Intl
DRUGS - Biotechnology
|
$436.75
|
-0.90
-0.21% |
$443.56
|
222,449
76.71% of 50 DAV
50 DAV is 290,000
|
$439.38
-0.60%
|
6/9/2021
|
$345.91
|
PP = $349.23
|
|
MB = $366.69
|
Most Recent Note - 8/24/2021 6:02:56 PM
G - Extended from any sound base, stubbornly holding its ground. Recent volume totals have been lackluster while wedging into record high territory. Its 50 DMA line ($390) defines near-term support to watch on pullbacks. Three of the past 4 quarterly comparisons through Jun '21 have been above the +25% minimum earnings guideline (C criteria). See the latest FSU analysis for more details and a new annotated graph.
>>> FEATURED STOCK ARTICLE : Wedging Higher With Gains Lacking Volume Conviction - 8/24/2021 |
View all notes |
Set NEW NOTE alert |
Company Profile |
SEC
News |
Chart |
Request a new note
C
A
S
I |
Symbol/Exchange
Company Name
Industry Group |
PRICE |
CHANGE
(%Change) |
Day High |
Volume
(% DAV)
(% 50 day avg vol) |
52 Wk Hi
% From Hi |
Featured
Date |
Price
Featured |
Pivot Featured |
|
Max Buy |
REGN
-
NASDAQ
Regeneron Pharmaceutical
DRUGS - Biotechnology
|
$663.29
|
-2.48
-0.37% |
$673.10
|
422,257
52.85% of 50 DAV
50 DAV is 799,000
|
$674.45
-1.65%
|
8/20/2021
|
$669.82
|
PP = $664.74
|
|
MB = $697.98
|
Most Recent Note - 8/23/2021 12:38:56 PM
Y - Perched at its all-time high today while adding to an impressive spurt of volume-driven gains. Highlighted in yellow with pivot point cited based on its 7/20/20 high plus 10 cents in the 8/20/21 mid-day report. Subsequent gains and a strong close above its pivot point backed by at least +40% above average volume may trigger a technical buy signal.
>>> FEATURED STOCK ARTICLE : Regeneron Featured Hitting a New High - 8/20/2021 |
View all notes |
Set NEW NOTE alert |
Company Profile |
SEC
News |
Chart |
Request a new note
C
A
S
I |
GNRC
-
NYSE
Generac Hldgs Inc
Electrical-Power/Equipmt
|
$437.11
|
+9.64
2.26% |
$442.28
|
736,074
92.70% of 50 DAV
50 DAV is 794,000
|
$457.00
-4.35%
|
6/8/2021
|
$348.46
|
PP = $342.38
|
|
MB = $359.50
|
Most Recent Note - 8/23/2021 6:31:01 PM
G - Closed above its 50 DMA line ($413.80) with today's 4th consecutive gain helping its outlook improve. Fundamentals remain strong. Recent low ($385) defines important near term support to watch. See the latest FSU analysis for more detailed analysis and a new annotated graph.
>>> FEATURED STOCK ARTICLE : Rebound Above 50-Day Moving Average Helps Outlook - 8/23/2021 |
View all notes |
Set NEW NOTE alert |
Company Profile |
SEC
News |
Chart |
Request a new note
C
A
S
I |
CAMT
-
NASDAQ
Camtek Ltd
ELECTRONICS - Scientific and Technical Instrum
|
$41.20
|
+1.23
3.08% |
$41.46
|
111,543
58.40% of 50 DAV
50 DAV is 191,000
|
$41.80
-1.44%
|
8/4/2021
|
$39.67
|
PP = $40.57
|
|
MB = $42.60
|
Most Recent Note - 8/25/2021 12:04:39 PM
Y - Hitting a new all-time high with today's 3rd consecutive gain backed by increasing volume. Color code was changed to yellow while rising near prior highs as it was noted - "Subsequent gains above the pivot point backed by at least +40% above average volume may trigger a proper technical buy signal. Rebounded above its 50 DMA line ($36.32) with a gap up on the prior session. Prior low ($32 30) defines the next important near-term support to watch. Fundamentals remain strong."
>>> FEATURED STOCK ARTICLE : Recent 50-Day Moving Average Violation Again Raised Concerns - 8/17/2021 |
View all notes |
Set NEW NOTE alert |
Company Profile |
SEC
News |
Chart |
Request a new note
C
A
S
I |
PKI
-
NYSE
Perkinelmer Inc
ELECTRONICS - Scientific and Technical Instrum
|
$182.91
|
-0.77
-0.42% |
$186.84
|
438,180
58.50% of 50 DAV
50 DAV is 749,000
|
$188.40
-2.91%
|
8/18/2021
|
$181.07
|
PP = $188.50
|
|
MB = $197.93
|
Most Recent Note - 8/23/2021 6:43:18 PM
Y - Volume totals have been cooling while stubbornly holding its ground after forming a noted "3-weeks tight" base. Color code was changed to yellow with new pivot point cited based on its 8/05/21 high plus 10 cents. Its 50 DMA line ($165.51).and prior high ($162) define important near-term support to watch. Reported earnings +80% on +51% sales revenues for the Jun '21 quarter versus the year ago period.
>>> FEATURED STOCK ARTICLE : Powerful Volume-Driven Breakout After Earnings Report - 7/26/2021 |
View all notes |
Set NEW NOTE alert |
Company Profile |
SEC
News |
Chart |
Request a new note
C
A
S
I |
TRMB
-
NASDAQ
Trimble Inc
ELECTRONICS - Scientific and Technical Instrum
|
$95.71
|
+1.35
1.43% |
$96.38
|
995,472
103.48% of 50 DAV
50 DAV is 962,000
|
$94.77
0.99%
|
8/5/2021
|
$88.83
|
PP = $84.97
|
|
MB = $89.22
|
Most Recent Note - 8/25/2021 5:19:37 PM
G - Color code is changed to green as it hit a new all-time high above its "max buy" level with lighter volume behind today's 6th consecutive gain. Prior highs and its 50 DMA line near ($84) define near-term support to watch on pullbacks. Reported earnings +38% on +29% sales revenues for the Jun '21 quarter versus the year ago period. Three of the past 4 quarterly comparisons were above the +25% minimum earnings guideline (C criteria). Annual earnings (A criteria) growth has been strong and steady.
>>> FEATURED STOCK ARTICLE : Finished Strong With Gain for New High Backed by Volume - 8/5/2021 |
View all notes |
Set NEW NOTE alert |
Company Profile |
SEC
News |
Chart |
Request a new note
C
A
S
I |
Symbol/Exchange
Company Name
Industry Group |
PRICE |
CHANGE
(%Change) |
Day High |
Volume
(% DAV)
(% 50 day avg vol) |
52 Wk Hi
% From Hi |
Featured
Date |
Price
Featured |
Pivot Featured |
|
Max Buy |
UMC
-
NYSE
United Microelectrnc Adr
ELECTRONICS - Semiconductor - Integrated Cir
|
$11.29
|
+0.18
1.62% |
$11.34
|
7,605,677
106.81% of 50 DAV
50 DAV is 7,121,000
|
$11.71
-3.59%
|
8/5/2021
|
$11.62
|
PP = $11.38
|
|
MB = $11.95
|
Most Recent Note - 8/25/2021 12:33:30 PM
Y - Posting a 4th consecutive volume-driven gain today. Tested support at its 50 DMA line ($9.92) with volume-driven losses last week. Stalled since reaching a new 52-week high. A violation of its 50 DMA line would raise concerns and trigger a technical sell signal.
>>> FEATURED STOCK ARTICLE : Taiwan-Based Semiconductor Firm's Breakout Highlighted This Week - 8/6/2021 |
View all notes |
Set NEW NOTE alert |
Company Profile |
SEC
News |
Chart |
Request a new note
C
A
S
I |
ASML
-
NASDAQ
A S M L Holding N.V. NY
ELECTRONICS - Semiconductor Equipment and Mate
|
$832.92
|
+21.98
2.71% |
$834.77
|
658,203
100.64% of 50 DAV
50 DAV is 654,000
|
$815.83
2.09%
|
5/25/2021
|
$669.59
|
PP = $675.75
|
|
MB = $709.54
|
Most Recent Note - 8/25/2021 3:41:21 PM
G - Perched at its all-time high, stubbornly holding its ground. Its 50 DMA line ($735) defines important near-term support to watch on pullbacks.
>>> FEATURED STOCK ARTICLE : Semi Equipment Firm Extended From Any Sound Base - 8/11/2021 |
View all notes |
Set NEW NOTE alert |
Company Profile |
SEC
News |
Chart |
Request a new note
C
A
S
I |
ENTG
-
NASDAQ
Entegris Inc
ELECTRONICS - Semiconductor Equipment and Mate
|
$120.07
|
+3.74
3.21% |
$120.47
|
670,996
102.44% of 50 DAV
50 DAV is 655,000
|
$126.41
-5.02%
|
8/4/2021
|
$125.33
|
PP = $126.51
|
|
MB = $132.84
|
Most Recent Note - 8/26/2021 3:38:56 PM
G - Recent lows in the $109 area define important near-term support above its 200 DMA line. A rebound above the 50 DMA line ($117.91) is needed for its outlook to improve. Subsequent gains and a close above the pivot point backed by at least +40% above average volume may trigger a proper technical buy signal. Fundamentals remain strong as it reported Jun '21 quarterly earnings +42% on +27% sales revenues. Its Relative Strength Rating is 78, below the 80+ minimum guideline for buy candidates.
>>> FEATURED STOCK ARTICLE : Perched Near High After 6th Consecutive Gain - 8/4/2021 |
View all notes |
Set NEW NOTE alert |
Company Profile |
SEC
News |
Chart |
Request a new note
C
A
S
I |
HIBB
-
NASDAQ
Hibbett Inc
SPECIALTY RETAIL - Sporting Goods Stores
|
$89.84
|
-9.13
-9.23% |
$98.44
|
2,308,385
574.23% of 50 DAV
50 DAV is 402,000
|
$100.32
-10.45%
|
8/25/2021
|
$99.58
|
PP = $98.45
|
|
MB = $103.37
|
Most Recent Note - 8/27/2021 12:57:31 PM
Y - Report Jul '21 earnings +0% on -5% sales revenues versus the year ago period, raising fundamental concerns. Volume and volatility often increase near earnings news. Today's big volume driven loss has it slumping back into the prior base and retesting its 50 DMA line ($88.03). Disciplined investors always limit losses by selling any stock that falls more than -8% from their purchase price as Rule #1 of the fact-based investing system.
>>> FEATURED STOCK ARTICLE : Volume-Driven Gain for New High Ahead of Earnings Report - 8/26/2021 |
View all notes |
Set NEW NOTE alert |
Company Profile |
SEC
News |
Chart |
Request a new note
C
A
S
I |
CLFD
-
NASDAQ
Clearfield Inc
TELECOMMUNICATIONS - Cables / Satalite Equipment
|
$46.04
|
+1.65
3.72% |
$46.92
|
101,133
95.41% of 50 DAV
50 DAV is 106,000
|
$46.88
-1.79%
|
7/23/2021
|
$40.23
|
PP = $43.74
|
|
MB = $45.93
|
Most Recent Note - 8/27/2021 5:46:09 PM
G - Posted a gain today with near average volume just reaching a new 52-week high above its "max buy" level and its color code is changed to green. Its 50 DMA line ($39.70) defines important near-term support. Fundamentals remain strong. Bullish action came after it reported Jun '21 quarterly earnings +100% on +49% sales revenues.
>>> FEATURED STOCK ARTICLE : Big Volume-Driven Gain Challenging Prior High After Earnings - 7/23/2021 |
View all notes |
Set NEW NOTE alert |
Company Profile |
SEC
News |
Chart |
Request a new note
C
A
S
I |
Symbol/Exchange
Company Name
Industry Group |
PRICE |
CHANGE
(%Change) |
Day High |
Volume
(% DAV)
(% 50 day avg vol) |
52 Wk Hi
% From Hi |
Featured
Date |
Price
Featured |
Pivot Featured |
|
Max Buy |
POOL
-
NASDAQ
Pool Corp
WHOLESALE - Basic Materials Wholesale
|
$480.91
|
+3.44
0.72% |
$482.68
|
146,011
58.64% of 50 DAV
50 DAV is 249,000
|
$495.22
-2.89%
|
8/19/2021
|
$484.37
|
PP = $495.32
|
|
MB = $520.09
|
Most Recent Note - 8/23/2021 6:35:26 PM
Y - Suffered a big loss today with light volume. Color code was changed to yellow after forming an advanced "3-weeks tight" base. Subsequent gains above the pivot point backed by at least +40% above average volume may trigger a new (or add-on) technical buy signal. Volume totals cooled in recent weeks while stubbornly holding its ground perched at its all-time high. Its 50 DMA line ($467) defines important near-term support to watch on pullbacks.
>>> FEATURED STOCK ARTICLE : Churned Heavy Volume While Testing 50-Day Moving Average - 7/22/2021 |
View all notes |
Set NEW NOTE alert |
Company Profile |
SEC
News |
Chart |
Request a new note
C
A
S
I |
SMPL
-
NASDAQ
Simply Good Foods Co
Food-Confectionery
|
$35.35
|
+1.18
3.45% |
$35.45
|
464,154
102.71% of 50 DAV
50 DAV is 451,900
|
$38.50
-8.18%
|
12/28/2020
|
$30.40
|
PP = $31.44
|
|
MB = $33.01
|
Most Recent Note - 8/27/2021 5:43:08 PM
G - Posted a solid gain today with higher (near average) volume. Remains below its 50 DMA line ($36.36) which is now downward sloping. A rebound above the 50 DMA line is needed for its outlook to improve. Recent low ($33.91 on 8/19/21) defines important support where more damaging losses would raise greater concerns. Reported May '21 quarterly earnings +65% on +32% sales revenues versus the year ago period, well above the +25% minimum earnings guideline (C criteria).
>>> FEATURED STOCK ARTICLE : Pulled Back from High With Small Losses on Light Volume - 7/15/2021 |
View all notes |
Set NEW NOTE alert |
Company Profile |
SEC
News |
Chart |
Request a new note
C
A
S
I |
CTLT
-
NYSE
Catalent Inc
DRUGS - Biotechnology
|
$129.85
|
-0.45
-0.35% |
$131.69
|
1,499,302
215.11% of 50 DAV
50 DAV is 697,000
|
$131.03
-0.90%
|
8/25/2021
|
$128.72
|
PP = $127.78
|
|
MB = $134.17
|
Most Recent Note - 8/27/2021 12:40:18 PM
Y - Inching higher today for another new high, adding to a streak of 6 consecutive small gains marked by increasing volume. Due to report earnings news on 8/30/21. Volume and volatility often increase near earnings news. Prior highs in the $124-127 area define initial support to watch above its 50 DMA line ($116.46).
>>> FEATURED STOCK ARTICLE : Strong Gain Triggered Technical Buy Signal - 8/25/2021 |
View all notes |
Set NEW NOTE alert |
Company Profile |
SEC
News |
Chart |
Request a new note
C
A
S
I |
SQ
-
NYSE
Square Inc Cl A
Finance-CrdtCard/PmtPr
|
$268.01
|
+5.88
2.24% |
$270.48
|
4,603,370
57.31% of 50 DAV
50 DAV is 8,033,000
|
$289.23
-7.34%
|
8/2/2021
|
$273.78
|
PP = $283.29
|
|
MB = $297.45
|
Most Recent Note - 8/25/2021 5:25:32 PM
Y - Volume totals have been cooling in recent weeks since it stalled after reaching a new all-time high. Reported Jun '21 quarterly earnings +267% on +143% sales revenues versus the year ago period, its 4th strong comparison well above the +25% minimum guideline (C criteria).
>>> FEATURED STOCK ARTICLE : Pullback Following Big Gain on Strong Earnings and M&A News - 8/3/2021 |
View all notes |
Set NEW NOTE alert |
Company Profile |
SEC
News |
Chart |
Request a new note
C
A
S
I |
SHOP
-
NYSE
Shopify Inc Cl A
Computer Sftwr-Enterprse
|
$1,531.42
|
+15.84
1.05% |
$1,538.99
|
506,027
37.62% of 50 DAV
50 DAV is 1,345,000
|
$1,650.00
-7.19%
|
7/2/2021
|
$1,468.00
|
PP = $1,552.23
|
|
MB = $1,629.84
|
Most Recent Note - 8/26/2021 6:23:04 PM
Y - Pulled back today with light volume. Finding prompt support while recently consolidating near its 50 DMA line ($1,506). Also tested February 2021 highs which help define important near-term support to watch. More damaging losses would raise concerns and trigger technical sell signals. Fundamentals remain strong.
>>> FEATURED STOCK ARTICLE : Managed a Positive Reversal After Early Weakness - 7/19/2021 |
View all notes |
Set NEW NOTE alert |
Company Profile |
SEC
News |
Chart |
Request a new note
C
A
S
I |
Symbol/Exchange
Company Name
Industry Group |
PRICE |
CHANGE
(%Change) |
Day High |
Volume
(% DAV)
(% 50 day avg vol) |
52 Wk Hi
% From Hi |
Featured
Date |
Price
Featured |
Pivot Featured |
|
Max Buy |
YETI
-
NYSE
Yeti Holdings Inc
Leisure-Products
|
$101.78
|
+0.59
0.58% |
$102.70
|
740,162
74.39% of 50 DAV
50 DAV is 995,000
|
$105.62
-3.64%
|
5/13/2021
|
$84.20
|
PP = $90.65
|
|
MB = $95.18
|
Most Recent Note - 8/24/2021 6:07:34 PM
G - Holding its ground after a pullback last week testing its 50 DMA line ($94.75) which defines near-term support to watch. There was a noted "negative reversal" after hitting a new all-time high on 8/06/21. Reported Jun '21 quarterly earnings +66% on +45% sales revenues versus the year ago period, continuing its strong earnings track record.
>>> FEATURED STOCK ARTICLE : Important Test of 50-Day Moving Average Line - 8/19/2021 |
View all notes |
Set NEW NOTE alert |
Company Profile |
SEC
News |
Chart |
Request a new note
C
A
S
I |
DOCU
-
NASDAQ
Docusign Inc
Computer Sftwr-Enterprse
|
$300.76
|
+5.61
1.90% |
$302.68
|
1,249,237
62.52% of 50 DAV
50 DAV is 1,998,000
|
$314.76
-4.45%
|
7/6/2021
|
$288.96
|
PP = $290.33
|
|
MB = $304.85
|
Most Recent Note - 8/25/2021 3:43:58 PM
Y - Found support at its 50 DMA line ($289) but it has not formed a sound base. A damaging violation would raise greater concerns and trigger a technical sell signal.
>>> FEATURED STOCK ARTICLE : Reversed From High After Recently Wedging Higher Without Volume - 8/13/2021 |
View all notes |
Set NEW NOTE alert |
Company Profile |
SEC
News |
Chart |
Request a new note
C
A
S
I |
JEF
-
NYSE
Jefferies Financial Grp
Finance-Invest Bnk/Bkrs
|
$37.64
|
+0.89
2.42% |
$37.69
|
1,750,455
86.48% of 50 DAV
50 DAV is 2,024,000
|
$37.42
0.59%
|
6/28/2021
|
$31.81
|
PP = $34.42
|
|
MB = $36.14
|
Most Recent Note - 8/23/2021 6:40:15 PM
Y - Gapped up today challenging its all-time high with a solid gain backed by average volume. Its 50 DMA line ($33.10) defines near-term support to watch. More damaging losses would raise concerns and trigger a technical sell signal. As previously noted - "Subsequent gains above the pivot point backed by at least +40% above average volume are necessary to trigger a technical buy signal."
>>> FEATURED STOCK ARTICLE : Quiet Gains for New High Closes - 8/10/2021 |
View all notes |
Set NEW NOTE alert |
Company Profile |
SEC
News |
Chart |
Request a new note
C
A
S
I |
CLAR
-
NASDAQ
Clarus Corporation
Leisure-Products
|
$27.82
|
+0.56
2.05% |
$27.89
|
104,652
49.13% of 50 DAV
50 DAV is 213,000
|
$32.36
-14.03%
|
5/12/2021
|
$21.40
|
PP = $19.73
|
|
MB = $20.72
|
Most Recent Note - 8/25/2021 3:39:49 PM
G - Rebounding above its 50 DMA line ($27.09) helping its technical stance and outlook with today's gain backed by light volume. Fundamentals remain strong.
>>> FEATURED STOCK ARTICLE : Extended From Prior Base and Hitting Another New High - 7/20/2021 |
View all notes |
Set NEW NOTE alert |
Company Profile |
SEC
News |
Chart |
Request a new note
C
A
S
I |
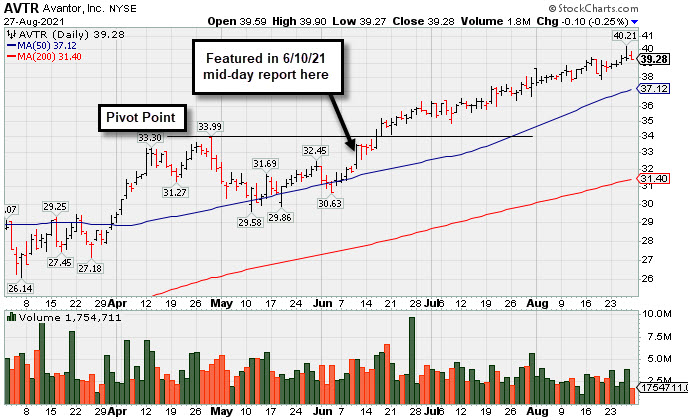
AVTR
-
NYSE
Avantor Inc
Medical-Research Eqp/Svc
|
$39.28
|
-0.10
-0.25% |
$39.90
|
1,754,608
51.47% of 50 DAV
50 DAV is 3,409,000
|
$40.21
-2.31%
|
6/10/2021
|
$32.94
|
PP = $34.09
|
|
MB = $35.79
|
Most Recent Note - 8/27/2021 5:39:43 PM
G - Paused today after wedging into new all-time high territory. Extended from any sound base. Its 50 DMA line ($37.12) defines near-term support to watch on pullbacks. See the latest FSU analysis for more details and a new annotated graph.
>>> FEATURED STOCK ARTICLE : Steady Progress Made Since Featured - 8/27/2021 |
View all notes |
Set NEW NOTE alert |
Company Profile |
SEC
News |
Chart |
Request a new note
C
A
S
I |
Symbol/Exchange
Company Name
Industry Group |
PRICE |
CHANGE
(%Change) |
Day High |
Volume
(% DAV)
(% 50 day avg vol) |
52 Wk Hi
% From Hi |
Featured
Date |
Price
Featured |
Pivot Featured |
|
Max Buy |
MIME
-
NASDAQ
Mimecast Limited
Computer Sftwr-Security
|
$68.65
|
-0.86
-1.24% |
$70.43
|
13,479,203
1,950.68% of 50 DAV
50 DAV is 691,000
|
$71.30
-3.72%
|
8/2/2021
|
$56.12
|
PP = $59.58
|
|
MB = $62.56
|
Most Recent Note - 8/27/2021 1:03:11 PM
G - Perched at its all-time high with today's 6th consecutive gain, very extended from the previously noted base. Disciplined investors avoid buying stocks more than +5% above their pivot point or prior high. Prior highs in the $59 area define initial support to watch on pullbacks. Fundamentals remain strong.
>>> FEATURED STOCK ARTICLE : Perched Not Far From High With Earnings News Due Pre-Open - 8/2/2021 |
View all notes |
Set NEW NOTE alert |
Company Profile |
SEC
News |
Chart |
Request a new note
C
A
S
I |