You are not logged in.
This means you
CAN ONLY VIEW reports that were published prior to Thursday, March 20, 2025.
You
MUST UPGRADE YOUR MEMBERSHIP if you want to see any current reports.
AFTER MARKET UPDATE - THURSDAY, FEBRUARY 28TH, 2019
Previous After Market Report Next After Market Report >>>
|
|
|
|
DOW |
-69.16 |
25,916.00 |
-0.27% |
|
Volume |
1,271,469,350 |
+53% |
|
Volume |
2,633,392,700 |
+9% |
|
NASDAQ |
-21.98 |
7,532.53 |
-0.29% |
|
Advancers |
1,342 |
46% |
|
Advancers |
1,273 |
42% |
|
S&P 500 |
-7.89 |
2,784.49 |
-0.28% |
|
Decliners |
1,591 |
54% |
|
Decliners |
1,788 |
58% |
|
Russell 2000 |
-5.51 |
1,575.55 |
-0.35% |
|
52 Wk Highs |
129 |
|
|
52 Wk Highs |
76 |
|
|
S&P 600 |
-3.18 |
973.71 |
-0.33% |
|
52 Wk Lows |
15 |
|
|
52 Wk Lows |
36 |
|
|
 |
Indices Pulled Back Yet Still Notched Solid February Gains
Kenneth J. Gruneisen - Passed the CAN SLIM® Master's Exam
Despite Thursday’s pullback, the major averages finished the session with their best two-month start to a year since 1987. The S&P 500 added 3% in February, while the Dow climbed 3.7% and the Nasdaq rallied 3.4%. Stocks finished lower Thursday. The Dow lost 69 points to 25,916 while the S&P 500 was down 7 points to 2,784. The Nasdaq Composite slipped 21 points to 7,532. The volume totals reported were higher than the prior session totals on the NYSE and on the Nasdaq exchange, indicative of distributional pressure. Decliners led advancers by an 8-7 margin on the NYSE and nearly 3-2 on the Nasdaq exchange. There were 47 high-ranked companies from the Leaders List that made a new 52-week high and were listed on the BreakOuts Page, versus the total of 37 on the prior session. New 52-week highs outnumbered new 52-week lows on the NYSE and on the Nasdaq exchange. The major indices are in a confirmed uptrend (M criteria) while healthy leadership has underpinned the market. The Featured Stocks Page provides the most timely analysis on high-ranked leaders. Charts used courtesy of www.stockcharts.com
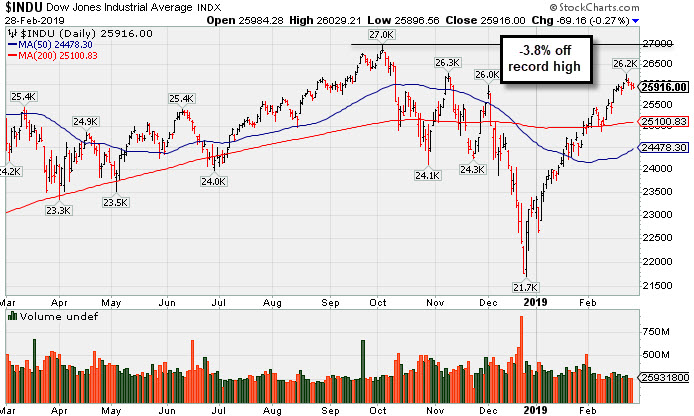
PICTURED: The Dow Jones Industrial Average ended -3.8% below its record high hit on 10/03/18. Progress above its 200-day moving average (DMA) line was noted as technical improvement.
The S&P 500 declined for a fourth-consecutive session despite a positive update on the U.S. economy. A report this morning showed the U.S. GDP grew at a 2.6% annualized pace in the fourth quarter, beating expectations of a 2.2% increase. For the full year 2018, U.S. GDP expanded at a robust 3.1% clip. The strong domestic report was contrasted by an update from China which showed manufacturing activity declined to the slowest pace in three years in February.
Eight of 11 S&P 500 sectors finished lower with Materials and Energy stocks lagging. In earnings, HP Inc. (HPQ -17.27%) fell after missing Wall Street revenue expectations. Meanwhile, Anheuser-Busch InBev (BUD +4.60%) rose as the world’s largest brewer topped analyst earnings projections. In other corporate news, a key shareholder of Bristol-Myers Squibb (BMY +1.37%) announced plan to oppose the company’s $74 billion takeover of Celgene (CELG -8.65%).
Treasury yields rose after the GDP update, with the yield on the benchmark 10-year note climbing three basis point to 2.72%. In commodities, WTI crude added 0.5% to $57.22/barrel. COMEX gold lost 0.4% to $1,315.40/ounce amid a stronger dollar. |
 Kenneth J. Gruneisen started out as a licensed stockbroker in August 1987, a couple of months prior to the historic stock market crash that took the Dow Jones Industrial Average down -22.6% in a single day. He has published daily fact-based fundamental and technical analysis on high-ranked stocks online for two decades. Through FACTBASEDINVESTING.COM, Kenneth provides educational articles, news, market commentary, and other information regarding proven investment systems that work in good times and bad.
Comments contained in the body of this report are technical opinions only and are not necessarily those of Gruneisen Growth Corp. The material herein has been obtained from sources believed to be reliable and accurate, however, its accuracy and completeness cannot be guaranteed. Our firm, employees, and customers may effect transactions, including transactions contrary to any recommendation herein, or have positions in the securities mentioned herein or options with respect thereto. Any recommendation contained in this report may not be suitable for all investors and it is not to be deemed an offer or solicitation on our part with respect to the purchase or sale of any securities. |
|
 |
Financial, Retail, Tech and Commodity-Linked Groups Fell
Kenneth J. Gruneisen - Passed the CAN SLIM® Master's Exam
The Bank Index ($BKX -0.32%), Broker/Dealer Index ($XBD -0.65%), and the Retail Index ($RLX -0.70%) ended unanimously lower. The tech sector had a negative bias as the Biotech Index ($BTK -0.71%) and the Networking Index ($NWX -0.91%) lost ground whikle the Semiconductor Index ($SOX +0.02%) finished flat. The Oil Services Index ($OSX -1.47%) and the Integrated Oil Index ($XOI -1.18%) both finished lower and the Gold & Silver Index ($XAU -0,53%) also finished in the red.
Charts courtesy of www.stockcharts.com
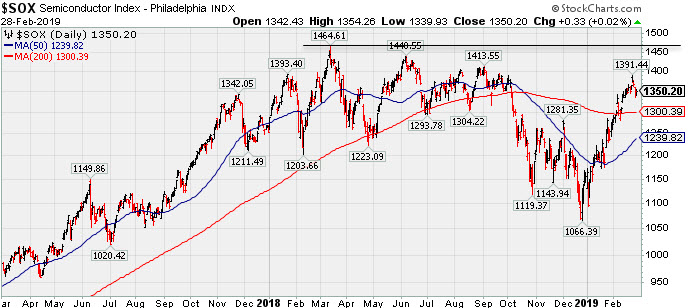 PICTURED: The 2-year graph of the Semiconductor Index ($SOX +0.02%) shows it rebounding toward prior highs from its December '18 low.
| Oil Services |
$OSX |
93.43 |
-1.41 |
-1.49% |
+15.92% |
| Integrated Oil |
$XOI |
1,289.15 |
-15.41 |
-1.18% |
+11.22% |
| Semiconductor |
$SOX |
1,350.20 |
+0.33 |
+0.02% |
+16.88% |
| Networking |
$NWX |
588.77 |
-5.41 |
-0.91% |
+20.49% |
| Broker/Dealer |
$XBD |
266.66 |
-1.74 |
-0.65% |
+12.35% |
| Retail |
$RLX |
2,136.23 |
-15.03 |
-0.70% |
+9.47% |
| Gold & Silver |
$XAU |
75.85 |
-0.41 |
-0.54% |
+7.35% |
| Bank |
$BKX |
100.13 |
-0.32 |
-0.32% |
+16.72% |
| Biotech |
$BTK |
5,105.00 |
-36.59 |
-0.71% |
+20.95% |
|
|
|
 |
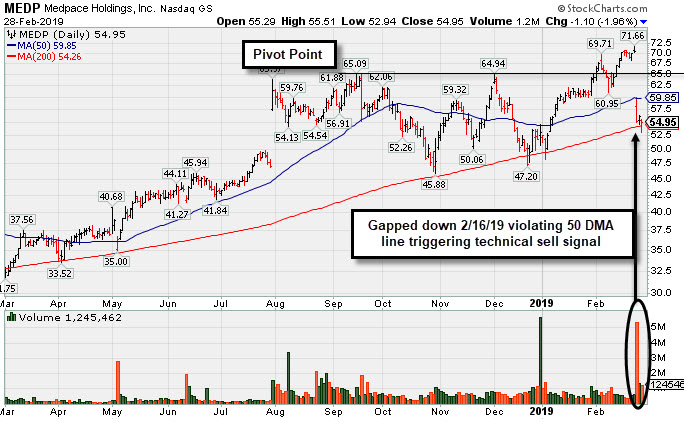
Damaging Gap Down Triggered Technical Sell Signal
Kenneth J. Gruneisen - Passed the CAN SLIM® Master's Exam
Medpace Holdings Inc (MEDP -$1.10 or -1.96% to $54.95) is sputtering near its 200-day moving average (DMA) line ($54.26). More damaging losses would raise greater concerns. It gapped down on 2/26/19 following earnings news, negating the recent breakout and violating its 50 DMA line ($60) with a damaging volume-driven loss triggering a technical sell signal. A rebound above the 50 DMA line is needed for its outlook to improve.
Fundamentals remain strong. It reported earnings +95% on +71% sales revenues for the Dec '18 quarter. continuing its strong earnings track record. MEDP was highlighted in yellow with pivot point cited based on its 9/17/18 high plus 10 cents in the 1/30/19 mid-day report (read here) and shown in this FSU section that evening with an annotated graph under the headline, "Rallied Near 52-Week High With a Volume-Driven Gain".
The high-ranked Medical-Research Eqp/Svc firm reported 4 consecutive comparisons above the +25% minimum earnings guideline (C criteria). Its annual earnings (A criteria) history has been strong and it has a 97 Earnings Per Share Rating, putting it in the top 5% of all publicly traded companies.
The number of top-rated funds owning its shares rose from 188 in Dec '17 to 435 in Dec '18, a reassuring sign concerning the I criteria. Its current Up/Down Volume Ratio of 1.1 is an unbiased indication its shares have been under slight accumulation over the past 50 days. It has earned a Timeliness Rating of A and Sponsorship rating of B. Proposed yet another Secondary Offering on 8/07/18. Completed Secondary Offerings on 6/12/18, 5/04/18, and 12/01/17.
Charts courtesy of www.stockcharts.com |
|
|
Color Codes Explained :
Y - Better candidates highlighted by our
staff of experts.
G - Previously featured
in past reports as yellow but may no longer be buyable under the
guidelines.
***Last / Change / Volume data in this table is the closing quote data***
Symbol/Exchange
Company Name
Industry Group |
PRICE |
CHANGE
(%Change) |
Day High |
Volume
(% DAV)
(% 50 day avg vol) |
52 Wk Hi
% From Hi |
Featured
Date |
Price
Featured |
Pivot Featured |
|
Max Buy |
MLR
-
NYSE
Miller Industries Inc
AUTOMOTIVE - Auto Parts
|
$33.91
|
-0.57
-1.65% |
$34.72
|
37,395
113.32% of 50 DAV
50 DAV is 33,000
|
$34.81
-2.59%
|
11/30/2018
|
$28.35
|
PP = $29.50
|
|
MB = $30.98
|
Most Recent Note - 2/25/2019 12:55:04 PM
G - Very extended from the prior base and hitting another new all-time high with today's 9th consecutive gain. Prior highs and its 50 DMA line ($28.99) define near-term support to watch on pullbacks.
>>> FEATURED STOCK ARTICLE : Traded Above Pivot Point Recently Without Great Volume - 1/29/2019 |
View all notes |
Set NEW NOTE alert |
Company Profile |
SEC
News |
Chart |
Request a new note
C
A
S
I |
NSP
-
NYSE
Insperity Inc
Comml Svcs-Outsourcing
|
$126.27
|
+0.22
0.17% |
$127.83
|
303,709
82.31% of 50 DAV
50 DAV is 369,000
|
$132.50
-4.70%
|
2/11/2019
|
$127.91
|
PP = $121.25
|
|
MB = $127.31
|
Most Recent Note - 2/27/2019 1:54:41 PM
Y - Volume totals have been cooling and its color code is changed to yellow after pulling back below its "max buy" level. Prior highs in the $119-121 area define initial support to watch on pullbacks.
>>> FEATURED STOCK ARTICLE : Big Breakaway Gap Triggered Technical Buy Signal - 2/11/2019 |
View all notes |
Set NEW NOTE alert |
Company Profile |
SEC
News |
Chart |
Request a new note
C
A
S
I |
ZBRA
-
NASDAQ
Zebra Tech Corp Cl A
COMPUTER HARDWARE - Computer Peripherals
|
$200.51
|
-1.97
-0.97% |
$202.61
|
327,054
61.25% of 50 DAV
50 DAV is 534,000
|
$207.88
-3.55%
|
2/14/2019
|
$198.10
|
PP = $184.85
|
|
MB = $194.09
|
 Most Recent Note - 2/28/2019 11:53:42 AM
G - Stubbornly holding its ground with volume totals cooling, extended from the prior base. Prior highs in the $184 area define initial support to watch on pullbacks.
>>> FEATURED STOCK ARTICLE : Big Volume-Driven Gain for New High - 2/14/2019 |
View all notes |
Set NEW NOTE alert |
Company Profile |
SEC
News |
Chart |
Request a new note
C
A
S
I |
SPSC
-
NASDAQ
S P S Commerce Inc
COMPUTER SOFTWARE and SERVICES - Application Software
|
$106.78
|
-0.61
-0.57% |
$108.33
|
187,836
109.21% of 50 DAV
50 DAV is 172,000
|
$113.31
-5.76%
|
2/13/2019
|
$104.30
|
PP = $100.78
|
|
MB = $105.82
|
Most Recent Note - 2/26/2019 6:42:40 PM
G - Pulled back today but remains above its "max buy" level, extended from the previously noted base. Prior highs in the $100 area define initial support to watch.
>>> FEATURED STOCK ARTICLE : Gap Up and Big Volume Driven Gain for New High - 2/13/2019 |
View all notes |
Set NEW NOTE alert |
Company Profile |
SEC
News |
Chart |
Request a new note
C
A
S
I |
SSNC
-
NASDAQ
S S & C Technologies
COMPUTER SOFTWARE and SERVICES - Application Software
|
$61.58
|
-0.10
-0.16% |
$61.87
|
1,653,440
83.85% of 50 DAV
50 DAV is 1,972,000
|
$62.43
-1.36%
|
2/15/2019
|
$59.73
|
PP = $61.07
|
|
MB = $64.12
|
Most Recent Note - 2/25/2019 1:27:24 PM
Y - Hit a new high and rallied above the pivot point with above average volume behind today's gain. Stubbornly held its ground after highlighted in yellow in the 2/15/19 mid-day report.
>>> FEATURED STOCK ARTICLE : Volume-Driven Gain for New High Close - 2/19/2019 |
View all notes |
Set NEW NOTE alert |
Company Profile |
SEC
News |
Chart |
Request a new note
C
A
S
I |
Symbol/Exchange
Company Name
Industry Group |
PRICE |
CHANGE
(%Change) |
Day High |
Volume
(% DAV)
(% 50 day avg vol) |
52 Wk Hi
% From Hi |
Featured
Date |
Price
Featured |
Pivot Featured |
|
Max Buy |
IRBT
-
NASDAQ
Irobot Corp
CONSUMER DURABLES - Electronic Equipment
|
$125.06
|
+0.99
0.80% |
$125.53
|
631,727
77.70% of 50 DAV
50 DAV is 813,000
|
$124.74
0.26%
|
2/8/2019
|
$104.92
|
PP = $103.63
|
|
MB = $108.81
|
Most Recent Note - 2/25/2019 12:44:24 PM
G - Remains perched at its all-time high today stubbornly holding its ground after an impressive streak of 10 consecutive gains. Recent gains have lacked great volume conviction. It is extended from the previously noted "double bottom" base. Prior high ($103) defines initial support to watch on pullbacks.
>>> FEATURED STOCK ARTICLE : Volume-Driven Gains Cleared Prior High After Double Bottom - 2/8/2019 |
View all notes |
Set NEW NOTE alert |
Company Profile |
SEC
News |
Chart |
Request a new note
C
A
S
I |
LHCG
-
NASDAQ
L H C Group Inc
HEALTH SERVICES - Home Health Care
|
$109.69
|
+3.30
3.10% |
$114.19
|
576,277
218.29% of 50 DAV
50 DAV is 264,000
|
$114.22
-3.97%
|
1/23/2019
|
$107.29
|
PP = $107.61
|
|
MB = $112.99
|
Most Recent Note - 2/28/2019 12:48:04 PM
Y - Managed a "positive reversal" after a gap down today. Reported earnings +66% on +75% sales revenues for the Dec '18 quarter. Volume and volatility often increase near earnings news. Recent gains into new high territory lacked great volume conviction. A solid gain and close above the pivot point backed by at least +40% above average volume may help clinch a convincing technical buy signal.
>>> FEATURED STOCK ARTICLE : Recent Gains for New Highs Lacked Great Volume Conviction - 2/21/2019 |
View all notes |
Set NEW NOTE alert |
Company Profile |
SEC
News |
Chart |
Request a new note
C
A
S
I |
ENSG
-
NASDAQ
Ensign Group Inc
HEALTH SERVICES - Long-Term Care Facilities
|
$49.45
|
+0.05
0.10% |
$50.09
|
230,260
62.23% of 50 DAV
50 DAV is 370,000
|
$54.56
-9.37%
|
2/7/2019
|
$48.71
|
PP = $49.06
|
|
MB = $51.51
|
Most Recent Note - 2/26/2019 6:35:50 PM
Y - Pulled back today with lighter volume. Prior highs in the $48 area define initial support to watch.
>>> FEATURED STOCK ARTICLE : Closed Near Pivot Point After Gap Up and Big Volume-Driven Gain - 2/7/2019 |
View all notes |
Set NEW NOTE alert |
Company Profile |
SEC
News |
Chart |
Request a new note
C
A
S
I |
NXST
-
NASDAQ
Nexstar Media Group Cl A
MEDIA - Broadcasting - TV
|
$97.73
|
+2.24
2.35% |
$98.25
|
811,702
144.69% of 50 DAV
50 DAV is 561,000
|
$96.75
1.01%
|
2/26/2019
|
$94.26
|
PP = $89.76
|
|
MB = $94.25
|
Most Recent Note - 2/26/2019 6:34:23 PM
Y - Finished strong after highlighted in yellow with pivot point cited based on its 12/04/18 high plus 10 cents in the earlier mid-day report. Hit a new 52-week high with today's big gain backed by +99% above average volume, clinching a technical buy signal. Recent quarterly comparisons through Dec '18 showed strong earnings increases above the +25% minimum guideline (C criteria) versus the year ago periods with encouraging sales revenues acceleration. See the latest FSU analysis for more details and a new annotated graph.
>>> FEATURED STOCK ARTICLE : Twice Average Volume Behind Gain for New High - 2/26/2019 |
View all notes |
Set NEW NOTE alert |
Company Profile |
SEC
News |
Chart |
Request a new note
C
A
S
I |
BSTC
-
NASDAQ
Biospecifics Technologie
Medical-Biomed/Biotech
|
$69.45
|
+0.85
1.24% |
$70.14
|
38,515
85.59% of 50 DAV
50 DAV is 45,000
|
$73.31
-5.27%
|
1/18/2019
|
$67.40
|
PP = $66.31
|
|
MB = $69.63
|
Most Recent Note - 2/25/2019 6:06:05 PM
Y - Color code is changed to yellow as this thinly-traded Biomed/Biotech firm is encountering mild distributional pressure while pulling back below its "max buy" level. Prior highs and its 50 DMA line define near-term support to watch on pullbacks.
>>> FEATURED STOCK ARTICLE : Reversed Into Red After Hitting a New High - 2/5/2019 |
View all notes |
Set NEW NOTE alert |
Company Profile |
SEC
News |
Chart |
Request a new note
C
A
S
I |
Symbol/Exchange
Company Name
Industry Group |
PRICE |
CHANGE
(%Change) |
Day High |
Volume
(% DAV)
(% 50 day avg vol) |
52 Wk Hi
% From Hi |
Featured
Date |
Price
Featured |
Pivot Featured |
|
Max Buy |
UBNT
-
NASDAQ
Ubiquiti Networks
TELECOMMUNICATIONS - Diversified Communication Serv
|
$144.39
|
-3.14
-2.13% |
$147.98
|
391,829
98.70% of 50 DAV
50 DAV is 397,000
|
$148.68
-2.89%
|
2/8/2019
|
$121.97
|
PP = $115.54
|
|
MB = $121.32
|
Most Recent Note - 2/27/2019 1:56:47 PM
G - Very extended from the prior base with today's 13th consecutive gain. Bullish action came after it reported earnings +75% on +23% sales revenues for the Dec '18 quarter. Prior high ($115) defines initial support to watch on pullbacks.
>>> FEATURED STOCK ARTICLE : Consolidating Above 50-Day Moving Average - 1/31/2019 |
View all notes |
Set NEW NOTE alert |
Company Profile |
SEC
News |
Chart |
Request a new note
C
A
S
I |
NOW
-
NYSE
Servicenow Inc
Computer Sftwr-Enterprse
|
$239.44
|
-0.87
-0.36% |
$241.44
|
1,866,802
84.74% of 50 DAV
50 DAV is 2,203,000
|
$240.86
-0.59%
|
1/31/2019
|
$218.14
|
PP = $206.40
|
|
MB = $216.72
|
Most Recent Note - 2/28/2019 11:55:24 AM
G - Stubbornly held its ground in recent weeks and it touched another new all-time high today. Prior high ($206) defines initial support to watch on pullbacks.
>>> FEATURED STOCK ARTICLE : Breakaway Gap Followed Strong Earnings Report - 2/1/2019 |
View all notes |
Set NEW NOTE alert |
Company Profile |
SEC
News |
Chart |
Request a new note
C
A
S
I |
PANW
-
NYSE
Palo Alto Networks
Computer Sftwr-Security
|
$246.27
|
-8.61
-3.38% |
$255.00
|
2,559,258
181.12% of 50 DAV
50 DAV is 1,413,000
|
$260.63
-5.51%
|
2/25/2019
|
$233.54
|
PP = $239.60
|
|
MB = $251.58
|
Most Recent Note - 2/28/2019 12:52:15 PM
Y - Pulling back today. Hit a new all-time high with a big "breakaway gap" on the prior session clinching a technical buy signal while rising from a 23-week cup shaped base. Prior high ($239) defines initial support to watch on pullbacks. Reported earnings +44% on +30% sales revenues for the Jan '19 quarter, continuing its strong earnings track record.
>>> FEATURED STOCK ARTICLE : Rebounded Near Prior High With Earnings News Due - 2/25/2019 |
View all notes |
Set NEW NOTE alert |
Company Profile |
SEC
News |
Chart |
Request a new note
C
A
S
I |
PAYC
-
NYSE
Paycom Software Inc
COMPUTER SOFTWARE and SERVICES - Application Software
|
$181.73
|
-0.99
-0.54% |
$183.81
|
203,352
31.05% of 50 DAV
50 DAV is 655,000
|
$186.00
-2.30%
|
2/6/2019
|
$171.66
|
PP = $164.18
|
|
MB = $172.39
|
Most Recent Note - 2/28/2019 11:57:46 AM
G - Volume totals have been cooling while hovering near its all-time high, extended from any sound base. Prior high ($164) defines initial support to watch above its 50 DMA line.
>>> FEATURED STOCK ARTICLE : Breakaway Gap Backed by Volume +388% Above Average - 2/6/2019 |
View all notes |
Set NEW NOTE alert |
Company Profile |
SEC
News |
Chart |
Request a new note
C
A
S
I |
PYPL
-
NASDAQ
Paypal Holdings Inc
Finance-CrdtCard/PmtPr
|
$98.07
|
+0.21
0.21% |
$98.53
|
5,822,646
66.80% of 50 DAV
50 DAV is 8,716,000
|
$98.04
0.03%
|
1/24/2019
|
$92.56
|
PP = $93.80
|
|
MB = $98.49
|
Most Recent Note - 2/28/2019 11:42:44 AM
Y - Lighter than average volume has been behind recent gains while wedging into new high territory, not volume indicative of great institutional buying demand. Prior highs in the $92 area define support above its 50 DMA line.
>>> FEATURED STOCK ARTICLE : Wedging into New High Territory With Gains Lacking Volume - 2/22/2019 |
View all notes |
Set NEW NOTE alert |
Company Profile |
SEC
News |
Chart |
Request a new note
C
A
S
I |
Symbol/Exchange
Company Name
Industry Group |
PRICE |
CHANGE
(%Change) |
Day High |
Volume
(% DAV)
(% 50 day avg vol) |
52 Wk Hi
% From Hi |
Featured
Date |
Price
Featured |
Pivot Featured |
|
Max Buy |
ALRM
-
NASDAQ
Alarm.com Holdings Inc
Security/Sfty
|
$65.63
|
+0.58
0.89% |
$65.85
|
688,862
134.28% of 50 DAV
50 DAV is 513,000
|
$65.65
-0.03%
|
1/22/2019
|
$60.52
|
PP = $60.30
|
|
MB = $63.32
|
Most Recent Note - 2/27/2019 1:47:55 PM
G - Due to report earnings news after the close on Thursday, February 28th. Volume and volatility often increase near earnings news. Volume totals have been cooling in recent weeks while still stubbornly holding its ground in a tight range perched near its all-time high. Prior highs in the $60 area define initial support above its 50 DMA line.
>>> FEATURED STOCK ARTICLE : Volume Totals Cooling While Perched at All-Time High - 2/20/2019 |
View all notes |
Set NEW NOTE alert |
Company Profile |
SEC
News |
Chart |
Request a new note
C
A
S
I |
PLNT
-
NYSE
Planet Fitness Inc Cl A
Leisure-Services
|
$58.78
|
+0.33
0.56% |
$59.08
|
1,906,717
138.27% of 50 DAV
50 DAV is 1,379,000
|
$61.90
-5.04%
|
11/7/2018
|
$57.10
|
PP = $55.45
|
|
MB = $58.22
|
Most Recent Note - 2/27/2019 5:59:44 PM
G - Color code is changed to green after a gain above its "max buy" level as it met distributional pressure after hitting another new all-time high. Found support near its 50 DMA line ($56.52) and recent low. Reported earnings +42% on +30% sales revenues for the Dec '18 quarter. Volume and volatility often increase near earnings news. See the latest FSU analysis for additional details and a new annotated graph.
>>> FEATURED STOCK ARTICLE : Met Distributional Pressure While Hitting New High After Earnings - 2/27/2019 |
View all notes |
Set NEW NOTE alert |
Company Profile |
SEC
News |
Chart |
Request a new note
C
A
S
I |
TEAM
-
NASDAQ
Atlassian Corp Plc Cl A
Comp Sftwr-Spec Enterprs
|
$107.48
|
+1.15
1.08% |
$107.96
|
1,736,434
101.01% of 50 DAV
50 DAV is 1,719,000
|
$107.95
-0.44%
|
1/7/2019
|
$94.68
|
PP = $98.31
|
|
MB = $103.23
|
Most Recent Note - 2/25/2019 6:18:26 PM
G - Gapped up and posted a small gain with below average volume for a new all-time high. Recent gains lacked great volume conviction. Its prior high ($98.21) and 50 DMA line ($94.07) define near-term support to watch on pullbacks. Fundamentals remain strong.
>>> FEATURED STOCK ARTICLE : Volume Light While Hovering Near High - 1/28/2019 |
View all notes |
Set NEW NOTE alert |
Company Profile |
SEC
News |
Chart |
Request a new note
C
A
S
I |
GLOB
-
NYSE
Globant SA
Computer-Tech Services
|
$68.89
|
-0.52
-0.75% |
$69.39
|
256,408
109.11% of 50 DAV
50 DAV is 235,000
|
$74.00
-6.91%
|
2/15/2019
|
$69.35
|
PP = $70.00
|
|
MB = $73.50
|
Most Recent Note - 2/28/2019 11:51:13 AM
Y - Stalled after recently rallying from an advanced "3-weeks tight" base. Prior low ($65.73 on 2/08/19) defines near-term support above its 50 DMA line ($63.45).
>>> FEATURED STOCK ARTICLE : Volume-Driven Gain From Advanced "3-Weeks Tight" Base - 2/15/2019 |
View all notes |
Set NEW NOTE alert |
Company Profile |
SEC
News |
Chart |
Request a new note
C
A
S
I |
TTD
-
NASDAQ
The Trade Desk Inc Cl A
Comml Svcs-Advertising
|
$197.54
|
+2.54
1.30% |
$198.95
|
1,495,138
111.33% of 50 DAV
50 DAV is 1,343,000
|
$202.30
-2.35%
|
2/6/2019
|
$148.65
|
PP = $149.00
|
|
MB = $156.45
|
Most Recent Note - 2/26/2019 12:58:20 PM
G - Holding its ground near its all-time high. Color code was changed to green after a gap up and considerable gain above its "max buy" level backed by heavy volume. Bullish action on the prior session came after it reported earnings +102% on +56% sales revenues for the Dec '18 quarter.
>>> FEATURED STOCK ARTICLE : Near High After Third Consecutive Gain with Light Volume - 2/12/2019 |
View all notes |
Set NEW NOTE alert |
Company Profile |
SEC
News |
Chart |
Request a new note
C
A
S
I |
Symbol/Exchange
Company Name
Industry Group |
PRICE |
CHANGE
(%Change) |
Day High |
Volume
(% DAV)
(% 50 day avg vol) |
52 Wk Hi
% From Hi |
Featured
Date |
Price
Featured |
Pivot Featured |
|
Max Buy |
MEDP
-
NASDAQ
Medpace Holdings Inc
Medical-Research Eqp/Svc
|
$54.95
|
-1.10
-1.96% |
$55.51
|
1,235,447
140.39% of 50 DAV
50 DAV is 880,000
|
$71.66
-23.32%
|
1/30/2019
|
$64.10
|
PP = $65.19
|
|
MB = $68.45
|
Most Recent Note - 2/28/2019 12:00:15 PM
G - Sputtering near its 200 DMA line ($54.26). Gapped down on 2/26/19 following earnings news, negating the recent breakout and violating its 50 DMA line ($60) with a damaging volume-driven loss triggering a technical sell signal. Reported earnings +95% on +71% sales revenues for the Dec '18 quarter. continuing its strong earnings track record. A rebound above the 50 DMA line is needed for its outlook to improve.
>>> FEATURED STOCK ARTICLE : Damaging Gap Down Triggered Technical Sell Signal - 2/28/2019 |
View all notes |
Set NEW NOTE alert |
Company Profile |
SEC
News |
Chart |
Request a new note
C
A
S
I |
|
|
|
THESE ARE NOT BUY RECOMMENDATIONS!
Comments contained in the body of this report are technical
opinions only. The material herein has been obtained
from sources believed to be reliable and accurate, however,
its accuracy and completeness cannot be guaranteed.
This site is not an investment advisor, hence it does
not endorse or recommend any securities or other investments.
Any recommendation contained in this report may not
be suitable for all investors and it is not to be deemed
an offer or solicitation on our part with respect to
the purchase or sale of any securities. All trademarks,
service marks and trade names appearing in this report
are the property of their respective owners, and are
likewise used for identification purposes only.
This report is a service available
only to active Paid Premium Members.
You may opt-out of receiving report notifications
at any time. Questions or comments may be submitted
by writing to Premium Membership Services 665 S.E. 10 Street, Suite 201 Deerfield Beach, FL 33441-5634 or by calling 1-800-965-8307
or 954-785-1121.
|
|
|