***Last / Change / Volume data in this table is the closing quote data***
Symbol/Exchange
Company Name
Industry Group |
PRICE |
CHANGE
(%Change) |
Day High |
Volume
(% DAV)
(% 50 day avg vol) |
52 Wk Hi
% From Hi |
Featured
Date |
Price
Featured |
Pivot Featured |
|
Max Buy |
 SIVB
-
NASDAQ
SIVB
-
NASDAQ
S V B Financial Group
BANKING - Regional - Pacific Banks
|
$564.59
|
+5.09
0.91% |
$565.20
|
305,349
78.29% of 50 DAV
50 DAV is 390,000
|
$608.84
-7.27%
|
8/6/2021
|
$589.70
|
PP = $608.94
|
|
MB = $639.39
|
Most Recent Note - 8/30/2021 5:10:55 PM
G - Color code is changed to green after slumping back below its 50 DMA line ($565) with today's loss backed by light volume. Only a prompt rebound above the 50 DMA line would help its outlook improve. Prior lows in the $530 area define the next important near-term support to watch. Completed a new Public Offering on 8/11/21.
>>> FEATURED STOCK ARTICLE : Consolidating Near Prior Highs Facing Little Resistance - 8/9/2021 |
View all notes |
Set NEW NOTE alert |
Company Profile |
SEC
News |
Chart |
Request a new note
C
A
S
I |
BLDR
-
NYSE
Builders Firstsource Inc
Bldg-Constr Prds/Misc
|
$53.59
|
+0.30
0.56% |
$54.07
|
2,187,369
71.53% of 50 DAV
50 DAV is 3,058,000
|
$53.99
-0.74%
|
8/12/2021
|
$52.38
|
PP = $54.09
|
|
MB = $56.79
|
Most Recent Note - 8/27/2021 5:41:13 PM
Y - Posted another gain today with below average volume for a best-ever close. Highlighted in yellow with pivot point cited based on its 5/10/21 high plus 10 cents in the 8/12/21 mid-day report. Subsequent gains above the pivot point backed by at least +40% above average volume may trigger a technical buy signal. Found support near its 200 DMA line. Fundamentals remain strong.
>>> FEATURED STOCK ARTICLE : Rebounding Near Prior High After Another Strong Quarter - 8/12/2021 |
View all notes |
Set NEW NOTE alert |
Company Profile |
SEC
News |
Chart |
Request a new note
C
A
S
I |
SNPS
-
NASDAQ
Synopsys Inc
COMPUTER SOFTWARE and SERVICES - Technical and System Software
|
$333.63
|
+1.39
0.42% |
$335.00
|
687,787
97.28% of 50 DAV
50 DAV is 707,000
|
$335.01
-0.41%
|
8/18/2021
|
$293.22
|
PP = $301.01
|
|
MB = $316.06
|
 Most Recent Note - 9/1/2021 5:39:59 PM
G - Perched at its all-time high stubbornly holding its ground after a streak of gains. Prior high in the $300 area defines initial support to watch on pullbacks.
>>> FEATURED STOCK ARTICLE : Latest Earnings Report Missed the +25% Minimum Guideline - 8/18/2021 |
View all notes |
Set NEW NOTE alert |
Company Profile |
SEC
News |
Chart |
Request a new note
C
A
S
I |
CROX
-
NASDAQ
Crocs Inc
CONSUMER NON-DURABLES - Textile - Apparel Footwear
|
$143.36
|
+0.54
0.38% |
$146.04
|
863,695
82.73% of 50 DAV
50 DAV is 1,044,000
|
$147.76
-2.98%
|
6/14/2021
|
$112.64
|
PP = $110.01
|
|
MB = $115.51
|
Most Recent Note - 8/31/2021 4:41:39 PM
G - Volume totals have been below average while holding its ground near its all-time high, extended from any sound base. Near-term support to watch is at its 50 DMA line ($129.43).
>>> FEATURED STOCK ARTICLE : Wedging Higher and Very Extended From Any Sound Base - 8/16/2021 |
View all notes |
Set NEW NOTE alert |
Company Profile |
SEC
News |
Chart |
Request a new note
C
A
S
I |
CRL
-
NYSE
Charles River Labs Intl
DRUGS - Biotechnology
|
$443.79
|
-0.07
-0.02% |
$445.30
|
264,274
99.73% of 50 DAV
50 DAV is 265,000
|
$447.08
-0.74%
|
6/9/2021
|
$345.91
|
PP = $349.23
|
|
MB = $366.69
|
Most Recent Note - 8/30/2021 5:09:04 PM
G - Posted another gain with light volume for a new all-time high. Very extended from any sound base, stubbornly holding its ground. Recent volume totals have been lackluster while wedging into record high territory. Its 50 DMA line ($397) defines near-term support to watch on pullbacks. Fundamentals remain strong.
>>> FEATURED STOCK ARTICLE : Wedging Higher With Gains Lacking Volume Conviction - 8/24/2021 |
View all notes |
Set NEW NOTE alert |
Company Profile |
SEC
News |
Chart |
Request a new note
C
A
S
I |
Symbol/Exchange
Company Name
Industry Group |
PRICE |
CHANGE
(%Change) |
Day High |
Volume
(% DAV)
(% 50 day avg vol) |
52 Wk Hi
% From Hi |
Featured
Date |
Price
Featured |
Pivot Featured |
|
Max Buy |
REGN
-
NASDAQ
Regeneron Pharmaceutical
DRUGS - Biotechnology
|
$680.96
|
+7.56
1.12% |
$686.28
|
783,779
98.84% of 50 DAV
50 DAV is 793,000
|
$681.73
-0.11%
|
8/20/2021
|
$669.82
|
PP = $664.74
|
|
MB = $697.98
|
Most Recent Note - 8/30/2021 5:05:27 PM
Y - Posted a gain today with near average volume for a new all-time high. Stubbornly held its ground after an impressive spurt of volume-driven gains. Highlighted in yellow with pivot point cited based on its 7/20/20 high plus 10 cents in the 8/20/21 mid-day report. Subsequent gains and a strong close above its pivot point backed by at least +40% above average volume may trigger a technical buy signal.
>>> FEATURED STOCK ARTICLE : Regeneron Featured Hitting a New High - 8/20/2021 |
View all notes |
Set NEW NOTE alert |
Company Profile |
SEC
News |
Chart |
Request a new note
C
A
S
I |
GNRC
-
NYSE
Generac Hldgs Inc
Electrical-Power/Equipmt
|
$438.71
|
+1.73
0.40% |
$442.84
|
621,806
79.92% of 50 DAV
50 DAV is 778,000
|
$458.10
-4.23%
|
8/30/2021
|
$449.36
|
PP = $457.10
|
|
MB = $479.96
|
Most Recent Note - 8/30/2021 12:38:54 PM
Y - Color code is changed to yellow with new pivot point cited based on its 7/26/21 high plus 10 cents after as short 5-week flat base. Hitting a new 52-week high with today's 9th consecutive gain. A gain and strong close above the pivot point backed by at least +40% above average volume may trigger a new (or add-on) technical buy signal. Fundamentals remain strong. Recent low ($385) defines important near term support to watch.
>>> FEATURED STOCK ARTICLE : Rebound Above 50-Day Moving Average Helps Outlook - 8/23/2021 |
View all notes |
Set NEW NOTE alert |
Company Profile |
SEC
News |
Chart |
Request a new note
C
A
S
I |
CAMT
-
NASDAQ
Camtek Ltd
ELECTRONICS - Scientific and Technical Instrum
|
$40.91
|
-0.42
-1.02% |
$41.38
|
87,215
49.00% of 50 DAV
50 DAV is 178,000
|
$42.39
-3.49%
|
8/4/2021
|
$39.67
|
PP = $40.57
|
|
MB = $42.60
|
Most Recent Note - 9/1/2021 5:38:39 PM
Y - Hovering near its all-time high with today's small loss on light volume. Big gain above the pivot point on 8/25/21 backed by +116% above average volume triggered a proper technical buy signal. Its 50 DMA line ($36.91) and prior low ($34.68 on 8/17/21) define important near-term support to watch. Fundamentals remain strong.
>>> FEATURED STOCK ARTICLE : Recent 50-Day Moving Average Violation Again Raised Concerns - 8/17/2021 |
View all notes |
Set NEW NOTE alert |
Company Profile |
SEC
News |
Chart |
Request a new note
C
A
S
I |
PKI
-
NYSE
Perkinelmer Inc
ELECTRONICS - Scientific and Technical Instrum
|
$188.01
|
+3.21
1.74% |
$188.68
|
452,087
61.34% of 50 DAV
50 DAV is 737,000
|
$189.31
-0.69%
|
8/18/2021
|
$181.07
|
PP = $188.50
|
|
MB = $197.93
|
Most Recent Note - 8/30/2021 5:02:11 PM
Y - Hit a new all-time high with today's gain backed by light volume. After forming a noted "3-weeks tight" base its color code was changed to yellow with new pivot point cited based on its 8/05/21 high plus 10 cents. Its 50 DMA line ($169).and prior high ($162) define important near-term support to watch. Fundamentals remain strong.
>>> FEATURED STOCK ARTICLE : Powerful Volume-Driven Breakout After Earnings Report - 7/26/2021 |
View all notes |
Set NEW NOTE alert |
Company Profile |
SEC
News |
Chart |
Request a new note
C
A
S
I |
TRMB
-
NASDAQ
Trimble Inc
ELECTRONICS - Scientific and Technical Instrum
|
$93.75
|
-0.47
-0.50% |
$94.80
|
2,256,041
241.55% of 50 DAV
50 DAV is 934,000
|
$96.49
-2.84%
|
8/5/2021
|
$88.83
|
PP = $84.97
|
|
MB = $89.22
|
Most Recent Note - 9/1/2021 1:09:46 PM
G - Perched near its all-time high after wedging higher with gains lacking great volume conviction. Its 50 DMA line ($86) defines near-term support above prior highs in the $84 area. Reported earnings +38% on +29% sales revenues for the Jun '21 quarter versus the year ago period. Three of the past 4 quarterly comparisons were above the +25% minimum earnings guideline (C criteria). Annual earnings (A criteria) growth has been strong and steady.
>>> FEATURED STOCK ARTICLE : Finished Strong With Gain for New High Backed by Volume - 8/5/2021 |
View all notes |
Set NEW NOTE alert |
Company Profile |
SEC
News |
Chart |
Request a new note
C
A
S
I |
Symbol/Exchange
Company Name
Industry Group |
PRICE |
CHANGE
(%Change) |
Day High |
Volume
(% DAV)
(% 50 day avg vol) |
52 Wk Hi
% From Hi |
Featured
Date |
Price
Featured |
Pivot Featured |
|
Max Buy |
UMC
-
NYSE
United Microelectrnc Adr
ELECTRONICS - Semiconductor - Integrated Cir
|
$11.85
|
+0.48
4.22% |
$11.97
|
13,065,389
187.83% of 50 DAV
50 DAV is 6,956,000
|
$11.71
1.20%
|
8/5/2021
|
$11.62
|
PP = $11.38
|
|
MB = $11.95
|
Most Recent Note - 9/1/2021 1:12:21 PM
Y - Hitting a new all-time high and approaching its "max buy" level with heavier volume behind today's 4th consecutive gain. Found prompt support at its 50 DMA line ($10.13). A violation of its 50 DMA line would raise concerns and trigger a technical sell signal.
>>> FEATURED STOCK ARTICLE : Taiwan-Based Semiconductor Firm's Breakout Highlighted This Week - 8/6/2021 |
View all notes |
Set NEW NOTE alert |
Company Profile |
SEC
News |
Chart |
Request a new note
C
A
S
I |
ASML
-
NASDAQ
A S M L Holding N.V. NY
ELECTRONICS - Semiconductor Equipment and Mate
|
$842.17
|
+9.13
1.10% |
$850.72
|
580,484
92.14% of 50 DAV
50 DAV is 630,000
|
$844.16
-0.24%
|
5/25/2021
|
$669.59
|
PP = $675.75
|
|
MB = $709.54
|
Most Recent Note - 9/1/2021 5:34:57 PM
G - Touched another new all-time high today after stubbornly holding its ground. Its 50 DMA line ($750) defines important near-term support to watch on pullbacks.
>>> FEATURED STOCK ARTICLE : Semi Equipment Firm Extended From Any Sound Base - 8/11/2021 |
View all notes |
Set NEW NOTE alert |
Company Profile |
SEC
News |
Chart |
Request a new note
C
A
S
I |
ENTG
-
NASDAQ
Entegris Inc
ELECTRONICS - Semiconductor Equipment and Mate
|
$119.45
|
-0.69
-0.57% |
$121.32
|
605,760
94.50% of 50 DAV
50 DAV is 641,000
|
$126.41
-5.51%
|
8/4/2021
|
$125.33
|
PP = $126.51
|
|
MB = $132.84
|
Most Recent Note - 9/1/2021 5:43:28 PM
Y - Rebound above the 50 DMA line ($118) helped its outlook to improve and the color code is changed to yellow. Recent lows in the $109 area define important near-term support above its 200 DMA line. Subsequent gains and a close above the pivot point backed by at least +40% above average volume may trigger a proper technical buy signal. Fundamentals remain strong as it reported Jun '21 quarterly earnings +42% on +27% sales revenues. Its Relative Strength Rating is 80, right at the 80+ minimum guideline for buy candidates.
>>> FEATURED STOCK ARTICLE : Perched Near High After 6th Consecutive Gain - 8/4/2021 |
View all notes |
Set NEW NOTE alert |
Company Profile |
SEC
News |
Chart |
Request a new note
C
A
S
I |
HIBB
-
NASDAQ
Hibbett Sports Inc
SPECIALTY RETAIL - Sporting Goods Stores
|
$97.97
|
+2.28
2.38% |
$99.26
|
513,447
114.92% of 50 DAV
50 DAV is 446,800
|
$100.32
-2.34%
|
8/25/2021
|
$99.58
|
PP = $98.45
|
|
MB = $103.37
|
Most Recent Note - 8/31/2021 12:51:35 PM
Y - Halted its slide after a pullback retested support near its 50 DMA line ($88.85). Slumped back into the prior base after it reported Jul '21 earnings +0% on -5% sales revenues versus the year ago period, raising fundamental concerns. Disciplined investors always limit losses by selling any stock that falls more than -8% from their purchase price as Rule #1 of the fact-based investing system.
>>> FEATURED STOCK ARTICLE : Volume-Driven Gain for New High Ahead of Earnings Report - 8/26/2021 |
View all notes |
Set NEW NOTE alert |
Company Profile |
SEC
News |
Chart |
Request a new note
C
A
S
I |
CLFD
-
NASDAQ
Clearfield Inc
TELECOMMUNICATIONS - Cables / Satalite Equipment
|
$45.51
|
+0.20
0.44% |
$46.49
|
51,831
51.32% of 50 DAV
50 DAV is 101,000
|
$46.92
-3.01%
|
7/23/2021
|
$40.23
|
PP = $43.74
|
|
MB = $45.93
|
Most Recent Note - 8/27/2021 5:46:09 PM
G - Posted a gain today with near average volume just reaching a new 52-week high above its "max buy" level and its color code is changed to green. Its 50 DMA line ($39.70) defines important near-term support. Fundamentals remain strong. Bullish action came after it reported Jun '21 quarterly earnings +100% on +49% sales revenues.
>>> FEATURED STOCK ARTICLE : Big Volume-Driven Gain Challenging Prior High After Earnings - 7/23/2021 |
View all notes |
Set NEW NOTE alert |
Company Profile |
SEC
News |
Chart |
Request a new note
C
A
S
I |
Symbol/Exchange
Company Name
Industry Group |
PRICE |
CHANGE
(%Change) |
Day High |
Volume
(% DAV)
(% 50 day avg vol) |
52 Wk Hi
% From Hi |
Featured
Date |
Price
Featured |
Pivot Featured |
|
Max Buy |
POOL
-
NASDAQ
Pool Corp
WHOLESALE - Basic Materials Wholesale
|
$491.23
|
-3.07
-0.62% |
$494.30
|
211,073
88.69% of 50 DAV
50 DAV is 238,000
|
$496.51
-1.06%
|
8/19/2021
|
$484.37
|
PP = $495.32
|
|
MB = $520.09
|
Most Recent Note - 8/30/2021 5:04:00 PM
Y - Posted a gain today with light volume for its second-best ever close. After forming an advanced "3-weeks tight" base, subsequent gains above the pivot point backed by at least +40% above average volume may trigger a new (or add-on) technical buy signal. Volume totals cooled in recent weeks while stubbornly holding its ground perched at its all-time high. Its 50 DMA line ($472) defines important near-term support to watch on pullbacks.
>>> FEATURED STOCK ARTICLE : Churned Heavy Volume While Testing 50-Day Moving Average - 7/22/2021 |
View all notes |
Set NEW NOTE alert |
Company Profile |
SEC
News |
Chart |
Request a new note
C
A
S
I |
SMPL
-
NASDAQ
Simply Good Foods Co
Food-Confectionery
|
$35.69
|
+0.07
0.20% |
$36.01
|
168,777
38.71% of 50 DAV
50 DAV is 436,000
|
$38.50
-7.30%
|
12/28/2020
|
$30.40
|
PP = $31.44
|
|
MB = $33.01
|
Most Recent Note - 8/27/2021 5:43:08 PM
G - Posted a solid gain today with higher (near average) volume. Remains below its 50 DMA line ($36.36) which is now downward sloping. A rebound above the 50 DMA line is needed for its outlook to improve. Recent low ($33.91 on 8/19/21) defines important support where more damaging losses would raise greater concerns. Reported May '21 quarterly earnings +65% on +32% sales revenues versus the year ago period, well above the +25% minimum earnings guideline (C criteria).
>>> FEATURED STOCK ARTICLE : Still Lingering Below 50-Day Moving Average Line - 8/30/2021 |
View all notes |
Set NEW NOTE alert |
Company Profile |
SEC
News |
Chart |
Request a new note
C
A
S
I |
CTLT
-
NYSE
Catalent Inc
DRUGS - Biotechnology
|
$133.86
|
+3.42
2.62% |
$133.99
|
1,029,444
143.18% of 50 DAV
50 DAV is 719,000
|
$132.69
0.88%
|
8/25/2021
|
$128.72
|
PP = $127.78
|
|
MB = $134.17
|
Most Recent Note - 8/31/2021 12:44:43 PM
Y - Hovering at its all-time high stubbornly holding its ground after recently noted volume-driven gains. Reported Jun '21 quarterly earnings +29% on +25% sales revenues versus the year ago period. Volume and volatility often increase near earnings news. Prior highs in the $124-127 area define initial support to watch above its 50 DMA line ($117).
>>> FEATURED STOCK ARTICLE : Strong Gain Triggered Technical Buy Signal - 8/25/2021 |
View all notes |
Set NEW NOTE alert |
Company Profile |
SEC
News |
Chart |
Request a new note
C
A
S
I |
SQ
-
NYSE
Square Inc Cl A
Finance-CrdtCard/PmtPr
|
$268.25
|
+0.18
0.07% |
$273.15
|
3,924,690
49.93% of 50 DAV
50 DAV is 7,860,000
|
$289.23
-7.25%
|
8/2/2021
|
$273.78
|
PP = $283.29
|
|
MB = $297.45
|
Most Recent Note - 9/1/2021 5:41:23 PM
Y - Volume totals have been cooling while consolidating in recent weeks. Stalled after reaching a new all-time high. The 50 DMA line ($256.48) defines near-term support to watch. Reported Jun '21 quarterly earnings +267% on +143% sales revenues versus the year ago period, its 4th strong comparison well above the +25% minimum guideline (C criteria).
>>> FEATURED STOCK ARTICLE : Pullback Following Big Gain on Strong Earnings and M&A News - 8/3/2021 |
View all notes |
Set NEW NOTE alert |
Company Profile |
SEC
News |
Chart |
Request a new note
C
A
S
I |
SHOP
-
NYSE
Shopify Inc Cl A
Computer Sftwr-Enterprse
|
$1,539.03
|
+14.25
0.93% |
$1,552.24
|
524,596
43.72% of 50 DAV
50 DAV is 1,200,000
|
$1,650.00
-6.73%
|
7/2/2021
|
$1,468.00
|
PP = $1,552.23
|
|
MB = $1,629.84
|
Most Recent Note - 8/31/2021 4:40:10 PM
Y - Volume totals have been cooling while recently consolidating above its 50 DMA line ($1,510). Also tested February 2021 highs which help define important near-term support to watch. More damaging losses would raise concerns and trigger technical sell signals. Fundamentals remain strong. See the latest FSU analysis for more details and a new annotated graph.
>>> FEATURED STOCK ARTICLE : Volume Cools While Consolidating Above 50-Day Moving Average - 8/31/2021 |
View all notes |
Set NEW NOTE alert |
Company Profile |
SEC
News |
Chart |
Request a new note
C
A
S
I |
Symbol/Exchange
Company Name
Industry Group |
PRICE |
CHANGE
(%Change) |
Day High |
Volume
(% DAV)
(% 50 day avg vol) |
52 Wk Hi
% From Hi |
Featured
Date |
Price
Featured |
Pivot Featured |
|
Max Buy |
YETI
-
NYSE
Yeti Holdings Inc
Leisure-Products
|
$100.11
|
+0.77
0.78% |
$100.55
|
549,887
58.56% of 50 DAV
50 DAV is 939,000
|
$105.62
-5.22%
|
5/13/2021
|
$84.20
|
PP = $90.65
|
|
MB = $95.18
|
Most Recent Note - 8/30/2021 5:07:27 PM
G - Volume totals have been below average while holding its ground after a pullback tested its 50 DMA line ($95.73) which defines near-term support to watch. There was a noted "negative reversal" after hitting a new all-time high on 8/06/21. Fundamentals remain strong.
>>> FEATURED STOCK ARTICLE : Important Test of 50-Day Moving Average Line - 8/19/2021 |
View all notes |
Set NEW NOTE alert |
Company Profile |
SEC
News |
Chart |
Request a new note
C
A
S
I |
DOCU
-
NASDAQ
Docusign Inc
Computer Sftwr-Enterprse
|
$297.22
|
+0.98
0.33% |
$299.17
|
1,628,035
87.67% of 50 DAV
50 DAV is 1,857,000
|
$314.76
-5.57%
|
7/6/2021
|
$288.96
|
PP = $290.33
|
|
MB = $304.85
|
Most Recent Note - 8/31/2021 4:43:56 PM
Y - Pulled back today with higher volume testing support at its 50 DMA line ($291). It has not formed a sound base of sufficient length. A damaging violation of the 50 DMA line and recent low ($281) would raise greater concerns and trigger technical sell signals.
>>> FEATURED STOCK ARTICLE : Reversed From High After Recently Wedging Higher Without Volume - 8/13/2021 |
View all notes |
Set NEW NOTE alert |
Company Profile |
SEC
News |
Chart |
Request a new note
C
A
S
I |
JEF
-
NYSE
Jefferies Financial Grp
Finance-Invest Bnk/Bkrs
|
$36.61
|
-0.35
-0.95% |
$37.12
|
1,423,725
73.35% of 50 DAV
50 DAV is 1,941,000
|
$37.85
-3.28%
|
6/28/2021
|
$31.81
|
PP = $34.42
|
|
MB = $36.14
|
Most Recent Note - 8/30/2021 5:00:29 PM
G - Color code is changed to green after recently rising above its "max buy" level. There was a "negative reversal" today after hitting a new all-time high. Prior highs in the $34-35 range define initial support to watch above its 50 DMA line ($33.71).
>>> FEATURED STOCK ARTICLE : Quiet Gains for New High Closes - 8/10/2021 |
View all notes |
Set NEW NOTE alert |
Company Profile |
SEC
News |
Chart |
Request a new note
C
A
S
I |
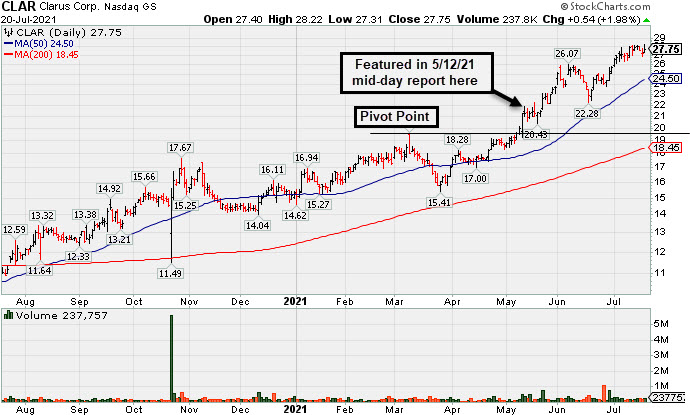
CLAR
-
NASDAQ
Clarus Corporation
Leisure-Products
|
$27.77
|
+0.68
2.51% |
$27.92
|
117,184
58.01% of 50 DAV
50 DAV is 202,000
|
$32.36
-14.18%
|
5/12/2021
|
$21.40
|
PP = $19.73
|
|
MB = $20.72
|
Most Recent Note - 9/1/2021 5:33:11 PM
G - Finding support near its 50 DMA line ($27.44) but it has not formed a sound base of sufficient length. Fundamentals remain strong. See the latest FSU analysis for more details and a new annotated graph.
>>> FEATURED STOCK ARTICLE : Fundamentals Strong and Finding Support at 50-Day Moving Average - 9/1/2021 |
View all notes |
Set NEW NOTE alert |
Company Profile |
SEC
News |
Chart |
Request a new note
C
A
S
I |
AVTR
-
NYSE
Avantor Inc
Medical-Research Eqp/Svc
|
$39.91
|
+0.47
1.19% |
$40.05
|
1,895,813
58.80% of 50 DAV
50 DAV is 3,224,000
|
$40.31
-0.99%
|
6/10/2021
|
$32.94
|
PP = $34.09
|
|
MB = $35.79
|
Most Recent Note - 8/27/2021 5:39:43 PM
G - Paused today after wedging into new all-time high territory. Extended from any sound base. Its 50 DMA line ($37.12) defines near-term support to watch on pullbacks. See the latest FSU analysis for more details and a new annotated graph.
>>> FEATURED STOCK ARTICLE : Steady Progress Made Since Featured - 8/27/2021 |
View all notes |
Set NEW NOTE alert |
Company Profile |
SEC
News |
Chart |
Request a new note
C
A
S
I |
Symbol/Exchange
Company Name
Industry Group |
PRICE |
CHANGE
(%Change) |
Day High |
Volume
(% DAV)
(% 50 day avg vol) |
52 Wk Hi
% From Hi |
Featured
Date |
Price
Featured |
Pivot Featured |
|
Max Buy |
MIME
-
NASDAQ
Mimecast Limited
Computer Sftwr-Security
|
$70.12
|
+0.31
0.44% |
$70.63
|
862,009
90.83% of 50 DAV
50 DAV is 949,000
|
$71.30
-1.65%
|
8/2/2021
|
$56.12
|
PP = $59.58
|
|
MB = $62.56
|
Most Recent Note - 8/27/2021 1:03:11 PM
G - Perched at its all-time high with today's 6th consecutive gain, very extended from the previously noted base. Disciplined investors avoid buying stocks more than +5% above their pivot point or prior high. Prior highs in the $59 area define initial support to watch on pullbacks. Fundamentals remain strong.
>>> FEATURED STOCK ARTICLE : Perched Not Far From High With Earnings News Due Pre-Open - 8/2/2021 |
View all notes |
Set NEW NOTE alert |
Company Profile |
SEC
News |
Chart |
Request a new note
C
A
S
I |