***Last / Change / Volume data in this table is the closing quote data***
Symbol/Exchange
Company Name
Industry Group |
PRICE |
CHANGE
(%Change) |
Day High |
Volume
(% DAV)
(% 50 day avg vol) |
52 Wk Hi
% From Hi |
Featured
Date |
Price
Featured |
Pivot Featured |
|
Max Buy |
 SIVB
-
NASDAQ
SIVB
-
NASDAQ
S V B Financial Group
BANKING - Regional - Pacific Banks
|
$586.00
|
+14.49
2.54% |
$592.07
|
403,536
103.74% of 50 DAV
50 DAV is 389,000
|
$608.84
-3.75%
|
8/6/2021
|
$589.70
|
PP = $608.94
|
|
MB = $639.39
|
 Most Recent Note - 9/7/2021 5:16:45 PM
Y - Color code is changed to yellow after rebounding back above its 50 DMA line ($566) helping its outlook improve. Prior lows in the $530 area define the next important near-term support to watch. Completed a new Public Offering on 8/11/21.
>>> FEATURED STOCK ARTICLE : Consolidating Near Prior Highs Facing Little Resistance - 8/9/2021 |
View all notes |
Set NEW NOTE alert |
Company Profile |
SEC
News |
Chart |
Request a new note
C
A
S
I |
BLDR
-
NYSE
Builders Firstsource Inc
Bldg-Constr Prds/Misc
|
$54.33
|
-0.16
-0.29% |
$54.91
|
1,393,687
46.24% of 50 DAV
50 DAV is 3,014,000
|
$55.17
-1.52%
|
8/12/2021
|
$52.38
|
PP = $54.09
|
|
MB = $56.79
|
Most Recent Note - 9/2/2021 4:19:31 PM
Y - Gapped up and hit a new all-time high today with another gain backed by below average volume. Highlighted in yellow with pivot point cited based on its 5/10/21 high plus 10 cents in the 8/12/21 mid-day report. Subsequent gains above the pivot point backed by at least +40% above average volume may trigger a technical buy signal. Found support near its 200 DMA line. Fundamentals remain strong.
>>> FEATURED STOCK ARTICLE : Rebounding Near Prior High After Another Strong Quarter - 8/12/2021 |
View all notes |
Set NEW NOTE alert |
Company Profile |
SEC
News |
Chart |
Request a new note
C
A
S
I |
SNPS
-
NASDAQ
Synopsys Inc
COMPUTER SOFTWARE and SERVICES - Technical and System Software
|
$336.32
|
-0.32
-0.10% |
$338.00
|
616,406
86.32% of 50 DAV
50 DAV is 714,100
|
$340.66
-1.27%
|
8/18/2021
|
$293.22
|
PP = $301.01
|
|
MB = $316.06
|
Most Recent Note - 9/1/2021 5:39:59 PM
G - Perched at its all-time high stubbornly holding its ground after a streak of gains. Prior high in the $300 area defines initial support to watch on pullbacks.
>>> FEATURED STOCK ARTICLE : Latest Earnings Report Missed the +25% Minimum Guideline - 8/18/2021 |
View all notes |
Set NEW NOTE alert |
Company Profile |
SEC
News |
Chart |
Request a new note
C
A
S
I |
CROX
-
NASDAQ
Crocs Inc
CONSUMER NON-DURABLES - Textile - Apparel Footwear
|
$136.28
|
-3.41
-2.44% |
$139.84
|
1,568,169
149.35% of 50 DAV
50 DAV is 1,050,000
|
$147.76
-7.77%
|
6/14/2021
|
$112.64
|
PP = $110.01
|
|
MB = $115.51
|
Most Recent Note - 9/2/2021 4:27:51 PM
G - End near the session low with average volume behind today's loss, retreating from its all-time high. Extended from any sound base, and near-term support to watch is at its 50 DMA line ($130.63).
>>> FEATURED STOCK ARTICLE : Wedging Higher and Very Extended From Any Sound Base - 8/16/2021 |
View all notes |
Set NEW NOTE alert |
Company Profile |
SEC
News |
Chart |
Request a new note
C
A
S
I |
CRL
-
NYSE
Charles River Labs Intl
DRUGS - Biotechnology
|
$449.17
|
-0.38
-0.08% |
$450.04
|
254,865
97.65% of 50 DAV
50 DAV is 261,000
|
$450.67
-0.33%
|
6/9/2021
|
$345.91
|
PP = $349.23
|
|
MB = $366.69
|
Most Recent Note - 9/7/2021 5:17:46 PM
G - Perched at its all-time high, very extended from any sound base, stubbornly holding its ground. Recent volume totals have been lackluster while wedging into record high territory. Its 50 DMA line ($405) defines near-term support to watch on pullbacks. Fundamentals remain strong.
>>> FEATURED STOCK ARTICLE : Wedging Higher With Gains Lacking Volume Conviction - 8/24/2021 |
View all notes |
Set NEW NOTE alert |
Company Profile |
SEC
News |
Chart |
Request a new note
C
A
S
I |
Symbol/Exchange
Company Name
Industry Group |
PRICE |
CHANGE
(%Change) |
Day High |
Volume
(% DAV)
(% 50 day avg vol) |
52 Wk Hi
% From Hi |
Featured
Date |
Price
Featured |
Pivot Featured |
|
Max Buy |
REGN
-
NASDAQ
Regeneron Pharmaceutical
DRUGS - Biotechnology
|
$668.81
|
-10.76
-1.58% |
$679.58
|
705,960
89.02% of 50 DAV
50 DAV is 793,000
|
$686.62
-2.59%
|
8/20/2021
|
$669.82
|
PP = $664.74
|
|
MB = $697.98
|
Most Recent Note - 9/3/2021 3:37:42 PM
Y - Wedging to another new all-time high today with lighter than average volume. Gains above a stock's pivot point must be backed by at least +40% above average volume to trigger a proper technical buy signal.
>>> FEATURED STOCK ARTICLE : Regeneron Featured Hitting a New High - 8/20/2021 |
View all notes |
Set NEW NOTE alert |
Company Profile |
SEC
News |
Chart |
Request a new note
C
A
S
I |
GNRC
-
NYSE
Generac Hldgs Inc
Electrical-Power/Equipmt
|
$445.55
|
-8.20
-1.81% |
$455.00
|
566,205
74.89% of 50 DAV
50 DAV is 756,000
|
$458.57
-2.84%
|
8/30/2021
|
$449.36
|
PP = $457.10
|
|
MB = $479.96
|
Most Recent Note - 9/2/2021 4:34:16 PM
Y - Posted a gain today with light volume and finished near the session high for a best-ever close. Subsequent gains and a strong close above the pivot point backed by at least +40% above average volume may trigger a new (or add-on) technical buy signal. Fundamentals remain strong. Recent low ($385) defines important near term support to watch.
>>> FEATURED STOCK ARTICLE : Rebound Above 50-Day Moving Average Helps Outlook - 8/23/2021 |
View all notes |
Set NEW NOTE alert |
Company Profile |
SEC
News |
Chart |
Request a new note
C
A
S
I |
CAMT
-
NASDAQ
Camtek Ltd
ELECTRONICS - Scientific and Technical Instrum
|
$42.35
|
+0.26
0.62% |
$42.88
|
163,520
93.98% of 50 DAV
50 DAV is 174,000
|
$42.39
-0.09%
|
8/4/2021
|
$39.67
|
PP = $40.57
|
|
MB = $42.60
|
Most Recent Note - 9/1/2021 5:38:39 PM
Y - Hovering near its all-time high with today's small loss on light volume. Big gain above the pivot point on 8/25/21 backed by +116% above average volume triggered a proper technical buy signal. Its 50 DMA line ($36.91) and prior low ($34.68 on 8/17/21) define important near-term support to watch. Fundamentals remain strong.
>>> FEATURED STOCK ARTICLE : Recent 50-Day Moving Average Violation Again Raised Concerns - 8/17/2021 |
View all notes |
Set NEW NOTE alert |
Company Profile |
SEC
News |
Chart |
Request a new note
C
A
S
I |
PKI
-
NYSE
Perkinelmer Inc
ELECTRONICS - Scientific and Technical Instrum
|
$189.82
|
-0.68
-0.36% |
$190.92
|
546,859
75.74% of 50 DAV
50 DAV is 722,000
|
$190.59
-0.40%
|
8/18/2021
|
$181.07
|
PP = $188.50
|
|
MB = $197.93
|
Most Recent Note - 9/3/2021 3:48:16 PM
Y - Recently wedging to new all-time highs with small gains backed by light volume. After forming a noted "3-weeks tight" base its color code was changed to yellow with new pivot point cited based on its 8/05/21 high plus 10 cents. Its 50 DMA line ($172).and prior high ($162) define important near-term support to watch. Fundamentals remain strong.
>>> FEATURED STOCK ARTICLE : Powerful Volume-Driven Breakout After Earnings Report - 7/26/2021 |
View all notes |
Set NEW NOTE alert |
Company Profile |
SEC
News |
Chart |
Request a new note
C
A
S
I |
TRMB
-
NASDAQ
Trimble Inc
ELECTRONICS - Scientific and Technical Instrum
|
$94.58
|
-0.28
-0.30% |
$95.22
|
1,180,985
118.45% of 50 DAV
50 DAV is 997,000
|
$96.49
-1.98%
|
8/5/2021
|
$88.83
|
PP = $84.97
|
|
MB = $89.22
|
Most Recent Note - 9/1/2021 1:09:46 PM
G - Perched near its all-time high after wedging higher with gains lacking great volume conviction. Its 50 DMA line ($86) defines near-term support above prior highs in the $84 area. Reported earnings +38% on +29% sales revenues for the Jun '21 quarter versus the year ago period. Three of the past 4 quarterly comparisons were above the +25% minimum earnings guideline (C criteria). Annual earnings (A criteria) growth has been strong and steady.
>>> FEATURED STOCK ARTICLE : Finished Strong With Gain for New High Backed by Volume - 8/5/2021 |
View all notes |
Set NEW NOTE alert |
Company Profile |
SEC
News |
Chart |
Request a new note
C
A
S
I |
Symbol/Exchange
Company Name
Industry Group |
PRICE |
CHANGE
(%Change) |
Day High |
Volume
(% DAV)
(% 50 day avg vol) |
52 Wk Hi
% From Hi |
Featured
Date |
Price
Featured |
Pivot Featured |
|
Max Buy |
UMC
-
NYSE
United Microelectrnc Adr
ELECTRONICS - Semiconductor - Integrated Cir
|
$12.25
|
-0.25
-2.00% |
$12.50
|
8,777,687
118.92% of 50 DAV
50 DAV is 7,381,000
|
$12.62
-2.93%
|
8/5/2021
|
$11.62
|
PP = $11.38
|
|
MB = $11.95
|
Most Recent Note - 9/7/2021 12:52:20 PM
G - Gapped up on the prior session rallying above its "max buy" level hitting another new all-time high and its color code was changed to green. Prior highs in the $11.25 area define initial support to watch above its 50 DMA line ($10.29).
>>> FEATURED STOCK ARTICLE : Taiwan-Based Semiconductor Firm's Breakout Highlighted This Week - 8/6/2021 |
View all notes |
Set NEW NOTE alert |
Company Profile |
SEC
News |
Chart |
Request a new note
C
A
S
I |
ASML
-
NASDAQ
A S M L Holding N.V. NY
ELECTRONICS - Semiconductor Equipment and Mate
|
$861.77
|
+3.67
0.43% |
$868.88
|
780,401
122.13% of 50 DAV
50 DAV is 639,000
|
$862.98
-0.14%
|
5/25/2021
|
$669.59
|
PP = $675.75
|
|
MB = $709.54
|
Most Recent Note - 9/7/2021 12:01:20 PM
G - Hitting another new all-time high with today's gain. Stubbornly holding its ground and making steady progress. Its 50 DMA line ($760) defines important near-term support to watch on pullbacks.
>>> FEATURED STOCK ARTICLE : Semi Equipment Firm Extended From Any Sound Base - 8/11/2021 |
View all notes |
Set NEW NOTE alert |
Company Profile |
SEC
News |
Chart |
Request a new note
C
A
S
I |
ENTG
-
NASDAQ
Entegris Inc
ELECTRONICS - Semiconductor Equipment and Mate
|
$121.69
|
-0.12
-0.10% |
$122.30
|
491,802
79.58% of 50 DAV
50 DAV is 618,000
|
$126.41
-3.73%
|
8/4/2021
|
$125.33
|
PP = $126.51
|
|
MB = $132.84
|
Most Recent Note - 9/1/2021 5:43:28 PM
Y - Rebound above the 50 DMA line ($118) helped its outlook to improve and the color code is changed to yellow. Recent lows in the $109 area define important near-term support above its 200 DMA line. Subsequent gains and a close above the pivot point backed by at least +40% above average volume may trigger a proper technical buy signal. Fundamentals remain strong as it reported Jun '21 quarterly earnings +42% on +27% sales revenues. Its Relative Strength Rating is 80, right at the 80+ minimum guideline for buy candidates.
>>> FEATURED STOCK ARTICLE : Perched Near High After 6th Consecutive Gain - 8/4/2021 |
View all notes |
Set NEW NOTE alert |
Company Profile |
SEC
News |
Chart |
Request a new note
C
A
S
I |
AMRC
-
NYSE
Ameresco Inc Cl A
ENERGY - Alternative
|
$72.13
|
+0.05
0.07% |
$75.88
|
485,913
185.46% of 50 DAV
50 DAV is 262,000
|
$72.28
-0.21%
|
9/2/2021
|
$70.97
|
PP = $70.33
|
|
MB = $73.85
|
Most Recent Note - 9/7/2021 11:58:58 AM
Y - Reversed into the red after a strong start today. Color code was changed to yellow with new pivot point cited based on its 8/25/21 high in the 9/02/21mid-day report. Hit a new all-time high with +55% above average volume behind a gain triggering a technical buy signal. Fundamentals remain strong after it reported Jun '21 quarterly earnings +79% on +23% sales revenues versus the year ago period. Completed a new Public Offering on 3/05/21 and went through a deep consolidation and rebounded from support at its 200 DMA line since dropped from the Featured Stocks list on 2/25/21. See the latest FSU analysis for more details and an annotated graph.
>>> FEATURED STOCK ARTICLE : Volume +55% Above Average Behind Gain for a New High - 9/2/2021 |
View all notes |
Set NEW NOTE alert |
Company Profile |
SEC
News |
Chart |
Request a new note
C
A
S
I |
HIBB
-
NASDAQ
Hibbett Sports Inc
SPECIALTY RETAIL - Sporting Goods Stores
|
$85.56
|
-13.40
-13.54% |
$98.88
|
1,008,423
223.80% of 50 DAV
50 DAV is 450,600
|
$100.32
-14.71%
|
8/25/2021
|
$99.58
|
PP = $98.45
|
|
MB = $103.37
|
Most Recent Note - 9/3/2021 3:41:06 PM
Y - Perched within close striking distance of its best ever close and 52-week high with today's gain on light volume. Its 50 DMA line ($90.20) defines important near-term support to watch on pullbacks. Recently reported Jul '21 earnings +0% on -5% sales revenues versus the year ago period, raising fundamental concerns.
>>> FEATURED STOCK ARTICLE : Volume-Driven Gain for New High Ahead of Earnings Report - 8/26/2021 |
View all notes |
Set NEW NOTE alert |
Company Profile |
SEC
News |
Chart |
Request a new note
C
A
S
I |
Symbol/Exchange
Company Name
Industry Group |
PRICE |
CHANGE
(%Change) |
Day High |
Volume
(% DAV)
(% 50 day avg vol) |
52 Wk Hi
% From Hi |
Featured
Date |
Price
Featured |
Pivot Featured |
|
Max Buy |
CLFD
-
NASDAQ
Clearfield Inc
TELECOMMUNICATIONS - Cables / Satalite Equipment
|
$44.79
|
-1.20
-2.61% |
$46.24
|
89,089
90.91% of 50 DAV
50 DAV is 98,000
|
$46.93
-4.56%
|
7/23/2021
|
$40.23
|
PP = $43.74
|
|
MB = $45.93
|
Most Recent Note - 9/2/2021 4:21:51 PM
G - Hovering near its 52-week high and "max buy" level, stubbornly holding its ground. Its 50 DMA line ($40.56) defines important near-term support to watch on pullbacks. Fundamentals remain strong.
>>> FEATURED STOCK ARTICLE : Big Volume-Driven Gain Challenging Prior High After Earnings - 7/23/2021 |
View all notes |
Set NEW NOTE alert |
Company Profile |
SEC
News |
Chart |
Request a new note
C
A
S
I |
POOL
-
NASDAQ
Pool Corp
WHOLESALE - Basic Materials Wholesale
|
$491.05
|
-5.84
-1.18% |
$497.66
|
125,742
53.74% of 50 DAV
50 DAV is 234,000
|
$498.95
-1.58%
|
8/19/2021
|
$484.37
|
PP = $495.32
|
|
MB = $520.09
|
Most Recent Note - 9/7/2021 5:15:33 PM
Y - Pulled back today with light volume. After forming an advanced "3-weeks tight" base, subsequent gains above the pivot point backed by at least +40% above average volume may trigger a new (or add-on) technical buy signal. Volume totals cooled in recent weeks while stubbornly holding its ground perched at its all-time high. Its 50 DMA line ($475) defines important near-term support to watch on pullbacks.
>>> FEATURED STOCK ARTICLE : Churned Heavy Volume While Testing 50-Day Moving Average - 7/22/2021 |
View all notes |
Set NEW NOTE alert |
Company Profile |
SEC
News |
Chart |
Request a new note
C
A
S
I |
SMPL
-
NASDAQ
Simply Good Foods Co
Food-Confectionery
|
$34.75
|
-0.81
-2.28% |
$35.45
|
210,116
51.37% of 50 DAV
50 DAV is 409,000
|
$38.50
-9.74%
|
12/28/2020
|
$30.40
|
PP = $31.44
|
|
MB = $33.01
|
Most Recent Note - 9/2/2021 4:25:30 PM
G - Posted a 5th consecutive small gain today with light volume. A rebound above the 50 DMA line ($36.52) is needed for its outlook to improve. Recent low ($33.91 on 8/19/21) defines important support where more damaging losses would raise greater concerns. Fundamentals remain strong.
>>> FEATURED STOCK ARTICLE : Still Lingering Below 50-Day Moving Average Line - 8/30/2021 |
View all notes |
Set NEW NOTE alert |
Company Profile |
SEC
News |
Chart |
Request a new note
C
A
S
I |
WDAY
-
NASDAQ
Workday Inc Cl A
Computer Sftwr-Enterprse
|
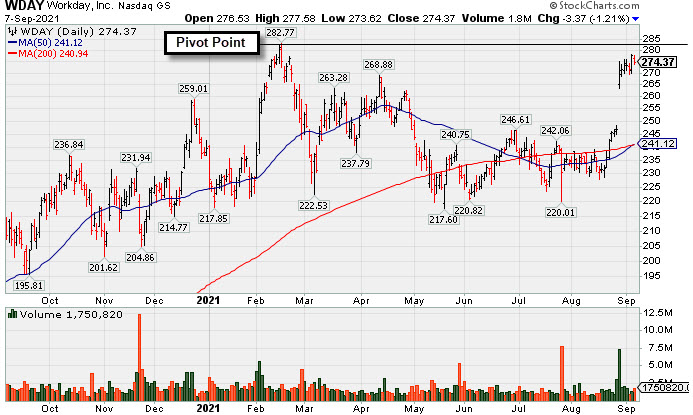
$274.37
|
-3.37
-1.21% |
$277.59
|
1,750,778
110.04% of 50 DAV
50 DAV is 1,591,000
|
$282.77
-2.97%
|
9/7/2021
|
$275.69
|
PP = $282.87
|
|
MB = $297.01
|
Most Recent Note - 9/7/2021 5:10:04 PM
Y - Lost ground today and ended near the session low after highlighted in yellow with pivot point cited based on its 2/16/21 high plus 10 cents in the earlier mid-day report. It is perched within striking distance of its 52-week high after a big gap up 8/27/21 and additional volume-driven gains. Subsequent gains above the pivot point backed by at least +40% above average volume may trigger a technical buy signal. Reported Jul '21 quarterly earnings +46% on +19% sales revenues versus the year ago period, its 5th consecutive quarterly comparison well above the +25% minimum guideline (C criteria). See the latest FSU analysis for more details and a new annotated graph.
>>> FEATURED STOCK ARTICLE : Gap Up and Recent Gains Challenge All-Time High - 9/7/2021 |
View all notes |
Set NEW NOTE alert |
Company Profile |
SEC
News |
Chart |
Request a new note
C
A
S
I |
CTLT
-
NYSE
Catalent Inc
DRUGS - Biotechnology
|
$141.11
|
+0.76
0.54% |
$141.59
|
1,210,760
162.08% of 50 DAV
50 DAV is 747,000
|
$140.72
0.28%
|
8/25/2021
|
$128.72
|
PP = $127.78
|
|
MB = $134.17
|
Most Recent Note - 9/3/2021 11:58:36 AM
G - Perched at its all-time high. Color code was changed to green after rallying above its "max buy" level with 4 consecutive gains. Prior highs in the $124-127 area define initial support to watch above its 50 DMA line ($119). Fundamentals remain strong.
>>> FEATURED STOCK ARTICLE : Strong Gain Triggered Technical Buy Signal - 8/25/2021 |
View all notes |
Set NEW NOTE alert |
Company Profile |
SEC
News |
Chart |
Request a new note
C
A
S
I |
Symbol/Exchange
Company Name
Industry Group |
PRICE |
CHANGE
(%Change) |
Day High |
Volume
(% DAV)
(% 50 day avg vol) |
52 Wk Hi
% From Hi |
Featured
Date |
Price
Featured |
Pivot Featured |
|
Max Buy |
SQ
-
NYSE
Square Inc Cl A
Finance-CrdtCard/PmtPr
|
$265.83
|
-3.91
-1.45% |
$270.45
|
5,236,288
68.18% of 50 DAV
50 DAV is 7,680,000
|
$289.23
-8.09%
|
8/2/2021
|
$273.78
|
PP = $283.29
|
|
MB = $297.45
|
Most Recent Note - 9/1/2021 5:41:23 PM
Y - Volume totals have been cooling while consolidating in recent weeks. Stalled after reaching a new all-time high. The 50 DMA line ($256.48) defines near-term support to watch. Reported Jun '21 quarterly earnings +267% on +143% sales revenues versus the year ago period, its 4th strong comparison well above the +25% minimum guideline (C criteria).
>>> FEATURED STOCK ARTICLE : Pullback Following Big Gain on Strong Earnings and M&A News - 8/3/2021 |
View all notes |
Set NEW NOTE alert |
Company Profile |
SEC
News |
Chart |
Request a new note
C
A
S
I |
SHOP
-
NYSE
Shopify Inc Cl A
Computer Sftwr-Enterprse
|
$1,536.70
|
-17.55
-1.13% |
$1,563.77
|
609,457
53.27% of 50 DAV
50 DAV is 1,144,000
|
$1,650.00
-6.87%
|
7/2/2021
|
$1,468.00
|
PP = $1,552.23
|
|
MB = $1,629.84
|
Most Recent Note - 9/3/2021 3:46:08 PM
Y - Volume totals have still been cooling while holding its ground in a tight range above its 50 DMA line ($1,513) and perched within close striking distance of its all-time high. Also tested February 2021 highs which help define important near-term support to watch. Fundamentals remain strong.
>>> FEATURED STOCK ARTICLE : Volume Cools While Consolidating Above 50-Day Moving Average - 8/31/2021 |
View all notes |
Set NEW NOTE alert |
Company Profile |
SEC
News |
Chart |
Request a new note
C
A
S
I |
YETI
-
NYSE
Yeti Holdings Inc
Leisure-Products
|
$97.12
|
-3.35
-3.33% |
$102.70
|
903,752
98.02% of 50 DAV
50 DAV is 922,000
|
$105.62
-8.05%
|
5/13/2021
|
$84.20
|
PP = $90.65
|
|
MB = $95.18
|
Most Recent Note - 9/7/2021 5:14:31 PM
G - There was a "negative reversal" after a positive start and it closed near the session low with a loss on higher (average) volume. Its 50 DMA line ($96.69) defines near-term support to watch above the recent low ($94.15). There was a noted "negative reversal" after hitting a new all-time high on 8/06/21. Fundamentals remain strong.
>>> FEATURED STOCK ARTICLE : Important Test of 50-Day Moving Average Line - 8/19/2021 |
View all notes |
Set NEW NOTE alert |
Company Profile |
SEC
News |
Chart |
Request a new note
C
A
S
I |
DOCU
-
NASDAQ
Docusign Inc
Computer Sftwr-Enterprse
|
$291.50
|
-18.55
-5.98% |
$311.68
|
5,132,014
256.22% of 50 DAV
50 DAV is 2,003,000
|
$314.76
-7.39%
|
7/6/2021
|
$288.96
|
PP = $290.33
|
|
MB = $304.85
|
Most Recent Note - 9/7/2021 12:28:34 PM
Y - Color code is changed to yellow while pulling back below its "max buy" level today. Challenged its all-time high on the prior session with a big volume-driven gain. Bullish action came after it reported Jul '21 quarterly earnings +176% on +50% sales revenues versus the year ago period. The 50 DMA line ($293.75) and recent low ($281) define important support to watch on pullbacks.
>>> FEATURED STOCK ARTICLE : Reversed From High After Recently Wedging Higher Without Volume - 8/13/2021 |
View all notes |
Set NEW NOTE alert |
Company Profile |
SEC
News |
Chart |
Request a new note
C
A
S
I |
JEF
-
NYSE
Jefferies Financial Grp
Finance-Invest Bnk/Bkrs
|
$36.70
|
+0.16
0.44% |
$37.24
|
1,146,658
60.77% of 50 DAV
50 DAV is 1,887,000
|
$37.85
-3.04%
|
6/28/2021
|
$31.81
|
PP = $34.42
|
|
MB = $36.14
|
Most Recent Note - 9/3/2021 3:43:14 PM
G - Holding its ground stubbornly near its all-time high. Prior highs in the $34-35 range define initial support to watch above its 50 DMA line ($34.20).
>>> FEATURED STOCK ARTICLE : Quiet Gains for New High Closes - 8/10/2021 |
View all notes |
Set NEW NOTE alert |
Company Profile |
SEC
News |
Chart |
Request a new note
C
A
S
I |
Symbol/Exchange
Company Name
Industry Group |
PRICE |
CHANGE
(%Change) |
Day High |
Volume
(% DAV)
(% 50 day avg vol) |
52 Wk Hi
% From Hi |
Featured
Date |
Price
Featured |
Pivot Featured |
|
Max Buy |
DBX
-
NASDAQ
Dropbox Inc Cl A
Computer Sftwr-Database
|
$31.55
|
-0.84
-2.59% |
$32.57
|
4,745,070
119.52% of 50 DAV
50 DAV is 3,970,000
|
$33.00
-4.39%
|
9/3/2021
|
$32.45
|
PP = $33.00
|
|
MB = $34.65
|
Most Recent Note - 9/3/2021 5:15:32 PM
Y - Volume was +41% above average behind today's 6th consecutive gain. It was highlighted in yellow in the earlier mid-day report while noted - "A valid "secondary buy point" exists up to +5% above the latest high, as it found support at the 10 WMA following an earlier breakout. Reported strong earnings above the +25% minimum guideline (C criteria) in the past 7 quarterly comparisons through Jun '21 versus the year ago periods. Annual earnings history has been strong." See the latest FSU analysis for more details and an annotated graph.
>>> FEATURED STOCK ARTICLE : Volume Higher on 6th Consecutive Gain for Dropbox - 9/3/2021 |
View all notes |
Set NEW NOTE alert |
Company Profile |
SEC
News |
Chart |
Request a new note
C
A
S
I |
CLAR
-
NASDAQ
Clarus Corporation
Leisure-Products
|
$27.14
|
-0.89
-3.18% |
$28.14
|
148,425
74.21% of 50 DAV
50 DAV is 200,000
|
$32.36
-16.13%
|
5/12/2021
|
$21.40
|
PP = $19.73
|
|
MB = $20.72
|
Most Recent Note - 9/1/2021 5:33:11 PM
G - Finding support near its 50 DMA line ($27.44) but it has not formed a sound base of sufficient length. Fundamentals remain strong. See the latest FSU analysis for more details and a new annotated graph.
>>> FEATURED STOCK ARTICLE : Fundamentals Strong and Finding Support at 50-Day Moving Average - 9/1/2021 |
View all notes |
Set NEW NOTE alert |
Company Profile |
SEC
News |
Chart |
Request a new note
C
A
S
I |
AVTR
-
NYSE
Avantor Inc
Medical-Research Eqp/Svc
|
$42.00
|
+1.28
3.14% |
$42.19
|
4,612,369
144.95% of 50 DAV
50 DAV is 3,182,000
|
$40.98
2.49%
|
6/10/2021
|
$32.94
|
PP = $34.09
|
|
MB = $35.79
|
Most Recent Note - 9/2/2021 4:15:51 PM
G - Posted another gain with light volume, wedging further into new all-time high territory. It is very extended from any sound base. Its 50 DMA line ($37.52) defines near-term support to watch on pullbacks.
>>> FEATURED STOCK ARTICLE : Steady Progress Made Since Featured - 8/27/2021 |
View all notes |
Set NEW NOTE alert |
Company Profile |
SEC
News |
Chart |
Request a new note
C
A
S
I |
MIME
-
NASDAQ
Mimecast Limited
Computer Sftwr-Security
|
$69.11
|
-1.21
-1.72% |
$70.12
|
640,038
65.98% of 50 DAV
50 DAV is 970,000
|
$71.45
-3.28%
|
8/2/2021
|
$56.12
|
PP = $59.58
|
|
MB = $62.56
|
Most Recent Note - 9/2/2021 4:23:19 PM
G - Stubbornly holding its ground at its all-time high with volume totals cooling. Disciplined investors avoid buying stocks more than +5% above their pivot point or prior high. Prior highs in the $59 area define initial support to watch on pullbacks. Fundamentals remain strong.
>>> FEATURED STOCK ARTICLE : Perched Not Far From High With Earnings News Due Pre-Open - 8/2/2021 |
View all notes |
Set NEW NOTE alert |
Company Profile |
SEC
News |
Chart |
Request a new note
C
A
S
I |