***Last / Change / Volume data in this table is the closing quote data***
Symbol/Exchange
Company Name
Industry Group |
PRICE |
CHANGE
(%Change) |
Day High |
Volume
(% DAV)
(% 50 day avg vol) |
52 Wk Hi
% From Hi |
Featured
Date |
Price
Featured |
Pivot Featured |
|
Max Buy |
 SIVB
-
NASDAQ
SIVB
-
NASDAQ
S V B Financial Group
BANKING - Regional - Pacific Banks
|
$572.00
|
+3.62
0.64% |
$580.79
|
223,880
54.60% of 50 DAV
50 DAV is 410,000
|
$608.84
-6.05%
|
8/6/2021
|
$589.70
|
PP = $608.94
|
|
MB = $639.39
|
 Most Recent Note - 8/25/2021 5:21:39 PM
Y - Color code is changed to yellow after rebounding above its 50 DMA line ($564) with today's 4th consecutive gain backed by light volume. Prior lows in the $530 area define the next important near-term support to watch. Completed a new Public Offering on 8/11/21.
>>> FEATURED STOCK ARTICLE : Consolidating Near Prior Highs Facing Little Resistance - 8/9/2021 |
View all notes |
Set NEW NOTE alert |
Company Profile |
SEC
News |
Chart |
Request a new note
C
A
S
I |
BLDR
-
NYSE
Builders Firstsource Inc
Bldg-Constr Prds/Misc
|
$52.39
|
+1.25
2.44% |
$53.13
|
2,182,980
69.24% of 50 DAV
50 DAV is 3,153,000
|
$53.99
-2.96%
|
8/12/2021
|
$52.38
|
PP = $54.09
|
|
MB = $56.79
|
Most Recent Note - 8/25/2021 5:17:07 PM
Y - Posted a 4th consecutive gain today with below average volume but managed a best-ever close by 3 cents. Highlighted in yellow with pivot point cited based on its 5/10/21 high plus 10 cents in the 8/12/21 mid-day report. Subsequent gains above the pivot point backed by at least +40% above average volume may trigger a technical buy signal. Found support near its 200 DMA line. Fundamentals remain strong.
>>> FEATURED STOCK ARTICLE : Rebounding Near Prior High After Another Strong Quarter - 8/12/2021 |
View all notes |
Set NEW NOTE alert |
Company Profile |
SEC
News |
Chart |
Request a new note
C
A
S
I |
SNPS
-
NASDAQ
Synopsys Inc
COMPUTER SOFTWARE and SERVICES - Technical and System Software
|
$325.01
|
+0.06
0.02% |
$327.58
|
484,535
65.78% of 50 DAV
50 DAV is 736,600
|
$325.08
-0.02%
|
8/18/2021
|
$293.22
|
PP = $301.01
|
|
MB = $316.06
|
Most Recent Note - 8/25/2021 5:24:27 PM
G - Hit a new all-time high above its "max buy" level and its color code is changed to green after today's 5th gain following a noted "breakaway gap" backed by heavy volume. Prior high in the $300 area defines initial support to watch on pullbacks.
>>> FEATURED STOCK ARTICLE : Latest Earnings Report Missed the +25% Minimum Guideline - 8/18/2021 |
View all notes |
Set NEW NOTE alert |
Company Profile |
SEC
News |
Chart |
Request a new note
C
A
S
I |
CROX
-
NASDAQ
Crocs Inc
CONSUMER NON-DURABLES - Textile - Apparel Footwear
|
$143.81
|
-1.25
-0.86% |
$146.49
|
649,970
58.71% of 50 DAV
50 DAV is 1,107,000
|
$147.31
-2.38%
|
6/14/2021
|
$112.64
|
PP = $110.01
|
|
MB = $115.51
|
Most Recent Note - 8/20/2021 4:17:31 PM
G - Perched near its all-time high, extended from any sound base. Near-term support to watch is at its 50 DMA line ($124).
>>> FEATURED STOCK ARTICLE : Wedging Higher and Very Extended From Any Sound Base - 8/16/2021 |
View all notes |
Set NEW NOTE alert |
Company Profile |
SEC
News |
Chart |
Request a new note
C
A
S
I |
CRL
-
NYSE
Charles River Labs Intl
DRUGS - Biotechnology
|
$432.89
|
+5.38
1.26% |
$433.38
|
182,149
61.96% of 50 DAV
50 DAV is 294,000
|
$431.29
0.37%
|
6/9/2021
|
$345.91
|
PP = $349.23
|
|
MB = $366.69
|
Most Recent Note - 8/24/2021 6:02:56 PM
G - Extended from any sound base, stubbornly holding its ground. Recent volume totals have been lackluster while wedging into record high territory. Its 50 DMA line ($390) defines near-term support to watch on pullbacks. Three of the past 4 quarterly comparisons through Jun '21 have been above the +25% minimum earnings guideline (C criteria). See the latest FSU analysis for more details and a new annotated graph.
>>> FEATURED STOCK ARTICLE : Wedging Higher With Gains Lacking Volume Conviction - 8/24/2021 |
View all notes |
Set NEW NOTE alert |
Company Profile |
SEC
News |
Chart |
Request a new note
C
A
S
I |
Symbol/Exchange
Company Name
Industry Group |
PRICE |
CHANGE
(%Change) |
Day High |
Volume
(% DAV)
(% 50 day avg vol) |
52 Wk Hi
% From Hi |
Featured
Date |
Price
Featured |
Pivot Featured |
|
Max Buy |
REGN
-
NASDAQ
Regeneron Pharmaceutical
DRUGS - Biotechnology
|
$669.18
|
-0.77
-0.11% |
$674.00
|
602,720
74.78% of 50 DAV
50 DAV is 806,000
|
$674.07
-0.73%
|
8/20/2021
|
$669.82
|
PP = $664.74
|
|
MB = $697.98
|
Most Recent Note - 8/23/2021 12:38:56 PM
Y - Perched at its all-time high today while adding to an impressive spurt of volume-driven gains. Highlighted in yellow with pivot point cited based on its 7/20/20 high plus 10 cents in the 8/20/21 mid-day report. Subsequent gains and a strong close above its pivot point backed by at least +40% above average volume may trigger a technical buy signal.
>>> FEATURED STOCK ARTICLE : Regeneron Featured Hitting a New High - 8/20/2021 |
View all notes |
Set NEW NOTE alert |
Company Profile |
SEC
News |
Chart |
Request a new note
C
A
S
I |
GNRC
-
NYSE
Generac Hldgs Inc
Electrical-Power/Equipmt
|
$425.87
|
+6.97
1.66% |
$429.20
|
496,927
60.75% of 50 DAV
50 DAV is 818,000
|
$457.00
-6.81%
|
6/8/2021
|
$348.46
|
PP = $342.38
|
|
MB = $359.50
|
Most Recent Note - 8/23/2021 6:31:01 PM
G - Closed above its 50 DMA line ($413.80) with today's 4th consecutive gain helping its outlook improve. Fundamentals remain strong. Recent low ($385) defines important near term support to watch. See the latest FSU analysis for more detailed analysis and a new annotated graph.
>>> FEATURED STOCK ARTICLE : Rebound Above 50-Day Moving Average Helps Outlook - 8/23/2021 |
View all notes |
Set NEW NOTE alert |
Company Profile |
SEC
News |
Chart |
Request a new note
C
A
S
I |
CAMT
-
NASDAQ
Camtek Ltd
ELECTRONICS - Scientific and Technical Instrum
|
$41.15
|
+1.40
3.52% |
$41.80
|
418,455
219.09% of 50 DAV
50 DAV is 191,000
|
$40.47
1.68%
|
8/4/2021
|
$39.67
|
PP = $40.57
|
|
MB = $42.60
|
Most Recent Note - 8/25/2021 12:04:39 PM
Y - Hitting a new all-time high with today's 3rd consecutive gain backed by increasing volume. Color code was changed to yellow while rising near prior highs as it was noted - "Subsequent gains above the pivot point backed by at least +40% above average volume may trigger a proper technical buy signal. Rebounded above its 50 DMA line ($36.32) with a gap up on the prior session. Prior low ($32 30) defines the next important near-term support to watch. Fundamentals remain strong."
>>> FEATURED STOCK ARTICLE : Recent 50-Day Moving Average Violation Again Raised Concerns - 8/17/2021 |
View all notes |
Set NEW NOTE alert |
Company Profile |
SEC
News |
Chart |
Request a new note
C
A
S
I |
PKI
-
NYSE
Perkinelmer Inc
ELECTRONICS - Scientific and Technical Instrum
|
$185.02
|
+2.82
1.55% |
$185.39
|
487,996
64.55% of 50 DAV
50 DAV is 756,000
|
$188.40
-1.79%
|
8/18/2021
|
$181.07
|
PP = $188.50
|
|
MB = $197.93
|
Most Recent Note - 8/23/2021 6:43:18 PM
Y - Volume totals have been cooling while stubbornly holding its ground after forming a noted "3-weeks tight" base. Color code was changed to yellow with new pivot point cited based on its 8/05/21 high plus 10 cents. Its 50 DMA line ($165.51).and prior high ($162) define important near-term support to watch. Reported earnings +80% on +51% sales revenues for the Jun '21 quarter versus the year ago period.
>>> FEATURED STOCK ARTICLE : Powerful Volume-Driven Breakout After Earnings Report - 7/26/2021 |
View all notes |
Set NEW NOTE alert |
Company Profile |
SEC
News |
Chart |
Request a new note
C
A
S
I |
TRMB
-
NASDAQ
Trimble Inc
ELECTRONICS - Scientific and Technical Instrum
|
$94.21
|
+1.55
1.67% |
$94.23
|
842,454
87.66% of 50 DAV
50 DAV is 961,000
|
$93.07
1.22%
|
8/5/2021
|
$88.83
|
PP = $84.97
|
|
MB = $89.22
|
Most Recent Note - 8/25/2021 5:19:37 PM
G - Color code is changed to green as it hit a new all-time high above its "max buy" level with lighter volume behind today's 6th consecutive gain. Prior highs and its 50 DMA line near ($84) define near-term support to watch on pullbacks. Reported earnings +38% on +29% sales revenues for the Jun '21 quarter versus the year ago period. Three of the past 4 quarterly comparisons were above the +25% minimum earnings guideline (C criteria). Annual earnings (A criteria) growth has been strong and steady.
>>> FEATURED STOCK ARTICLE : Finished Strong With Gain for New High Backed by Volume - 8/5/2021 |
View all notes |
Set NEW NOTE alert |
Company Profile |
SEC
News |
Chart |
Request a new note
C
A
S
I |
Symbol/Exchange
Company Name
Industry Group |
PRICE |
CHANGE
(%Change) |
Day High |
Volume
(% DAV)
(% 50 day avg vol) |
52 Wk Hi
% From Hi |
Featured
Date |
Price
Featured |
Pivot Featured |
|
Max Buy |
UMC
-
NYSE
United Microelectrnc Adr
ELECTRONICS - Semiconductor - Integrated Cir
|
$11.26
|
+0.58
5.43% |
$11.37
|
12,680,633
185.12% of 50 DAV
50 DAV is 6,850,000
|
$11.71
-3.84%
|
8/5/2021
|
$11.62
|
PP = $11.38
|
|
MB = $11.95
|
Most Recent Note - 8/25/2021 12:33:30 PM
Y - Posting a 4th consecutive volume-driven gain today. Tested support at its 50 DMA line ($9.92) with volume-driven losses last week. Stalled since reaching a new 52-week high. A violation of its 50 DMA line would raise concerns and trigger a technical sell signal.
>>> FEATURED STOCK ARTICLE : Taiwan-Based Semiconductor Firm's Breakout Highlighted This Week - 8/6/2021 |
View all notes |
Set NEW NOTE alert |
Company Profile |
SEC
News |
Chart |
Request a new note
C
A
S
I |
ASML
-
NASDAQ
A S M L Holding N.V. NY
ELECTRONICS - Semiconductor Equipment and Mate
|
$807.87
|
+2.26
0.28% |
$813.37
|
470,806
71.66% of 50 DAV
50 DAV is 657,000
|
$812.50
-0.57%
|
5/25/2021
|
$669.59
|
PP = $675.75
|
|
MB = $709.54
|
Most Recent Note - 8/25/2021 3:41:21 PM
G - Perched at its all-time high, stubbornly holding its ground. Its 50 DMA line ($735) defines important near-term support to watch on pullbacks.
>>> FEATURED STOCK ARTICLE : Semi Equipment Firm Extended From Any Sound Base - 8/11/2021 |
View all notes |
Set NEW NOTE alert |
Company Profile |
SEC
News |
Chart |
Request a new note
C
A
S
I |
ENTG
-
NASDAQ
Entegris Inc
ELECTRONICS - Semiconductor Equipment and Mate
|
$115.75
|
+0.60
0.52% |
$116.50
|
493,229
73.61% of 50 DAV
50 DAV is 670,100
|
$126.41
-8.43%
|
8/4/2021
|
$125.33
|
PP = $126.51
|
|
MB = $132.84
|
Most Recent Note - 8/20/2021 4:21:09 PM
G - Still sputtering below its 50 DMA line ($118) after damaging losses raised greater concerns. A rebound above the 50 DMA line is needed for its outlook to improve. Subsequent gains and a close above the pivot point backed by at least +40% above average volume may trigger a proper technical buy signal. Fundamentals remain strong as it reported Jun '21 quarterly earnings +42% on +27% sales revenues. Its Relative Strength Rating is 80, right at the 80+ minimum guideline for buy candidates.
>>> FEATURED STOCK ARTICLE : Perched Near High After 6th Consecutive Gain - 8/4/2021 |
View all notes |
Set NEW NOTE alert |
Company Profile |
SEC
News |
Chart |
Request a new note
C
A
S
I |
HIBB
-
NASDAQ
Hibbett Inc
SPECIALTY RETAIL - Sporting Goods Stores
|
$97.12
|
+5.26
5.73% |
$100.23
|
632,130
157.25% of 50 DAV
50 DAV is 402,000
|
$98.35
-1.25%
|
8/25/2021
|
$99.58
|
PP = $98.45
|
|
MB = $103.37
|
Most Recent Note - 8/25/2021 12:18:30 PM
Y - Color code is changed to yellow with pivot point cited based on its 7/12/21 high plus 10 cents. Hitting a new all-time high with today's 4th consecutive gain. A gain and close above the pivot point backed by at least +40% above average volume may trigger a proper technical buy signal. Repaired another brief slump below its 50 DMA line ($87). Due to report Jul '21 quarterly results on 8/27/21. Reported very strong Apr '21 quarterly results. Versus the year ago periods it has shown 4 strong quarterly comparisons. Annual earnings (A criteria) history has been improving since a downturn in FY '17 and '18.
There are no Featured Stock Updates™ available for this stock at this time. You may request one by clicking the Request a New Note link below |
View all notes |
Set NEW NOTE alert |
Company Profile |
SEC
News |
Chart |
Request a new note
C
A
S
I |
CLFD
-
NASDAQ
Clearfield Inc
TELECOMMUNICATIONS - Cables / Satalite Equipment
|
$45.89
|
+0.34
0.75% |
$46.88
|
132,278
122.48% of 50 DAV
50 DAV is 108,000
|
$45.99
-0.22%
|
7/23/2021
|
$40.23
|
PP = $43.74
|
|
MB = $45.93
|
Most Recent Note - 8/24/2021 12:41:53 PM
Y - Hitting a new 52-week high with today's 3rd consecutive gain after a brief consolidation above its 50 DMA line. Fundamentals remain strong. Bullish action came after it reported Jun '21 quarterly earnings +100% on +49% sales revenues.
>>> FEATURED STOCK ARTICLE : Big Volume-Driven Gain Challenging Prior High After Earnings - 7/23/2021 |
View all notes |
Set NEW NOTE alert |
Company Profile |
SEC
News |
Chart |
Request a new note
C
A
S
I |
Symbol/Exchange
Company Name
Industry Group |
PRICE |
CHANGE
(%Change) |
Day High |
Volume
(% DAV)
(% 50 day avg vol) |
52 Wk Hi
% From Hi |
Featured
Date |
Price
Featured |
Pivot Featured |
|
Max Buy |
POOL
-
NASDAQ
Pool Corp
WHOLESALE - Basic Materials Wholesale
|
$485.02
|
+7.43
1.56% |
$486.66
|
117,120
46.66% of 50 DAV
50 DAV is 251,000
|
$495.22
-2.06%
|
8/19/2021
|
$484.37
|
PP = $495.32
|
|
MB = $520.09
|
Most Recent Note - 8/23/2021 6:35:26 PM
Y - Suffered a big loss today with light volume. Color code was changed to yellow after forming an advanced "3-weeks tight" base. Subsequent gains above the pivot point backed by at least +40% above average volume may trigger a new (or add-on) technical buy signal. Volume totals cooled in recent weeks while stubbornly holding its ground perched at its all-time high. Its 50 DMA line ($467) defines important near-term support to watch on pullbacks.
>>> FEATURED STOCK ARTICLE : Churned Heavy Volume While Testing 50-Day Moving Average - 7/22/2021 |
View all notes |
Set NEW NOTE alert |
Company Profile |
SEC
News |
Chart |
Request a new note
C
A
S
I |
SMPL
-
NASDAQ
Simply Good Foods Co
Food-Confectionery
|
$34.99
|
+0.24
0.69% |
$35.28
|
334,783
71.53% of 50 DAV
50 DAV is 468,000
|
$38.50
-9.12%
|
12/28/2020
|
$30.40
|
PP = $31.44
|
|
MB = $33.01
|
Most Recent Note - 8/23/2021 6:38:17 PM
G - Posted a 3rd consecutive gain today but remains below its 50 DMA line ($36.42). Recent low ($33.91 on 8/19/21) defines important support where more damaging losses would raise greater concerns. Reported May '21 quarterly earnings +65% on +32% sales revenues versus the year ago period, well above the +25% minimum earnings guideline (C criteria).
>>> FEATURED STOCK ARTICLE : Pulled Back from High With Small Losses on Light Volume - 7/15/2021 |
View all notes |
Set NEW NOTE alert |
Company Profile |
SEC
News |
Chart |
Request a new note
C
A
S
I |
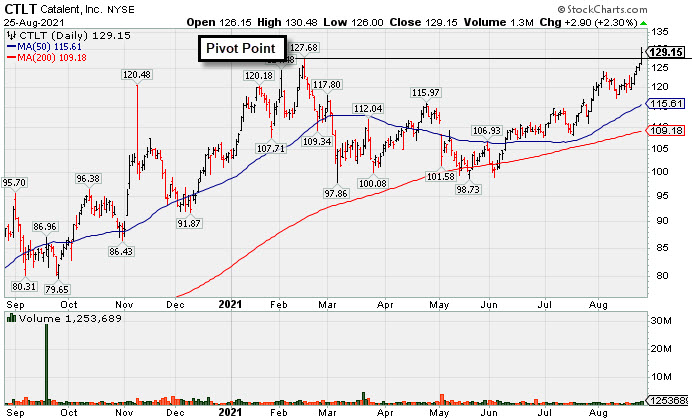
CTLT
-
NYSE
Catalent Inc
DRUGS - Biotechnology
|
$129.15
|
+2.90
2.30% |
$130.48
|
1,253,689
185.46% of 50 DAV
50 DAV is 676,000
|
$127.68
1.15%
|
8/25/2021
|
$128.72
|
PP = $127.78
|
|
MB = $134.17
|
Most Recent Note - 8/25/2021 5:14:57 PM
Y - Finished strong after highlighted in yellow with pivot point cited based on its 2/16/21 high plus 10 cents in the earlier mid-day report. Volume was +69% above average behind today's 5th consecutive gain while hitting a new all-time high. The gain and close above its pivot point clinched a technical buy signal. Reported earnings +64% on +38% sales revenues for the Mar '21 quarter versus the year ago period, its 4th quarterly comparison above the +25% minimum earnings guideline (C criteria). Annual earnings (A criteria) history has been steadily improving after a downturn in FY '16. See the latest FSU analysis for more details and a new annotated graph.
>>> FEATURED STOCK ARTICLE : Strong Gain Triggered Technical Buy Signal - 8/25/2021 |
View all notes |
Set NEW NOTE alert |
Company Profile |
SEC
News |
Chart |
Request a new note
C
A
S
I |
SQ
-
NYSE
Square Inc Cl A
Finance-CrdtCard/PmtPr
|
$267.57
|
-2.60
-0.96% |
$270.33
|
3,401,320
41.23% of 50 DAV
50 DAV is 8,250,000
|
$289.23
-7.49%
|
8/2/2021
|
$273.78
|
PP = $283.29
|
|
MB = $297.45
|
Most Recent Note - 8/25/2021 5:25:32 PM
Y - Volume totals have been cooling in recent weeks since it stalled after reaching a new all-time high. Reported Jun '21 quarterly earnings +267% on +143% sales revenues versus the year ago period, its 4th strong comparison well above the +25% minimum guideline (C criteria).
>>> FEATURED STOCK ARTICLE : Pullback Following Big Gain on Strong Earnings and M&A News - 8/3/2021 |
View all notes |
Set NEW NOTE alert |
Company Profile |
SEC
News |
Chart |
Request a new note
C
A
S
I |
SHOP
-
NYSE
Shopify Inc Cl A
Computer Sftwr-Enterprse
|
$1,552.24
|
+13.73
0.89% |
$1,555.97
|
796,249
57.00% of 50 DAV
50 DAV is 1,397,000
|
$1,650.00
-5.92%
|
7/2/2021
|
$1,468.00
|
PP = $1,552.23
|
|
MB = $1,629.84
|
Most Recent Note - 8/24/2021 1:06:27 PM
Y - Gapped up today. Finding prompt support while recently consolidating near its 50 DMA line ($1,499). Also tested February 2021 highs which help define important near-term support to watch. More damaging losses would raise concerns and trigger technical sell signals. Fundamentals remain strong.
>>> FEATURED STOCK ARTICLE : Managed a Positive Reversal After Early Weakness - 7/19/2021 |
View all notes |
Set NEW NOTE alert |
Company Profile |
SEC
News |
Chart |
Request a new note
C
A
S
I |
Symbol/Exchange
Company Name
Industry Group |
PRICE |
CHANGE
(%Change) |
Day High |
Volume
(% DAV)
(% 50 day avg vol) |
52 Wk Hi
% From Hi |
Featured
Date |
Price
Featured |
Pivot Featured |
|
Max Buy |
YETI
-
NYSE
Yeti Holdings Inc
Leisure-Products
|
$101.78
|
+2.20
2.21% |
$102.04
|
725,007
71.85% of 50 DAV
50 DAV is 1,009,000
|
$105.62
-3.64%
|
5/13/2021
|
$84.20
|
PP = $90.65
|
|
MB = $95.18
|
Most Recent Note - 8/24/2021 6:07:34 PM
G - Holding its ground after a pullback last week testing its 50 DMA line ($94.75) which defines near-term support to watch. There was a noted "negative reversal" after hitting a new all-time high on 8/06/21. Reported Jun '21 quarterly earnings +66% on +45% sales revenues versus the year ago period, continuing its strong earnings track record.
>>> FEATURED STOCK ARTICLE : Important Test of 50-Day Moving Average Line - 8/19/2021 |
View all notes |
Set NEW NOTE alert |
Company Profile |
SEC
News |
Chart |
Request a new note
C
A
S
I |
DOCU
-
NASDAQ
Docusign Inc
Computer Sftwr-Enterprse
|
$298.90
|
+4.91
1.67% |
$299.78
|
1,514,763
73.25% of 50 DAV
50 DAV is 2,068,000
|
$314.76
-5.04%
|
7/6/2021
|
$288.96
|
PP = $290.33
|
|
MB = $304.85
|
Most Recent Note - 8/25/2021 3:43:58 PM
Y - Found support at its 50 DMA line ($289) but it has not formed a sound base. A damaging violation would raise greater concerns and trigger a technical sell signal.
>>> FEATURED STOCK ARTICLE : Reversed From High After Recently Wedging Higher Without Volume - 8/13/2021 |
View all notes |
Set NEW NOTE alert |
Company Profile |
SEC
News |
Chart |
Request a new note
C
A
S
I |
JEF
-
NYSE
Jefferies Financial Grp
Finance-Invest Bnk/Bkrs
|
$36.77
|
+0.72
2.00% |
$36.93
|
1,940,822
96.32% of 50 DAV
50 DAV is 2,015,000
|
$36.42
0.96%
|
6/28/2021
|
$31.81
|
PP = $34.42
|
|
MB = $36.14
|
Most Recent Note - 8/23/2021 6:40:15 PM
Y - Gapped up today challenging its all-time high with a solid gain backed by average volume. Its 50 DMA line ($33.10) defines near-term support to watch. More damaging losses would raise concerns and trigger a technical sell signal. As previously noted - "Subsequent gains above the pivot point backed by at least +40% above average volume are necessary to trigger a technical buy signal."
>>> FEATURED STOCK ARTICLE : Quiet Gains for New High Closes - 8/10/2021 |
View all notes |
Set NEW NOTE alert |
Company Profile |
SEC
News |
Chart |
Request a new note
C
A
S
I |
CLAR
-
NASDAQ
Clarus Corporation
Leisure-Products
|
$27.48
|
+0.68
2.54% |
$27.63
|
119,397
54.77% of 50 DAV
50 DAV is 218,000
|
$32.36
-15.08%
|
5/12/2021
|
$21.40
|
PP = $19.73
|
|
MB = $20.72
|
Most Recent Note - 8/25/2021 3:39:49 PM
G - Rebounding above its 50 DMA line ($27.09) helping its technical stance and outlook with today's gain backed by light volume. Fundamentals remain strong.
>>> FEATURED STOCK ARTICLE : Extended From Prior Base and Hitting Another New High - 7/20/2021 |
View all notes |
Set NEW NOTE alert |
Company Profile |
SEC
News |
Chart |
Request a new note
C
A
S
I |
AVTR
-
NYSE
Avantor Inc
Medical-Research Eqp/Svc
|
$39.37
|
+0.44
1.13% |
$39.55
|
2,335,783
67.27% of 50 DAV
50 DAV is 3,472,000
|
$39.45
-0.20%
|
6/10/2021
|
$32.94
|
PP = $34.09
|
|
MB = $35.79
|
Most Recent Note - 8/25/2021 3:42:35 PM
G - Quietly wedging into new all-time high territory, extended from any sound base. Its 50 DMA line ($36.92) defines near-term support to watch on pullbacks.
>>> FEATURED STOCK ARTICLE : Held Ground But Made Little Price Progress Since Featured - 7/14/2021 |
View all notes |
Set NEW NOTE alert |
Company Profile |
SEC
News |
Chart |
Request a new note
C
A
S
I |
Symbol/Exchange
Company Name
Industry Group |
PRICE |
CHANGE
(%Change) |
Day High |
Volume
(% DAV)
(% 50 day avg vol) |
52 Wk Hi
% From Hi |
Featured
Date |
Price
Featured |
Pivot Featured |
|
Max Buy |
MIME
-
NASDAQ
Mimecast Limited
Computer Sftwr-Security
|
$67.60
|
+4.95
7.90% |
$71.30
|
4,857,367
850.68% of 50 DAV
50 DAV is 571,000
|
$62.73
7.76%
|
8/2/2021
|
$56.12
|
PP = $59.58
|
|
MB = $62.56
|
Most Recent Note - 8/25/2021 12:23:48 PM
G - Hit a new all-time high with today's big gap up and volume-driven gain above its "max buy" level and its color code is changed to green. Fundamentals remain strong. When featured in yellow on 8/02/21 the pivot point cited was based on its 12/28/20 high plus 10 cents. Prior highs in the $59 area define initial support to watch on pullbacks.
>>> FEATURED STOCK ARTICLE : Perched Not Far From High With Earnings News Due Pre-Open - 8/2/2021 |
View all notes |
Set NEW NOTE alert |
Company Profile |
SEC
News |
Chart |
Request a new note
C
A
S
I |