You are not logged in.
This means you
CAN ONLY VIEW reports that were published prior to Thursday, March 20, 2025.
You
MUST UPGRADE YOUR MEMBERSHIP if you want to see any current reports.
AFTER MARKET UPDATE - THURSDAY, DECEMBER 28TH, 2017
Previous After Market Report Next After Market Report >>>
|
|
|
|
DOW |
+63.21 |
24,837.51 |
+0.26% |
|
Volume |
527,117,710 |
-4% |
|
Volume |
1,311,623,980 |
-5% |
|
NASDAQ |
+10.82 |
6,950.16 |
+0.16% |
|
Advancers |
1,931 |
66% |
|
Advancers |
1,656 |
57% |
|
S&P 500 |
+4.92 |
2,687.54 |
+0.18% |
|
Decliners |
995 |
34% |
|
Decliners |
1,226 |
43% |
|
Russell 2000 |
+4.99 |
1,548.93 |
+0.32% |
|
52 Wk Highs |
130 |
|
|
52 Wk Highs |
108 |
|
|
S&P 600 |
+3.69 |
943.40 |
+0.39% |
|
52 Wk Lows |
24 |
|
|
52 Wk Lows |
27 |
|
|
 |
Indices Quietly Edged Higher With Less Leadership
Kenneth J. Gruneisen - Passed the CAN SLIM® Master's Exam
Stocks advanced modestly on Thursday. The Dow climbed 63 points to an all-time high of 24837. The S&P 500 added 4 points to 2687, while the Nasdaq advanced 10 points to 6950. Volume totals reported were lighter than the prior session totals on the NYSE and on the Nasdaq exchange. Advancers led decliners by nearly a 2-1 margin on the NYSE and by 4-3 margin on the Nasdaq exchange. There were 42 high-ranked companies from the Leaders List that made new 52-week highs and were listed on the BreakOuts Page, down from the total of 51 on the prior session. New 52-week highs totals outnumbered new 52-week lows on the NYSE and on the Nasdaq exchange. The Featured Stocks Page provides the latest analysis on noteworthy high-ranked leaders. Charts used courtesy of www.stockcharts.com
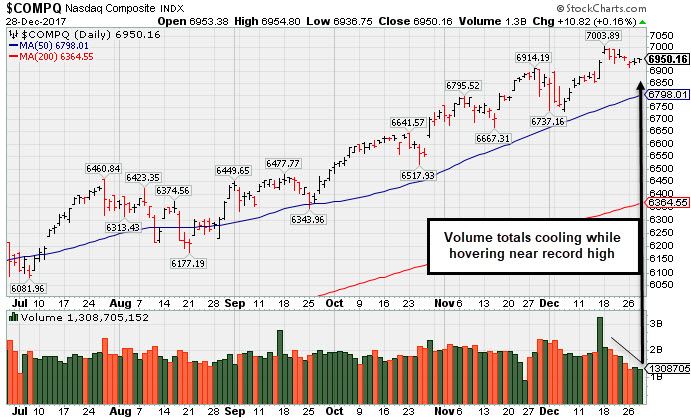 PICTURED: The Nasdaq Composite Index is hovering near its record high with volume totals cooling. The index is up +29.1% year-to-date.
The major averages (M criteria) are in a confirmed uptrend. Investors should only consider stocks meeting all key criteria of the fact-based investment system as they trigger technical buy signals.
U.S. equities increased with Treasury yields while the dollar slumped on the second to last trading session of 2017. In economic news, weekly jobless claims came in at 245,000 versus consensus expectations of 240,000. A separate release showed the Chicago PMI for December rose to 67.6, its highest since March 2011, and above the expected 62 reading.
Eight of 11 sectors in the S&P 500 finished in positive territory with Telecom and Utilities shares leading the way. AT&T (T +0.75%). NiSource (NI +1.27%) rose. Shares of Netflix (NFLX +3.47%) and Northern Trust (NTRS +1.66%) as Consumer Discretionary and Financials also outperformed on the session. Consumer Staples lagged with Altria (MO -1.60%).
U.S. Treasury yields rose, sending prices lower along the curve. The yield on the benchmark 10-year note ended up two basis points to 2.43% after its sharpest decline since September on Wednesday. The U.S Dollar Index declined 0.4% on the session and is on pace for its worst year since 2003. In the commodity complex, while NYMEX WTI crude added 0.4% at $59.89/barrel. COMEX gold rose 0.2% to $1287.00, the highest level in a month. |
 Kenneth J. Gruneisen started out as a licensed stockbroker in August 1987, a couple of months prior to the historic stock market crash that took the Dow Jones Industrial Average down -22.6% in a single day. He has published daily fact-based fundamental and technical analysis on high-ranked stocks online for two decades. Through FACTBASEDINVESTING.COM, Kenneth provides educational articles, news, market commentary, and other information regarding proven investment systems that work in good times and bad.
Comments contained in the body of this report are technical opinions only and are not necessarily those of Gruneisen Growth Corp. The material herein has been obtained from sources believed to be reliable and accurate, however, its accuracy and completeness cannot be guaranteed. Our firm, employees, and customers may effect transactions, including transactions contrary to any recommendation herein, or have positions in the securities mentioned herein or options with respect thereto. Any recommendation contained in this report may not be suitable for all investors and it is not to be deemed an offer or solicitation on our part with respect to the purchase or sale of any securities. |
|
 |
Financial, Retail, and Tech Groups Rose
Kenneth J. Gruneisen - Passed the CAN SLIM® Master's Exam
The Retail Index ($RLX +0.34%) and Bank Index ($BKX +0.45%) both outpaced the Broker/Dealer Index ($XBD +0.15%) on Thursday. The Biotechnology Index ($BTK +0.35%), Networking Index ($NWX +0.18%) and the Semiconductor Index ($SOX +0.23%) each posted a small gain as the tech sector helped the market's positive bias. Commodity-linked groups were mixed and little changed as the Gold & Silver Index ($XAU +0.16%), Integrated Oil Index ($XOI +0.15%) both inched higher but the Oil Services Index ($OSX -0.24%) ended the session slightly lower. Charts courtesy wwwstockcharts.com
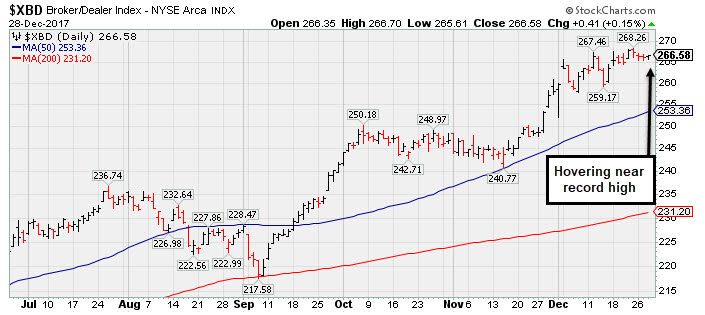 PICTURED: The Broker/Dealer Index ($XBD +0.15%) is hovering near its record high.
| Oil Services |
$OSX |
148.54 |
-0.35 |
-0.24% |
-19.18% |
| Integrated Oil |
$XOI |
1,340.65 |
+1.99 |
+0.15% |
+5.73% |
| Semiconductor |
$SOX |
1,266.30 |
+2.94 |
+0.23% |
+39.70% |
| Networking |
$NWX |
500.41 |
+0.91 |
+0.18% |
+12.17% |
| Broker/Dealer |
$XBD |
266.58 |
+0.41 |
+0.15% |
+29.86% |
| Retail |
$RLX |
1,747.02 |
+5.86 |
+0.34% |
+30.09% |
| Gold & Silver |
$XAU |
85.45 |
+0.13 |
+0.15% |
+8.36% |
| Bank |
$BKX |
107.63 |
+0.48 |
+0.45% |
+17.26% |
| Biotech |
$BTK |
4,272.40 |
+14.75 |
+0.35% |
+38.94% |
|
|
|
 |
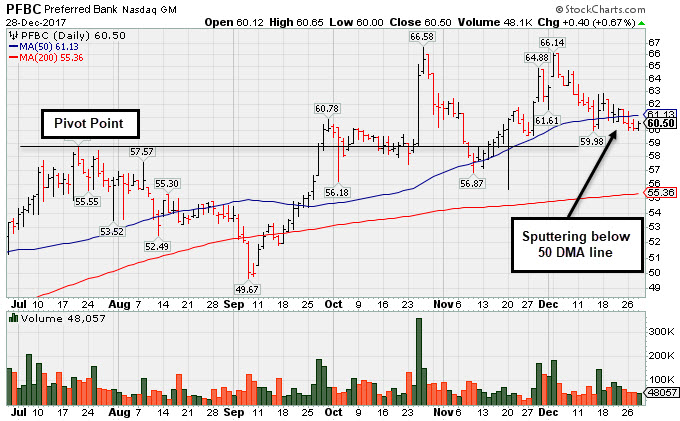
Concerns Raised by Relative Strength and 50 DMA Line Breach
Kenneth J. Gruneisen - Passed the CAN SLIM® Master's Exam
Preferred Bank Los Angeles (PFBC +$0.40 or +0.67% to $60.50) is quietly sputtering below its 50-day moving average (DMA) line ($61.12). Its Relative Strength rank is currently 64, below the 80+ minimum guideline for buy candidates. A rebound above its 50 DMA line is needed for its outlook to improve. Prior lows and its 200 DMA line define the next important chart support in the $55 area.
Recently it reported earnings +36% on +33% sales revenues for the Sep '17 quarter, its 4th consecutive quarterly comparison above the +25% minimum guideline (C criteria). Its annual earnings (A criteria) history has been strong after a downturn in FY '12.
It currently has a Timeliness rating of B and a Sponsorship rating of B. The number of top-rated funds owning its shares rose from 262 in Dec '16 to 300 in Sep '17, a reassuring sign concerning the I criteria. Its current Up/Down Volume Ratio of 1.3 is an unbiased indication its shares have been under accumulation over the past 50 days.
|
|
|
Color Codes Explained :
Y - Better candidates highlighted by our
staff of experts.
G - Previously featured
in past reports as yellow but may no longer be buyable under the
guidelines.
***Last / Change / Volume data in this table is the closing quote data***
Symbol/Exchange
Company Name
Industry Group |
PRICE |
CHANGE
(%Change) |
Day High |
Volume
(% DAV)
(% 50 day avg vol) |
52 Wk Hi
% From Hi |
Featured
Date |
Price
Featured |
Pivot Featured |
|
Max Buy |
THO
-
NYSE
Thor Industries Inc
AUTOMOTIVE - Recreational Vehicles
|
$153.01
|
+0.91
0.60% |
$153.15
|
250,527
40.15% of 50 DAV
50 DAV is 624,000
|
$156.86
-2.45%
|
12/19/2017
|
$153.92
|
PP = $156.96
|
|
MB = $164.81
|
Most Recent Note - 12/27/2017 6:07:51 PM
Y - Holding its ground stubbornly near its all-time high while volume totals have been cooling. Subsequent gains above the pivot point backed by at least +40% above average volume may trigger a new (or add-on) technical buys signal. Its 50 DMA line ($140.45) and prior highs in the $138 area define near-term support to watch. Fundamentals remain strong. See the latest FSU analysis for more details and a new annotated graph.
>>> FEATURED STOCK ARTICLE : Holding Ground in Tight Range Near High - 12/27/2017 |
View all notes |
Set NEW NOTE alert |
Company Profile |
SEC
News |
Chart |
Request a new note
C
A
S
I |
PFBC
-
NASDAQ
Preferred Bank Los Angls
BANKING - Regional - Pacific Banks
|
$60.50
|
+0.40
0.67% |
$60.65
|
48,057
62.57% of 50 DAV
50 DAV is 76,800
|
$66.58
-9.13%
|
10/10/2017
|
$59.38
|
PP = $59.08
|
|
MB = $62.03
|
 Most Recent Note - 12/28/2017 5:16:31 PM
G - Color code is changed to green after sputtering below its 50 DMA line. Relative Strength rank has slumped. Fundamentals remain strong. See the latest FSU analysis for more details and an annotated graph.
>>> FEATURED STOCK ARTICLE : Concerns Raised by Relative Strength and 50 DMA Line Breach - 12/28/2017 |
View all notes |
Set NEW NOTE alert |
Company Profile |
SEC
News |
Chart |
Request a new note
C
A
S
I |
AVGO
-
NASDAQ
Avago Technologies Ltd
ELECTRONICS - Semiconductor - Broad Line
|
$260.42
|
+1.30
0.50% |
$260.80
|
1,364,069
39.96% of 50 DAV
50 DAV is 3,413,400
|
$285.68
-8.84%
|
10/30/2017
|
$261.19
|
PP = $259.46
|
|
MB = $272.43
|
Most Recent Note - 12/26/2017 11:19:59 AM
G - Gapped down today slumping below its 50 DMA line ($262.96) toward the recent low ($254.20 on 12/06/17). More damaging losses would raise greater concerns. Fundamentals remain strong.
>>> FEATURED STOCK ARTICLE : Testing Support at Prior Highs and 50-Day Average - 12/8/2017 |
View all notes |
Set NEW NOTE alert |
Company Profile |
SEC
News |
Chart |
Request a new note
C
A
S
I |
TPL
-
NYSE
Texas Pacific Land Trust
FINANCIAL SERVICES - Diversified Investments
|
$440.53
|
-9.53
-2.12% |
$452.93
|
7,480
62.33% of 50 DAV
50 DAV is 12,000
|
$458.00
-3.81%
|
12/21/2017
|
$419.50
|
PP = $435.09
|
|
MB = $456.84
|
Most Recent Note - 12/27/2017 1:28:12 PM
Y - Hitting another new all-time high with today's 7th consecutive gain. Rose above its pivot point on the prior session with +35% above average volume. Previously noted - "Highlighted in yellow with pivot point cited based on its 10/13/17 high plus 10 cents in the 12/21/17 mid-day report. Subsequent gains above the pivot point backed by at least +40% above average volume are needed to trigger a proper technical buy signal. "
>>> FEATURED STOCK ARTICLE : Real Estate Trust Perched Within Striking Distance of Prior High - 12/21/2017 |
View all notes |
Set NEW NOTE alert |
Company Profile |
SEC
News |
Chart |
Request a new note
C
A
S
I |
YY
-
NASDAQ
YY Inc Ads
INTERNET - Internet Service Providers
|
$113.36
|
-1.59
-1.38% |
$116.79
|
408,121
28.05% of 50 DAV
50 DAV is 1,455,000
|
$123.48
-8.20%
|
9/25/2017
|
$80.26
|
PP = $83.10
|
|
MB = $87.26
|
Most Recent Note - 12/22/2017 6:42:59 PM
G - Found support above its prior high ($97.59 on 10/16/17) and above its 50 DMA line ($101.20) while building on a new base. Fundamentals remain strong.
>>> FEATURED STOCK ARTICLE : Fundamentals Remain Strong; Extended From Any Sound Base - 12/11/2017 |
View all notes |
Set NEW NOTE alert |
Company Profile |
SEC
News |
Chart |
Request a new note
C
A
S
I |
Symbol/Exchange
Company Name
Industry Group |
PRICE |
CHANGE
(%Change) |
Day High |
Volume
(% DAV)
(% 50 day avg vol) |
52 Wk Hi
% From Hi |
Featured
Date |
Price
Featured |
Pivot Featured |
|
Max Buy |
HTHT
-
NASDAQ
China Lodging Group Ads
LEISURE - Lodging
|
$140.69
|
+0.10
0.07% |
$141.85
|
569,372
91.10% of 50 DAV
50 DAV is 625,000
|
$142.80
-1.48%
|
12/22/2017
|
$138.07
|
PP = $142.90
|
|
MB = $150.05
|
Most Recent Note - 12/22/2017 6:30:21 PM
Y - Color code is changed to yellow with new pivot point cited based on its 10/25/17 high plus 10 cents. Subsequent volume-driven gains for new highs may trigger a new (or add-on) technical buy signal. Posted 7 consecutive gains while approaching prior highs. Rebounded above its 50 DMA line helping its outlook to improve. Fundamentals remain strong. See the latest FSU analysis for more details and a new annotated graph.
>>> FEATURED STOCK ARTICLE : Sales Revenues Growth Rate Shows Acceleration - 12/22/2017 |
View all notes |
Set NEW NOTE alert |
Company Profile |
SEC
News |
Chart |
Request a new note
C
A
S
I |
PATK
-
NASDAQ
Patrick Industries Inc
Bldg-Mobile/Mfg and RV
|
$69.75
|
+1.15
1.68% |
$70.11
|
105,303
74.68% of 50 DAV
50 DAV is 141,000
|
$69.72
0.04%
|
10/26/2017
|
$90.90
|
PP = $87.90
|
|
MB = $92.30
|
Most Recent Note - 12/26/2017 11:29:16 AM
G - Perched at its all-time high while on track today for a 4th consecutive gain. Prior high in the $64 area and its 50 DMA line ($62.24) define important near-term support to watch where violations would raise concerns. Fundamentals remain strong. Shares split 3/2 effective 12/11/17, so do not be confused by the impact on the share prices.
>>> FEATURED STOCK ARTICLE : Hovering Near High Following 3:2 Share Split - 12/15/2017 |
View all notes |
Set NEW NOTE alert |
Company Profile |
SEC
News |
Chart |
Request a new note
C
A
S
I |
ESNT
-
NYSE
Essent Group Ltd
Finance-MrtgandRel Svc
|
$44.60
|
+0.18
0.41% |
$44.71
|
252,815
28.03% of 50 DAV
50 DAV is 902,000
|
$47.29
-5.69%
|
10/9/2017
|
$39.75
|
PP = $41.54
|
|
MB = $43.62
|
Most Recent Note - 12/26/2017 11:21:17 AM
G - Quietly consolidating above its 50 DMA line ($44.19) and recent low ($43.07 on 12/01/17) defining near-term support. Fundamentals remain strong.
>>> FEATURED STOCK ARTICLE : Pulling Back After Recently Wedging Higher - 12/14/2017 |
View all notes |
Set NEW NOTE alert |
Company Profile |
SEC
News |
Chart |
Request a new note
C
A
S
I |
FIVE
-
NASDAQ
Five Below Inc
Retail-DiscountandVariety
|
$68.03
|
+0.19
0.28% |
$68.20
|
441,041
43.84% of 50 DAV
50 DAV is 1,006,000
|
$68.98
-1.38%
|
10/6/2017
|
$57.13
|
PP = $54.23
|
|
MB = $56.94
|
Most Recent Note - 12/26/2017 11:18:07 AM
G - Rising near its all-time high with today's early gain. Very extended from its prior base, its 50 DMA line ($60.49) defines near-term support above prior highs in the $57-58 area. Fundamentals remain strong.
>>> FEATURED STOCK ARTICLE : Retail - Discount & Variety Firm Has Strong Fundamentals - 12/19/2017 |
View all notes |
Set NEW NOTE alert |
Company Profile |
SEC
News |
Chart |
Request a new note
C
A
S
I |
OLED
-
NASDAQ
Universal Display Corp
Elec-Misc Products
|
$174.80
|
-1.55
-0.88% |
$178.45
|
447,913
48.69% of 50 DAV
50 DAV is 920,000
|
$192.75
-9.31%
|
8/31/2017
|
$128.22
|
PP = $127.78
|
|
MB = $134.17
|
Most Recent Note - 12/27/2017 6:10:51 PM
G - Found support above its 50 DMA line ($165.29) and above the prior low ($158.00 on 12/05/17). Subsequent losses leading to violations may trigger technical sell signals. Has not formed a sound base pattern. Fundamentals remain strong.
>>> FEATURED STOCK ARTICLE : Consolidating After +50% Rally Since First Featured 8/31/17 - 12/13/2017 |
View all notes |
Set NEW NOTE alert |
Company Profile |
SEC
News |
Chart |
Request a new note
C
A
S
I |
Symbol/Exchange
Company Name
Industry Group |
PRICE |
CHANGE
(%Change) |
Day High |
Volume
(% DAV)
(% 50 day avg vol) |
52 Wk Hi
% From Hi |
Featured
Date |
Price
Featured |
Pivot Featured |
|
Max Buy |
ANET
-
NYSE
Arista Networks Inc
TELECOMMUNICATIONS - Communication Equipment
|
$240.64
|
+1.14
0.48% |
$241.50
|
416,426
48.37% of 50 DAV
50 DAV is 861,000
|
$245.65
-2.04%
|
10/27/2017
|
$195.65
|
PP = $196.37
|
|
MB = $206.19
|
Most Recent Note - 12/26/2017 11:36:37 AM
G - Perched within close striking distance of its all-time high. . Its 50 DMA line ($217) defines near-term support above the prior low ($206.86 on 12/05/17). Subsequent violations would trigger technical sell signals.
>>> FEATURED STOCK ARTICLE : Halted Volume-Driven Pullback at 50-Day Moving Average Line - 12/6/2017 |
View all notes |
Set NEW NOTE alert |
Company Profile |
SEC
News |
Chart |
Request a new note
C
A
S
I |
GRUB
-
NYSE
Grubhub Inc
COMPUTER SOFTWARE and SERVICES - Technical and System Software
|
$72.19
|
-0.95
-1.30% |
$73.54
|
557,306
39.75% of 50 DAV
50 DAV is 1,402,000
|
$74.81
-3.50%
|
6/21/2017
|
$47.33
|
PP = $46.94
|
|
MB = $49.29
|
Most Recent Note - 12/26/2017 11:38:26 AM
G - Perched near its all-time high, very extended from any sound base, its 50 DMA line ($64.22) defines initial support above prior highs near $57. Bullish action has continued although the 2 latest quarters were below the +25% minimum earnings guideline (C criteria), raising fundamental concerns with regard to the fact-based investment system.
>>> FEATURED STOCK ARTICLE : Extended From Any Base, Grubhub Hits Another New Record High - 12/18/2017 |
View all notes |
Set NEW NOTE alert |
Company Profile |
SEC
News |
Chart |
Request a new note
C
A
S
I |
IBP
-
NYSE
Installed Building Prod
DIVERSIFIED SERVICES - Business/Management Services
|
$76.20
|
-0.05
-0.07% |
$76.50
|
113,989
59.99% of 50 DAV
50 DAV is 190,000
|
$79.40
-4.03%
|
12/26/2017
|
$75.00
|
PP = $79.50
|
|
MB = $83.48
|
Most Recent Note - 12/26/2017 6:41:51 PM
Y - Color code is changed to yellow with new pivot point cited based on its 12/04/17 high plus 10 cents after forming an advanced ascending base. Recently found support at its 50 DMA line ($69.63). Subsequent losses leading to a violation of the 50 DMA line or recent low ($68.30 on 12/13/17) may trigger technical sell signals. Fundamentals remain strong. See the latest FSU analysis for more details and a new annotated graph.
>>> FEATURED STOCK ARTICLE : Building on an Advanced Ascending Base Pattern - 12/26/2017 |
View all notes |
Set NEW NOTE alert |
Company Profile |
SEC
News |
Chart |
Request a new note
C
A
S
I |
OLLI
-
NASDAQ
Ollie's Bargain Outlet
Retail-DiscountandVariety
|
$53.60
|
+0.35
0.66% |
$53.88
|
308,647
59.93% of 50 DAV
50 DAV is 515,000
|
$54.30
-1.29%
|
11/21/2017
|
$46.78
|
PP = $47.00
|
|
MB = $49.35
|
Most Recent Note - 12/26/2017 11:27:43 AM
G - Extended from its prior base, hitting yet another new all-time high today. Its 50 DMA line defines important near-term support coinciding with prior highs in the $46 area. Fundamentals remain strong.
>>> FEATURED STOCK ARTICLE : Extended From Latest Base and Perched Near Record High - 12/20/2017 |
View all notes |
Set NEW NOTE alert |
Company Profile |
SEC
News |
Chart |
Request a new note
C
A
S
I |
HLI
-
NYSE
Houlihan Lokey Inc Cl A
Finance-Invest Bnk/Bkrs
|
$45.75
|
+0.39
0.86% |
$45.75
|
136,558
53.55% of 50 DAV
50 DAV is 255,000
|
$46.99
-2.64%
|
9/18/2017
|
$37.04
|
PP = $39.78
|
|
MB = $41.77
|
Most Recent Note - 12/26/2017 11:22:41 AM
G - Perched near its all-time high, extended from any sound base. Its 50 DMA line ($43.23) defines near-term support to watch. Made gradual progress since 10/26/17 when it priced a Secondary Offering. Fundamentals remain strong.
>>> FEATURED STOCK ARTICLE : Wedging Higher With Recent Gains Lacking Great Volume - 12/12/2017 |
View all notes |
Set NEW NOTE alert |
Company Profile |
SEC
News |
Chart |
Request a new note
C
A
S
I |
Symbol/Exchange
Company Name
Industry Group |
PRICE |
CHANGE
(%Change) |
Day High |
Volume
(% DAV)
(% 50 day avg vol) |
52 Wk Hi
% From Hi |
Featured
Date |
Price
Featured |
Pivot Featured |
|
Max Buy |
|
|
|
THESE ARE NOT BUY RECOMMENDATIONS!
Comments contained in the body of this report are technical
opinions only. The material herein has been obtained
from sources believed to be reliable and accurate, however,
its accuracy and completeness cannot be guaranteed.
This site is not an investment advisor, hence it does
not endorse or recommend any securities or other investments.
Any recommendation contained in this report may not
be suitable for all investors and it is not to be deemed
an offer or solicitation on our part with respect to
the purchase or sale of any securities. All trademarks,
service marks and trade names appearing in this report
are the property of their respective owners, and are
likewise used for identification purposes only.
This report is a service available
only to active Paid Premium Members.
You may opt-out of receiving report notifications
at any time. Questions or comments may be submitted
by writing to Premium Membership Services 665 S.E. 10 Street, Suite 201 Deerfield Beach, FL 33441-5634 or by calling 1-800-965-8307
or 954-785-1121.
|
|
|