You are not logged in.
This means you
CAN ONLY VIEW reports that were published prior to Thursday, March 20, 2025.
You
MUST UPGRADE YOUR MEMBERSHIP if you want to see any current reports.
AFTER MARKET UPDATE - TUESDAY, FEBRUARY 9TH, 2021
Previous After Market Report Next After Market Report >>>
|
|
|
|
DOW |
-9.93 |
31,375.83 |
-0.03% |
|
Volume |
891,933,420 |
-8% |
|
Volume |
8,607,063,300 |
+3% |
|
NASDAQ |
+20.06 |
14,007.70 |
+0.14% |
|
Advancers |
1,855 |
58% |
|
Advancers |
2,301 |
59% |
|
S&P 500 |
-4.36 |
3,911.23 |
-0.11% |
|
Decliners |
1,348 |
42% |
|
Decliners |
1,622 |
41% |
|
Russell 2000 |
+9.24 |
2,299.00 |
+0.40% |
|
52 Wk Highs |
332 |
|
|
52 Wk Highs |
656 |
|
|
S&P 600 |
+8.12 |
1,295.39 |
+0.63% |
|
52 Wk Lows |
2 |
|
|
52 Wk Lows |
10 |
|
|
 |
Breadth Positive While Major Indices Ended Little Changed
Kenneth J. Gruneisen - Passed the CAN SLIM® Master's Exam
The Dow lost 9 points, while the S&P 500 dipped 0.1%, with both benchmarks snapping a six-day winning streak that had been their longest stretch of gains since August. The Nasdaq Composite edged up 0.1%, closing at a record level for a fourth straight session. Small caps outperformed, with the Russell 2000 climbing 0.4%, propelling the group to its longest winning streak since 2019. The volume totals were mixed, lighter than the prior session on the NYSE and higher on the Nasdaq exchange. Advancers led decliners by a 9-7 margin on the NYSE and by an 11-8 margin on the Nasdaq exchange. There were 116 high-ranked companies from the Leaders List that hit new 52-week highs and were listed on the BreakOuts Page, versus the total of 126 on the prior session. New 52-week highs totals easily outnumbered new 52-week lows totals on both exchanges. The major indices are in a confirmed uptrend (M criteria) with healthy leadership provided by many stocks hitting new highs. Investors are reminded to always make buying and selling decisions based based on the strict criteria and rules of the fact-based investment system. PICTURED: The Dow Jones Industrial Average pulled back from a record high after 6 consecutive gains.
All U.S. stocks fluctuated on Tuesday, as investors took a breather from a robust February rally. The moves followed Monday’s upbeat session, during which all three major averages rallied to fresh all-time highs.
Fiscal stimulus remained in focus, with White House officials noting the next coronavirus relief package would likely be passed through budget reconciliation. On the data front, the NFIB small business optimism index unexpectedly fell for a third consecutive month in January. Separately, the Jobs Openings and Labor Turnover Survey (JOLTS) revealed the number of job openings rose to 6.6 million in December from the prior 6.5 million figure. Treasuries ended little changed, with the yield on the 10-year note down one basis point to 1.16%.
Six of 11 S&P 500 sectors closed in positive territory, with the Energy and Materials groups leading laggards. In earnings, Take-Two Interactive (TTWO -6.1%) fell after the company failed to announce any new games in their pipeline following an earnings beat. Cosmetics maker Coty (COTY -15.11%) fell after reporting sales fell by 16% in the most recent quarter. HanesBrands (HBI +24.91%) surged following a top and bottom line beat. Elsewhere, Simon Property Group (SPG +3.65%) rose after providing an upbeat 2021 outlook. |
 Kenneth J. Gruneisen started out as a licensed stockbroker in August 1987, a couple of months prior to the historic stock market crash that took the Dow Jones Industrial Average down -22.6% in a single day. He has published daily fact-based fundamental and technical analysis on high-ranked stocks online for two decades. Through FACTBASEDINVESTING.COM, Kenneth provides educational articles, news, market commentary, and other information regarding proven investment systems that work in good times and bad.
Comments contained in the body of this report are technical opinions only and are not necessarily those of Gruneisen Growth Corp. The material herein has been obtained from sources believed to be reliable and accurate, however, its accuracy and completeness cannot be guaranteed. Our firm, employees, and customers may effect transactions, including transactions contrary to any recommendation herein, or have positions in the securities mentioned herein or options with respect thereto. Any recommendation contained in this report may not be suitable for all investors and it is not to be deemed an offer or solicitation on our part with respect to the purchase or sale of any securities. |
|
 |
Networking Index Posted Standout Gain
Kenneth J. Gruneisen - Passed the CAN SLIM® Master's Exam
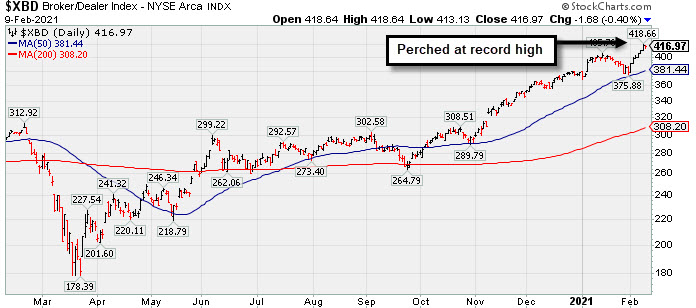
The Retail Index ($RLX -0.54%) and Broker/Dealer Index ($XBD -0.40%) created a drag on the major indices while the Bank Index ($BKX -0.04%) finished flat. The tech sector was mixed as the Biotech Index ($BTK -0.65%) and Semiconductor Index ($SOX -0.45%) both edged lower while the Networking Index ($NWX +1.19%) posted a standout gain. Commodity-linked groups had a negative bias as the Oil Services Index ($OSX -1.86%) and Integrated Oil Index ($XOI -1.44%) both outpaced the Gold & Silver Index ($XAU -0.45%) to the downside.
PICTURED: The Broker/Dealer Index ($XBD -0.40%) paused after hitting new record highs.
| Oil Services |
$OSX |
51.60 |
-0.98 |
-1.86% |
+16.40% |
| Integrated Oil |
$XOI |
895.95 |
-13.05 |
-1.44% |
+13.06% |
| Semiconductor |
$SOX |
3,064.53 |
-13.94 |
-0.45% |
+9.62% |
| Networking |
$NWX |
837.49 |
+9.82 |
+1.19% |
+16.79% |
| Broker/Dealer |
$XBD |
416.97 |
-1.68 |
-0.40% |
+10.43% |
| Retail |
$RLX |
3,681.68 |
-20.09 |
-0.54% |
+3.32% |
| Gold & Silver |
$XAU |
143.92 |
-0.65 |
-0.45% |
-0.19% |
| Bank |
$BKX |
108.03 |
-0.05 |
-0.04% |
+10.34% |
| Biotech |
$BTK |
6,278.99 |
-40.77 |
-0.65% |
+9.41% |
|
|
|
 |
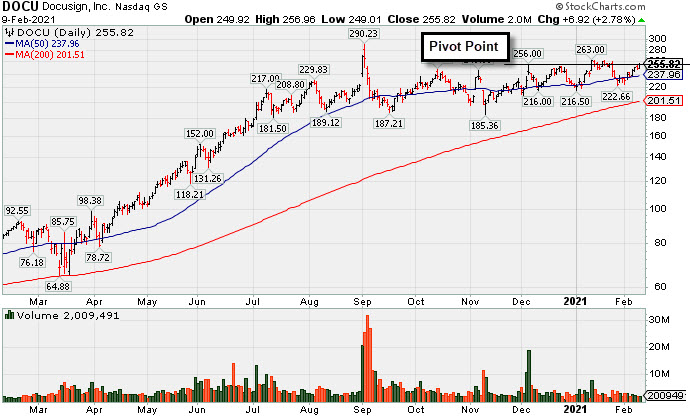
Consolidating Back Above 50-Day Moving Average Near Prior High
Kenneth J. Gruneisen - Passed the CAN SLIM® Master's Exam
Docusign Inc (DOCU +$6.92 or +2.78% to $255.82) has posted several gains with below average volume since recently rebounding above the 50-day moving average (DMA) line ($238). It faces little resistance due to overhead supply. The prior low ($216.50 on 1/04/21) defines the next important support to watch. DOCU finished strong after highlighted in yellow with pivot point cited based on its 12/04/20 high plus 10 cents in the 1/12/21 mid-day report (read here). However, it stalled and sputtered since last shown in this FSU section on 1/12/21 with an annotated graph under the headline, "Twice Average Volume Behind Breakout Gain".
Fundamentals remain strong. It has an Earnings Per Share Rating of 84. It reported very strong July and Oct '20 quarterly results versus the year ago periods. The past 6 quarterly comparisons versus the year ago period were well above the +25% minimum guideline with solid underlying sales revenues growth. After years of losses it had solid earnings in FY '19 and '20.
The number of top-rated funds owning its shares rose from 558 on Jun '19 to 1,418 in Dec '20, a reassuring sign concerning the I criteria. Its current Up/Down Volume Ratio of 1.5 also is an unbiased indication its shares have been under accumulation over the past 50 days. The Computer Software-Enterprise industry group is currently ranked 81st of the 197 Industry Groups (L criteria), however there are several strong stocks in the group showing confirming leadership.
|
|
|
Color Codes Explained :
Y - Better candidates highlighted by our
staff of experts.
G - Previously featured
in past reports as yellow but may no longer be buyable under the
guidelines.
***Last / Change / Volume data in this table is the closing quote data***
Symbol/Exchange
Company Name
Industry Group |
PRICE |
CHANGE
(%Change) |
Day High |
Volume
(% DAV)
(% 50 day avg vol) |
52 Wk Hi
% From Hi |
Featured
Date |
Price
Featured |
Pivot Featured |
|
Max Buy |
 CRL
-
NYSE
CRL
-
NYSE
Charles River Labs Intl
DRUGS - Biotechnology
|
$277.85
|
+1.20
0.43% |
$280.48
|
307,718
108.73% of 50 DAV
50 DAV is 283,000
|
$284.60
-2.37%
|
12/17/2020
|
$247.06
|
PP = $257.98
|
|
MB = $270.88
|
Most Recent Note - 2/8/2021 2:43:52 PM
G - Rebounded above its "max buy" level near its prior high and its color code is changed to green. Recently tested and found prompt support at the prior high ($257) and its 50 DMA line ($255). Reported Sep '20 quarterly earnings +38% on +11% sales revenues versus the year ago period, above the +25% minimum earnings guideline (C criteria).
>>> FEATURED STOCK ARTICLE : Testing Important Support on Pullback - 1/29/2021 |
View all notes |
Set NEW NOTE alert |
Company Profile |
SEC
News |
Chart |
Request a new note
C
A
S
I |
AMD
-
NYSE
Advanced Micro Devices
ELECTRONICS - Semiconductor - Broad Line
|
$90.91
|
-0.56
-0.61% |
$93.30
|
37,379,217
84.46% of 50 DAV
50 DAV is 44,259,300
|
$99.23
-8.38%
|
11/18/2020
|
$82.54
|
PP = $88.72
|
|
MB = $93.16
|
 Most Recent Note - 2/9/2021 5:40:13 PM
G - Rebounded near its 50 DMA line ($91.89) which may act as resistance. A rebound above the 50 DMA line is needed for its outlook to improve. Its current Relative Strength rating of 68 is still below the 80+ minimum guideline for buy candidates. Fundamentals remain strong after it reported Dec '20 quarterly earnings +63% on +53% sales revenues versus the year ago period.
>>> FEATURED STOCK ARTICLE : Distributional Pressure Brings Pullback Below "Max Buy" Level - 1/13/2021 |
View all notes |
Set NEW NOTE alert |
Company Profile |
SEC
News |
Chart |
Request a new note
C
A
S
I |
AMRC
-
NYSE
Ameresco Inc Cl A
ENERGY - Alternative
|
$69.41
|
+1.44
2.12% |
$69.73
|
498,620
110.31% of 50 DAV
50 DAV is 452,000
|
$69.62
-0.30%
|
12/15/2020
|
$46.72
|
PP = $47.10
|
|
MB = $49.46
|
Most Recent Note - 2/5/2021 5:21:47 PM
G - Hit a new all-time high with today's big gain. It did not form a sound base of sufficient length. Its 50-day moving average (DMA) line ($52.48) defines near-term support to watch above prior highs in the $46-47 area.
>>> FEATURED STOCK ARTICLE : Rebounding After Retreat From Record High - 2/1/2021 |
View all notes |
Set NEW NOTE alert |
Company Profile |
SEC
News |
Chart |
Request a new note
C
A
S
I |
TREX
-
NYSE
Trex Company Inc
MATERIALS and CONSTRUCTION - General Building Materials
|
$104.44
|
+1.00
0.97% |
$104.66
|
623,360
90.47% of 50 DAV
50 DAV is 689,000
|
$104.46
-0.02%
|
6/26/2020
|
$54.53
|
PP = $66.47
|
|
MB = $69.79
|
Most Recent Note - 2/8/2021 2:45:50 PM
G - Touched a new all-time high with today's 3rd consecutive gain backed by below average volume. Its 50 DMA line ($86.55) and prior highs in the $80-81 area define important support to watch on pullbacks. Sep '20 quarterly earnings were +14% on +19% sales revenues versus the year ago period, below the +25% minimum guideline (C criteria) raising fundamental concerns.
>>> FEATURED STOCK ARTICLE : Hit New All-Time High With Gain Backed by Average Volume - 1/19/2021 |
View all notes |
Set NEW NOTE alert |
Company Profile |
SEC
News |
Chart |
Request a new note
C
A
S
I |
CLFD
-
NASDAQ
Clearfield Inc
TELECOMMUNICATIONS - Cables / Satalite Equipment
|
$34.85
|
+0.28
0.81% |
$35.94
|
140,025
102.96% of 50 DAV
50 DAV is 136,000
|
$37.54
-7.17%
|
1/20/2021
|
$31.38
|
PP = $28.42
|
|
MB = $29.84
|
Most Recent Note - 2/8/2021 12:13:41 PM
G - Challenging its prior high with today's 4th consecutive gain, extended from any sound base. Prior highs in the $28 area define initial support to watch above its 50 DMA line ($27.50). Reported Dec '20 quarterly earnings +475% on +40% sales revenues versus the year ago period, continuing its strong earning track record.
>>> FEATURED STOCK ARTICLE : Perched Near Record High With Earnings Report Due Soon - 1/27/2021 |
View all notes |
Set NEW NOTE alert |
Company Profile |
SEC
News |
Chart |
Request a new note
C
A
S
I |
Symbol/Exchange
Company Name
Industry Group |
PRICE |
CHANGE
(%Change) |
Day High |
Volume
(% DAV)
(% 50 day avg vol) |
52 Wk Hi
% From Hi |
Featured
Date |
Price
Featured |
Pivot Featured |
|
Max Buy |
NOW
-
NYSE
Servicenow Inc
Computer Sftwr-Enterprse
|
$581.78
|
-6.13
-1.04% |
$588.60
|
1,633,344
119.41% of 50 DAV
50 DAV is 1,367,800
|
$598.37
-2.77%
|
8/20/2020
|
$453.34
|
PP = $454.79
|
|
MB = $477.53
|
Most Recent Note - 2/5/2021 5:03:09 PM
G - Hit new all-time highs with recent gains backed by light volume. A new pivot point was not cited due to fundamental concerns noted as its impressive rally has continued. Gapped up on 1/28/21 promptly rebounding above its 50 DMA line ($538.84). Fundamental concerns remain after it reported Dec '20 quarterly earnings +22% on +31% sales revenues versus the year ago period, its 2nd consecutive comparison below the +25% minimum guideline (C criteria) of the fact-based investment system. See the latest FSU analysis for more details and a new annotated graph.
>>> FEATURED STOCK ARTICLE : Hit New Highs With Latest Gains Backed by Light Volume - 2/5/2021 |
View all notes |
Set NEW NOTE alert |
Company Profile |
SEC
News |
Chart |
Request a new note
C
A
S
I |
SMPL
-
NASDAQ
Simply Good Foods Co
Food-Confectionery
|
$29.67
|
+0.21
0.71% |
$29.93
|
310,205
25.72% of 50 DAV
50 DAV is 1,206,200
|
$32.03
-7.37%
|
12/28/2020
|
$30.40
|
PP = $31.44
|
|
MB = $33.01
|
Most Recent Note - 2/8/2021 3:07:20 PM
G - Posting a gain today with lighter than average volume. Its Relative Strength Rating is 64, still below the 80+ minimum guideline. Its 50 DMA line ($27.23) and prior low ($26.78) define near term support to watch.
>>> FEATURED STOCK ARTICLE : Relative Strength Rating Suffered During Stalling Action - 1/21/2021 |
View all notes |
Set NEW NOTE alert |
Company Profile |
SEC
News |
Chart |
Request a new note
C
A
S
I |
ALRM
-
NASDAQ
Alarm.com Holdings Inc
Security/Sfty
|
$104.60
|
+3.25
3.21% |
$105.13
|
290,178
63.22% of 50 DAV
50 DAV is 459,000
|
$108.67
-3.75%
|
2/9/2021
|
$71.88
|
PP = $108.67
|
|
MB = $114.10
|
Most Recent Note - 2/9/2021 5:39:32 PM
Y - Rebounding toward its prior high with today's gain backed by below average volume. Color code is changed to yellow as a valid secondary buy point exists up to 5% above the prior high since it found support at its 10 week moving average (WMA) line ($97.31).
>>> FEATURED STOCK ARTICLE : Encountered Distributional Pressure After Big Rally - 1/20/2021 |
View all notes |
Set NEW NOTE alert |
Company Profile |
SEC
News |
Chart |
Request a new note
C
A
S
I |
TEAM
-
NASDAQ
Atlassian Corp Plc Cl A
Comp Sftwr-Spec Enterprs
|
$248.05
|
+3.67
1.50% |
$248.23
|
1,113,634
77.34% of 50 DAV
50 DAV is 1,440,000
|
$251.28
-1.29%
|
10/12/2020
|
$193.77
|
PP = $199.60
|
|
MB = $209.58
|
Most Recent Note - 2/8/2021 5:17:07 PM
G - Quietly touched a new high today. Rebounded impressively from a brief dip below its 50 DMA line ($232.94). Recent low ($208.62 on 1/27/21) defines important near-term support to watch. Its current Relative Strength Rating is 72, below the +80 minimum guideline for buy candidates. Fundamental concerns remain after earnings rose +0% on +23% sales revenues for the Dec '20 quarter versus the year ago period, its 2nd comparison below the +25% minimum earnings guideline (C criteria). See the latest FSU analysis for more details and a new annotated graph.
>>> FEATURED STOCK ARTICLE : Quietly Touched a New High Despite Fundamental Concerns Noted - 2/8/2021 |
View all notes |
Set NEW NOTE alert |
Company Profile |
SEC
News |
Chart |
Request a new note
C
A
S
I |
SHOP
-
NYSE
Shopify Inc Cl A
Computer Sftwr-Enterprse
|
$1,432.99
|
+87.90
6.53% |
$1,453.49
|
2,115,952
164.92% of 50 DAV
50 DAV is 1,283,000
|
$1,348.26
6.28%
|
2/2/2021
|
$1,218.72
|
PP = $1,285.28
|
|
MB = $1,349.54
|
Most Recent Note - 2/9/2021 12:47:52 PM
G - Color code is changed to green after rallying well above its "max buy" level and hitting a new all-time high with today's 4th consecutive gain. Found prompt support near its 50 DMA line ($1,156). Prior low ($1,076 on 1/06/21) defines the next important support to watch.
>>> FEATURED STOCK ARTICLE : Perched Within Striking Distance of New Pivot Point - 2/3/2021 |
View all notes |
Set NEW NOTE alert |
Company Profile |
SEC
News |
Chart |
Request a new note
C
A
S
I |
Symbol/Exchange
Company Name
Industry Group |
PRICE |
CHANGE
(%Change) |
Day High |
Volume
(% DAV)
(% 50 day avg vol) |
52 Wk Hi
% From Hi |
Featured
Date |
Price
Featured |
Pivot Featured |
|
Max Buy |
YETI
-
NYSE
Yeti Holdings Inc
Leisure-Products
|
$77.22
|
+1.60
2.12% |
$78.48
|
976,409
74.48% of 50 DAV
50 DAV is 1,311,000
|
$80.89
-4.54%
|
11/5/2020
|
$57.25
|
PP = $55.14
|
|
MB = $57.90
|
Most Recent Note - 2/8/2021 3:09:19 PM
G - Rebounding further above the 50 DMA line ($69.93) with today's 4th consecutive gain backed by below average volume. It has not formed a sound base of sufficient length. Prior low ($64.80) on 2/01/21) defines important near term support below its 50 DMA line.
>>> FEATURED STOCK ARTICLE : 50-Day Moving Average and Prior Lows Define Near-Term Support - 1/22/2021 |
View all notes |
Set NEW NOTE alert |
Company Profile |
SEC
News |
Chart |
Request a new note
C
A
S
I |
BJ
-
NYSE
BJs Wholesale Club Hldgs
Retail-DiscountandVariety
|
$43.72
|
+0.33
0.76% |
$44.35
|
864,638
36.04% of 50 DAV
50 DAV is 2,398,800
|
$50.16
-12.84%
|
1/28/2021
|
$44.74
|
PP = $47.56
|
|
MB = $49.94
|
Most Recent Note - 2/5/2021 5:14:44 PM
Y - Suffered a 3rd consecutive loss today with below average volume. Abruptly retreated after a volume-driven breakout on 1/27/21 capped a 7 session winning streak.
>>> FEATURED STOCK ARTICLE : Pulled Back After Breakout Capped 7-Day Winning Streak - 1/28/2021 |
View all notes |
Set NEW NOTE alert |
Company Profile |
SEC
News |
Chart |
Request a new note
C
A
S
I |
DOCU
-
NASDAQ
Docusign Inc
Computer Sftwr-Enterprse
|
$255.82
|
+6.92
2.78% |
$256.96
|
2,010,232
56.37% of 50 DAV
50 DAV is 3,566,000
|
$290.23
-11.86%
|
1/12/2021
|
$253.50
|
PP = $256.10
|
|
MB = $268.91
|
Most Recent Note - 2/9/2021 5:34:06 PM
Y - Wedging higher since its rebound above the 50 DMA line ($238) helped its outlook improve. Faces little resistance due to overhead supply. The prior low ($216.50 on 1/04/21) defines the next important support to watch. Fundamentals remain strong. See the latest FSU analysis for more details and a new annotated graph.
>>> FEATURED STOCK ARTICLE : Consolidating Back Above 50-Day Moving Average Near Prior High - 2/9/2021 |
View all notes |
Set NEW NOTE alert |
Company Profile |
SEC
News |
Chart |
Request a new note
C
A
S
I |
DT
-
NYSE
Dynatrace Inc
Computer Sftwr-Enterprse
|
$55.16
|
-0.95
-1.69% |
$56.77
|
2,758,540
112.41% of 50 DAV
50 DAV is 2,454,000
|
$56.62
-2.58%
|
2/4/2021
|
$51.39
|
PP = $48.95
|
|
MB = $51.40
|
Most Recent Note - 2/5/2021 5:20:37 PM
G - Color code is changed to green after today's 5ht consecutive volume-driven gain for a new all-time high. Fundamentals remain strong after it reported Dec '20 earnings +70% on +28% sales revenues versus the year ago period. Found support near its 200 DMA line during the consolidation after dropped from the Featured Stocks list on 9/08/20. See the latest FSU analysis for more details and an annotated graph.
>>> FEATURED STOCK ARTICLE : Breakout Action Returns Dynatrace to Featured Stocks List - 2/4/2021 |
View all notes |
Set NEW NOTE alert |
Company Profile |
SEC
News |
Chart |
Request a new note
C
A
S
I |
QTWO
-
NYSE
Q2 Holdings Inc
Computer Sftwr-Financial
|
$144.12
|
+0.57
0.40% |
$144.86
|
408,904
83.96% of 50 DAV
50 DAV is 487,000
|
$143.75
0.26%
|
11/12/2020
|
$105.14
|
PP = $106.54
|
|
MB = $111.87
|
Most Recent Note - 2/8/2021 3:03:02 PM
G - Inching to another new high with today's gain, getting more extended from any sound base. Its 50 DMA line ($126.22) defines important near term support to watch on pullbacks.
>>> FEATURED STOCK ARTICLE : Perched Near All-Time High Stubbornly Holding Ground - 1/26/2021 |
View all notes |
Set NEW NOTE alert |
Company Profile |
SEC
News |
Chart |
Request a new note
C
A
S
I |
Symbol/Exchange
Company Name
Industry Group |
PRICE |
CHANGE
(%Change) |
Day High |
Volume
(% DAV)
(% 50 day avg vol) |
52 Wk Hi
% From Hi |
Featured
Date |
Price
Featured |
Pivot Featured |
|
Max Buy |
AXON
-
NASDAQ
Axon Enterprise Inc
Security/Sfty
|
$183.16
|
+0.77
0.42% |
$184.89
|
397,007
65.84% of 50 DAV
50 DAV is 603,000
|
$182.48
0.37%
|
12/22/2020
|
$127.84
|
PP = $130.51
|
|
MB = $137.04
|
Most Recent Note - 2/9/2021 5:42:01 PM
G - Very extended from any sound base, it posted an 8th consecutive gain today with light volume. Its 50 DMA line ($141) and prior high ($134) define important support to watch on pullbacks. Fundamentals remain strong. Formerly traded under the ticker symbol AAXN where prior notes and detailed analysis may be reviewed.
>>> FEATURED STOCK ARTICLE : Extended From Prior Base Following Streak fo Volume-Driven Gains - 2/2/2021 |
View all notes |
Set NEW NOTE alert |
Company Profile |
SEC
News |
Chart |
Request a new note
C
A
S
I |
|
|
|
THESE ARE NOT BUY RECOMMENDATIONS!
Comments contained in the body of this report are technical
opinions only. The material herein has been obtained
from sources believed to be reliable and accurate, however,
its accuracy and completeness cannot be guaranteed.
This site is not an investment advisor, hence it does
not endorse or recommend any securities or other investments.
Any recommendation contained in this report may not
be suitable for all investors and it is not to be deemed
an offer or solicitation on our part with respect to
the purchase or sale of any securities. All trademarks,
service marks and trade names appearing in this report
are the property of their respective owners, and are
likewise used for identification purposes only.
This report is a service available
only to active Paid Premium Members.
You may opt-out of receiving report notifications
at any time. Questions or comments may be submitted
by writing to Premium Membership Services 665 S.E. 10 Street, Suite 201 Deerfield Beach, FL 33441-5634 or by calling 1-800-965-8307
or 954-785-1121.
|
|
|