You are not logged in.
This means you
CAN ONLY VIEW reports that were published prior to Tuesday, March 25, 2025.
You
MUST UPGRADE YOUR MEMBERSHIP if you want to see any current reports.
AFTER MARKET UPDATE - FRIDAY, FEBRUARY 5TH, 2021
Previous After Market Report Next After Market Report >>>
|
|
|
|
DOW |
+92.38 |
31,148.24 |
+0.30% |
|
Volume |
937,546,366 |
-7% |
|
Volume |
6,611,148,900 |
-7% |
|
NASDAQ |
+77.93 |
13,855.68 |
+0.57% |
|
Advancers |
2,137 |
67% |
|
Advancers |
2,545 |
66% |
|
S&P 500 |
+15.09 |
3,886.83 |
+0.39% |
|
Decliners |
1,055 |
33% |
|
Decliners |
1,330 |
34% |
|
Russell 2000 |
+30.91 |
2,233.33 |
+1.40% |
|
52 Wk Highs |
286 |
|
|
52 Wk Highs |
478 |
|
|
S&P 600 |
+14.47 |
1,252.75 |
+1.17% |
|
52 Wk Lows |
2 |
|
|
52 Wk Lows |
6 |
|
|
 |
Leadership Improved as Major Indices Rose
Kenneth J. Gruneisen - Passed the CAN SLIM® Master's Exam
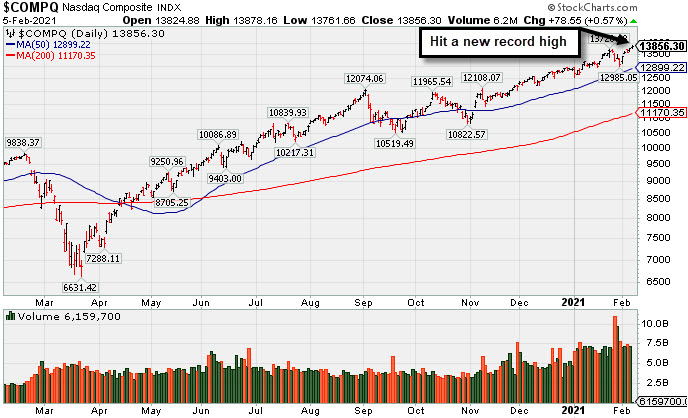
The Dow added 92 points, extending its weekly advance to 3.9%. The S&P 500 and Nasdaq Composite both closed at new record highs, rising 0.4% and 0.6%, respectively. For the week, the tech-heavy Nasdaq Composite outperformed with a 6.0% surge, while the S&P 500 jumped 4.7%. All three U.S. benchmarks posted their best weekly performance since November. The volume totals on Friday were lighter than the prior session on the NYSE and on the Nasdaq exchange. Advancers led decliners by a 2-1 margin on the NYSE and nearly 2-1 on the Nasdaq exchange. There were 100 high-ranked companies from the Leaders List that hit new 52-week highs and were listed on the BreakOuts Page, versus the total of 63 on the prior session. New 52-week highs totals expanded and easily outnumbered new 52-week lows totals which were in the single digits on both exchanges for a 4th consecutive session. The major indices are in a confirmed uptrend (M criteria) with healthy leadership provided by many stocks hitting new highs. Investors are reminded to always make buying and selling decisions based based on the strict criteria and rules of the fact-based investment system. PICTURED: The Nasdaq Composite Index hit a new record high.
U.S. stocks climbed for a fifth consecutive session on Friday, as a disappointing monthly jobs report bolstered fiscal stimulus expectations. On the data front, nonfarm payrolls rose by just 49,000 in January, below expectations for a 105,000 uptick but better than the downwardly revised 227,000 drop in December. The unemployment rate fell to 6.3% from the prior 6.7% figure. Meanwhile, the House approved the $1.9 trillion stimulus bill that was passed in the Senate overnight, advancing a process known as reconciliation. Lawmakers will finalize the details of the package in the next several weeks, and Democrats are widely expected to pass the measure with a simple majority in the Senate. Treasuries were mixed, with the 10-year note yield adding three basis points to 1.17%.
Ten of 11 S&P 500 sectors ended in positive territory, with Materials and Communication Services outperforming. The Technology group bucked the uptrend amid weakness in chipmakers. In earnings, Gilead Sciences (GILD +4.00%) rose after sales of its COVID-19 treatment outpaced Wall Street's expectations. Peloton (PTON -5.86%) fell after the at-home fitness equipment maker said improvements to its supply chain may weigh on margins. Elsewhere, Johnson & Johnson (JNJ +1.52%) rose after the company requested FDA emergency use authorization for its one-shot coronavirus vaccine. |
 Kenneth J. Gruneisen started out as a licensed stockbroker in August 1987, a couple of months prior to the historic stock market crash that took the Dow Jones Industrial Average down -22.6% in a single day. He has published daily fact-based fundamental and technical analysis on high-ranked stocks online for two decades. Through FACTBASEDINVESTING.COM, Kenneth provides educational articles, news, market commentary, and other information regarding proven investment systems that work in good times and bad.
Comments contained in the body of this report are technical opinions only and are not necessarily those of Gruneisen Growth Corp. The material herein has been obtained from sources believed to be reliable and accurate, however, its accuracy and completeness cannot be guaranteed. Our firm, employees, and customers may effect transactions, including transactions contrary to any recommendation herein, or have positions in the securities mentioned herein or options with respect thereto. Any recommendation contained in this report may not be suitable for all investors and it is not to be deemed an offer or solicitation on our part with respect to the purchase or sale of any securities. |
|
 |
Gold & Silver, Biotech, Networking, and Broker/Dealer Indexes Rose
Kenneth J. Gruneisen - Passed the CAN SLIM® Master's Exam
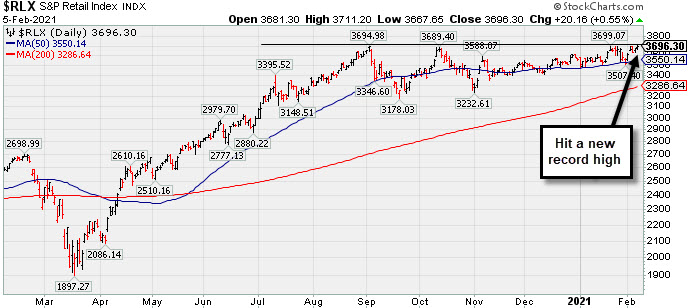
The Broker/Dealer Index ($XBD +1.28%) and Retail Index ($RLX +0.55%) both rose while the Bank Index ($BKX -0.07%) finished flat. The Networking Index ($NWX +1.82%) and Biotech Index ($BTK +1.37%) both posted solid gains while the Semiconductor Index ($SOX -0.77%) backpedaled. The Gold & Silver Index ($XAU +2.87%) posted a standout gain while the Oil Services Index ($OSX +0.14%) and Integrated Oil Index ($XOI +0.40%) both edged higher.
PICTURED: The Retail Index ($RLX +0.55%) hit a new record high.
| Oil Services |
$OSX |
51.00 |
+0.07 |
+0.14% |
+15.04% |
| Integrated Oil |
$XOI |
870.83 |
+3.48 |
+0.40% |
+9.89% |
| Semiconductor |
$SOX |
2,985.14 |
-23.27 |
-0.77% |
+6.78% |
| Networking |
$NWX |
805.60 |
+14.41 |
+1.82% |
+12.34% |
| Broker/Dealer |
$XBD |
410.79 |
+5.21 |
+1.28% |
+8.79% |
| Retail |
$RLX |
3,696.30 |
+20.16 |
+0.55% |
+3.73% |
| Gold & Silver |
$XAU |
141.45 |
+3.94 |
+2.87% |
-1.90% |
| Bank |
$BKX |
106.28 |
-0.08 |
-0.07% |
+8.55% |
| Biotech |
$BTK |
6,237.92 |
+84.60 |
+1.37% |
+8.69% |
|
|
|
 |
Hit New Highs With Latest Gains Backed by Light Volume
Kenneth J. Gruneisen - Passed the CAN SLIM® Master's Exam
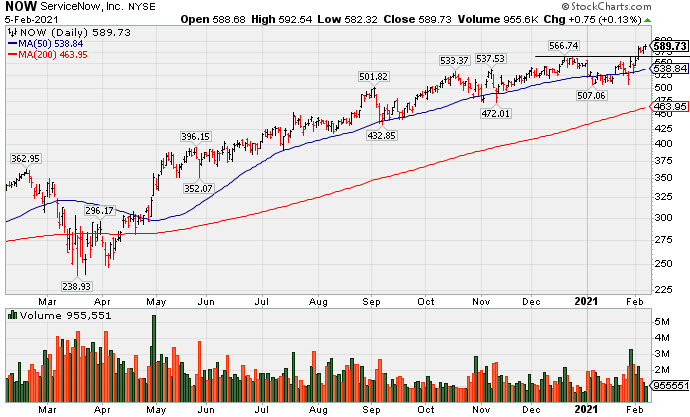
ServiceNow Inc (NOW +$0.75 or +0.13% to $589.73) hit new 52-week and all-time highs with today's quiet gain. Gains this week cleared a new 6-week flat base. A new pivot point was not cited due to fundamental concerns noted as its impressive rally has continued. It gapped up on 1/28/21 promptly rebounding above its 50-day moving average (DMA) line ($538.84). But fundamental concerns remain after it reported Dec '20 quarterly earnings +22% on +31% sales revenues versus the year ago period, its 2nd consecutive comparison below the +25% minimum guideline (C criteria) of the fact-based investment system.
A slump in the group has raised some concerns regarding the L criteria. The Computer Software - Enterprise group currently has a Group Relative Strength Rating of B- (52). It was last shown in this FSU section on 1/08/21 with an annotated graph under the headline, "Gain Today and Rebound Above 50-Day Moving Average Line"
It reported Jun '20 quarterly earnings +73% on +28% sales revenues versus the year ago period and prior results had been routinely above the +25% minimum earnings guideline (C criteria). It has an Earnings Per Share Rating of 97. NOW has a new CEO as of 1/01/20.
NOW traded up as much as +65.2% since first highlighted in yellow in the 4/30/20 mid-day report with a pivot point based on its 2/19/20 high plus 10 cents (read here). The number of top-rated funds owning its shares rose from 1,030 in Jun '17 to 2.509 in Dec '20, a reassuring sign concerning the I criteria. It has a Timeliness Rating of B and a Sponsorship Rating of B. Its current Up/Down Volume Ratio of 1.2 is an unbiased indication its shares have been under slight accumulation over the past 50 days. |
|
|
Color Codes Explained :
Y - Better candidates highlighted by our
staff of experts.
G - Previously featured
in past reports as yellow but may no longer be buyable under the
guidelines.
***Last / Change / Volume data in this table is the closing quote data***
Symbol/Exchange
Company Name
Industry Group |
PRICE |
CHANGE
(%Change) |
Day High |
Volume
(% DAV)
(% 50 day avg vol) |
52 Wk Hi
% From Hi |
Featured
Date |
Price
Featured |
Pivot Featured |
|
Max Buy |
 CRL
-
NYSE
CRL
-
NYSE
Charles River Labs Intl
DRUGS - Biotechnology
|
$275.76
|
+5.80
2.15% |
$275.96
|
283,415
100.29% of 50 DAV
50 DAV is 282,600
|
$284.60
-3.11%
|
12/17/2020
|
$247.06
|
PP = $257.98
|
|
MB = $270.88
|
Most Recent Note - 2/1/2021 12:39:35 PM
Y - Losses last week tested important support at the prior high ($257) and its 50 DMA line ($251). Reported Sep '20 quarterly earnings +38% on +11% sales revenues versus the year ago period, above the +25% minimum earnings guideline (C criteria).
>>> FEATURED STOCK ARTICLE : Testing Important Support on Pullback - 1/29/2021 |
View all notes |
Set NEW NOTE alert |
Company Profile |
SEC
News |
Chart |
Request a new note
C
A
S
I |
AMD
-
NYSE
Advanced Micro Devices
ELECTRONICS - Semiconductor - Broad Line
|
$87.90
|
+0.06
0.07% |
$88.36
|
29,602,399
66.72% of 50 DAV
50 DAV is 44,368,100
|
$99.23
-11.42%
|
11/18/2020
|
$82.54
|
PP = $88.72
|
|
MB = $93.16
|
Most Recent Note - 2/2/2021 5:34:58 PM
G - Posted a small gain today on very light volume. Fundamentals remain strong after it reported Dec '20 quarterly earnings +63% on +53% sales revenues versus the year ago period. Damaging volume-driven losses recently violated the 50 DMA line ($91.52) hurting its outlook. A rebound above the 50 DMA line is needed for its outlook to improve. Its current Relative Strength rating of 70 is still below the 80+ minimum guideline for buy candidates.
>>> FEATURED STOCK ARTICLE : Distributional Pressure Brings Pullback Below "Max Buy" Level - 1/13/2021 |
View all notes |
Set NEW NOTE alert |
Company Profile |
SEC
News |
Chart |
Request a new note
C
A
S
I |
AMRC
-
NYSE
Ameresco Inc Cl A
ENERGY - Alternative
|
$65.27
|
+2.44
3.88% |
$65.46
|
476,220
103.98% of 50 DAV
50 DAV is 458,000
|
$64.60
1.04%
|
12/15/2020
|
$46.72
|
PP = $47.10
|
|
MB = $49.46
|
 Most Recent Note - 2/5/2021 5:21:47 PM
G - Hit a new all-time high with today's big gain. It did not form a sound base of sufficient length. Its 50-day moving average (DMA) line ($52.48) defines near-term support to watch above prior highs in the $46-47 area.
>>> FEATURED STOCK ARTICLE : Rebounding After Retreat From Record High - 2/1/2021 |
View all notes |
Set NEW NOTE alert |
Company Profile |
SEC
News |
Chart |
Request a new note
C
A
S
I |
TREX
-
NYSE
Trex Company Inc
MATERIALS and CONSTRUCTION - General Building Materials
|
$99.99
|
+1.81
1.84% |
$100.78
|
574,677
83.41% of 50 DAV
50 DAV is 689,000
|
$104.35
-4.18%
|
6/26/2020
|
$54.53
|
PP = $66.47
|
|
MB = $69.79
|
Most Recent Note - 2/1/2021 4:48:34 PM
G - Rebounded toward its all-time high with today's big gain on average volume after a streak of 4 straight volume-driven losses. Its 50 DMA line ($84.15) and prior highs in the $80-81 area define important support to watch on pullbacks. Sep '20 quarterly earnings were +14% on +19% sales revenues versus the year ago period, below the +25% minimum guideline (C criteria) raising fundamental concerns.
>>> FEATURED STOCK ARTICLE : Hit New All-Time High With Gain Backed by Average Volume - 1/19/2021 |
View all notes |
Set NEW NOTE alert |
Company Profile |
SEC
News |
Chart |
Request a new note
C
A
S
I |
CLFD
-
NASDAQ
Clearfield Inc
TELECOMMUNICATIONS - Cables / Satalite Equipment
|
$33.08
|
+0.29
0.88% |
$33.68
|
115,453
89.50% of 50 DAV
50 DAV is 129,000
|
$37.54
-11.88%
|
1/20/2021
|
$31.38
|
PP = $28.42
|
|
MB = $29.84
|
Most Recent Note - 2/1/2021 12:37:42 PM
G - Extended from any sound base after a streak of volume-driven gains. Prior highs in the $28 area define initial support to watch above its 50 DMA line ($26.52). Reported Dec '20 quarterly earnings +475% on +40% sales revenues versus the year ago period, continuing its strong earning track record.
>>> FEATURED STOCK ARTICLE : Perched Near Record High With Earnings Report Due Soon - 1/27/2021 |
View all notes |
Set NEW NOTE alert |
Company Profile |
SEC
News |
Chart |
Request a new note
C
A
S
I |
Symbol/Exchange
Company Name
Industry Group |
PRICE |
CHANGE
(%Change) |
Day High |
Volume
(% DAV)
(% 50 day avg vol) |
52 Wk Hi
% From Hi |
Featured
Date |
Price
Featured |
Pivot Featured |
|
Max Buy |
NOW
-
NYSE
Servicenow Inc
Computer Sftwr-Enterprse
|
$589.73
|
+0.75
0.13% |
$592.54
|
942,664
68.44% of 50 DAV
50 DAV is 1,377,300
|
$589.00
0.12%
|
8/20/2020
|
$453.34
|
PP = $454.79
|
|
MB = $477.53
|
Most Recent Note - 2/5/2021 5:03:09 PM
G - Hit new all-time highs with recent gains backed by light volume. A new pivot point was not cited due to fundamental concerns noted as its impressive rally has continued. Gapped up on 1/28/21 promptly rebounding above its 50 DMA line ($538.84). Fundamental concerns remain after it reported Dec '20 quarterly earnings +22% on +31% sales revenues versus the year ago period, its 2nd consecutive comparison below the +25% minimum guideline (C criteria) of the fact-based investment system. See the latest FSU analysis for more details and a new annotated graph.
>>> FEATURED STOCK ARTICLE : Hit New Highs With Latest Gains Backed by Light Volume - 2/5/2021 |
View all notes |
Set NEW NOTE alert |
Company Profile |
SEC
News |
Chart |
Request a new note
C
A
S
I |
SMPL
-
NASDAQ
Simply Good Foods Co
Food-Confectionery
|
$28.62
|
-0.06
-0.21% |
$29.20
|
428,083
34.50% of 50 DAV
50 DAV is 1,240,900
|
$32.03
-10.65%
|
12/28/2020
|
$30.40
|
PP = $31.44
|
|
MB = $33.01
|
Most Recent Note - 2/3/2021 5:22:02 PM
G - Pulled back today with lighter than average volume. Its Relative Strength Rating is 70, still below the 80+ minimum guideline. Its 50 DMA line ($26.89) and prior low ($26.78) define near term support in the area to watch.
>>> FEATURED STOCK ARTICLE : Relative Strength Rating Suffered During Stalling Action - 1/21/2021 |
View all notes |
Set NEW NOTE alert |
Company Profile |
SEC
News |
Chart |
Request a new note
C
A
S
I |
ALRM
-
NASDAQ
Alarm.com Holdings Inc
Security/Sfty
|
$102.12
|
+5.84
6.07% |
$102.16
|
666,773
146.54% of 50 DAV
50 DAV is 455,000
|
$108.67
-6.03%
|
11/6/2020
|
$71.88
|
PP = $74.76
|
|
MB = $78.50
|
Most Recent Note - 2/5/2021 12:04:48 PM
G - Rebounding toward its prior high with today's big gain backed by above average volume. It has not formed a sound base of sufficient length yet found support well above its 50 DMA line ($92.25).
>>> FEATURED STOCK ARTICLE : Encountered Distributional Pressure After Big Rally - 1/20/2021 |
View all notes |
Set NEW NOTE alert |
Company Profile |
SEC
News |
Chart |
Request a new note
C
A
S
I |
TEAM
-
NASDAQ
Atlassian Corp Plc
Comp Sftwr-Spec Enterprs
|
$243.80
|
+2.80
1.16% |
$244.35
|
956,376
64.12% of 50 DAV
50 DAV is 1,491,600
|
$250.03
-2.49%
|
10/12/2020
|
$193.77
|
PP = $199.60
|
|
MB = $209.58
|
Most Recent Note - 2/5/2021 5:18:51 PM
G - Recently rebounded from below its 50 DMA line ($232) to challenge its 52-week high. Recent low ($208.62 on 1/27/21) defines important near-term support to watch. Its current Relative Strength Rating is 69, below the +80 minimum guideline for buy candidates. Earnings rose +0% on +23% sales revenues for the Dec '20 quarter versus the year ago period, its 2nd comparison below the +25% minimum earnings guideline (C criteria), raising fundamental concerns.
>>> FEATURED STOCK ARTICLE : Relative Strength Rating Remains Below 80+ Minimum Guideline - 1/11/2021 |
View all notes |
Set NEW NOTE alert |
Company Profile |
SEC
News |
Chart |
Request a new note
C
A
S
I |
SHOP
-
NYSE
Shopify Inc Cl A
Computer Sftwr-Enterprse
|
$1,287.75
|
+26.88
2.13% |
$1,296.78
|
1,034,324
80.87% of 50 DAV
50 DAV is 1,279,000
|
$1,285.19
0.20%
|
2/2/2021
|
$1,218.72
|
PP = $1,285.28
|
|
MB = $1,349.54
|
Most Recent Note - 2/3/2021 5:20:15 PM
Y - Held its ground today following big volume-driven gain on the prior session. A new pivot point was cited based on its 12/22/20 high plus 10 cents. Faces little resistance due to overhead supply up to the $1,285 level. Subsequent gains and a close above the pivot point backed by at least +40% above average volume may trigger a new (or add-on) technical buy signal. Found prompt support near its 50 DMA line ($1,129). Prior low ($1,076 on 1/06/21) defines the next important support to watch. See the latest FSU analysis for more details and a new annotated graph.
>>> FEATURED STOCK ARTICLE : Perched Within Striking Distance of New Pivot Point - 2/3/2021 |
View all notes |
Set NEW NOTE alert |
Company Profile |
SEC
News |
Chart |
Request a new note
C
A
S
I |
Symbol/Exchange
Company Name
Industry Group |
PRICE |
CHANGE
(%Change) |
Day High |
Volume
(% DAV)
(% 50 day avg vol) |
52 Wk Hi
% From Hi |
Featured
Date |
Price
Featured |
Pivot Featured |
|
Max Buy |
YETI
-
NYSE
Yeti Holdings Inc
Leisure-Products
|
$72.92
|
+0.85
1.18% |
$73.73
|
842,553
63.69% of 50 DAV
50 DAV is 1,323,000
|
$80.89
-9.85%
|
11/5/2020
|
$57.25
|
PP = $55.14
|
|
MB = $57.90
|
Most Recent Note - 2/4/2021 5:34:53 PM
G - Rebound above the 50 DMA line with today's big gain helped its outlook improve, however, it has not formed a sound base of sufficient length. Prior low ($64.80) on 2/01/21) defines important near term support below its 50 DMA line.
>>> FEATURED STOCK ARTICLE : 50-Day Moving Average and Prior Lows Define Near-Term Support - 1/22/2021 |
View all notes |
Set NEW NOTE alert |
Company Profile |
SEC
News |
Chart |
Request a new note
C
A
S
I |
BJ
-
NYSE
BJs Wholesale Club Hldgs
Retail-DiscountandVariety
|
$41.89
|
-0.16
-0.38% |
$42.43
|
1,298,696
52.41% of 50 DAV
50 DAV is 2,478,000
|
$50.18
-16.52%
|
1/28/2021
|
$44.74
|
PP = $47.56
|
|
MB = $49.94
|
Most Recent Note - 2/5/2021 5:14:44 PM
Y - Suffered a 3rd consecutive loss today with below average volume. Abruptly retreated after a volume-driven breakout on 1/27/21 capped a 7 session winning streak.
>>> FEATURED STOCK ARTICLE : Pulled Back After Breakout Capped 7-Day Winning Streak - 1/28/2021 |
View all notes |
Set NEW NOTE alert |
Company Profile |
SEC
News |
Chart |
Request a new note
C
A
S
I |
DOCU
-
NASDAQ
Docusign Inc
Computer Sftwr-Enterprse
|
$250.37
|
+4.36
1.77% |
$251.00
|
2,522,381
70.64% of 50 DAV
50 DAV is 3,570,800
|
$290.23
-13.73%
|
1/12/2021
|
$253.50
|
PP = $256.10
|
|
MB = $268.91
|
Most Recent Note - 2/4/2021 5:36:20 PM
Y - Rebounded above the 50 DMA line ($236) this week helping its outlook improve. Faces some resistance due to overhead supply. The prior low ($216.50 on 1/04/21) defines the next important support to watch. Fundamentals remain strong.
>>> FEATURED STOCK ARTICLE : Twice Average Volume Behind Breakout Gain - 1/12/2021 |
View all notes |
Set NEW NOTE alert |
Company Profile |
SEC
News |
Chart |
Request a new note
C
A
S
I |
DT
-
NYSE
Dynatrace Inc
Computer Sftwr-Enterprse
|
$55.46
|
+3.71
7.17% |
$55.70
|
3,744,813
153.48% of 50 DAV
50 DAV is 2,440,000
|
$53.17
4.31%
|
2/4/2021
|
$51.39
|
PP = $48.95
|
|
MB = $51.40
|
Most Recent Note - 2/5/2021 5:20:37 PM
G - Color code is changed to green after today's 5ht consecutive volume-driven gain for a new all-time high. Fundamentals remain strong after it reported Dec '20 earnings +70% on +28% sales revenues versus the year ago period. Found support near its 200 DMA line during the consolidation after dropped from the Featured Stocks list on 9/08/20. See the latest FSU analysis for more details and an annotated graph.
>>> FEATURED STOCK ARTICLE : Breakout Action Returns Dynatrace to Featured Stocks List - 2/4/2021 |
View all notes |
Set NEW NOTE alert |
Company Profile |
SEC
News |
Chart |
Request a new note
C
A
S
I |
QTWO
-
NYSE
Q2 Holdings Inc
Computer Sftwr-Financial
|
$142.57
|
+4.33
3.13% |
$142.76
|
598,856
124.76% of 50 DAV
50 DAV is 480,000
|
$142.76
-0.13%
|
11/12/2020
|
$105.14
|
PP = $106.54
|
|
MB = $111.87
|
Most Recent Note - 2/2/2021 12:47:44 PM
G - Rebounding near the prior high with today's big gain, but it is extended from any sound base. Its 50 DMA line ($124) defines important near term support to watch on pullbacks.
>>> FEATURED STOCK ARTICLE : Perched Near All-Time High Stubbornly Holding Ground - 1/26/2021 |
View all notes |
Set NEW NOTE alert |
Company Profile |
SEC
News |
Chart |
Request a new note
C
A
S
I |
Symbol/Exchange
Company Name
Industry Group |
PRICE |
CHANGE
(%Change) |
Day High |
Volume
(% DAV)
(% 50 day avg vol) |
52 Wk Hi
% From Hi |
Featured
Date |
Price
Featured |
Pivot Featured |
|
Max Buy |
AXON
-
NASDAQ
Axon Enterprise Inc
Security/Sfty
|
$177.18
|
+1.84
1.05% |
$178.52
|
183,568
30.24% of 50 DAV
50 DAV is 607,000
|
$180.69
-1.94%
|
12/22/2020
|
$127.84
|
PP = $130.51
|
|
MB = $137.04
|
Most Recent Note - 2/4/2021 5:32:22 PM
G - Posted a 5th consecutive gain today with light volume. Very extended from any sound base. Its 50 DMA line ($137.68) and prior high ($134) define important support to watch on pullbacks. Fundamentals remain strong. See the latest FSU analysis for more details and an annotated graph. Formerly traded under the ticker symbol AAXN where prior notes and detailed analysis may be reviewed.
>>> FEATURED STOCK ARTICLE : Extended From Prior Base Following Streak fo Volume-Driven Gains - 2/2/2021 |
View all notes |
Set NEW NOTE alert |
Company Profile |
SEC
News |
Chart |
Request a new note
C
A
S
I |
|
|
|
THESE ARE NOT BUY RECOMMENDATIONS!
Comments contained in the body of this report are technical
opinions only. The material herein has been obtained
from sources believed to be reliable and accurate, however,
its accuracy and completeness cannot be guaranteed.
This site is not an investment advisor, hence it does
not endorse or recommend any securities or other investments.
Any recommendation contained in this report may not
be suitable for all investors and it is not to be deemed
an offer or solicitation on our part with respect to
the purchase or sale of any securities. All trademarks,
service marks and trade names appearing in this report
are the property of their respective owners, and are
likewise used for identification purposes only.
This report is a service available
only to active Paid Premium Members.
You may opt-out of receiving report notifications
at any time. Questions or comments may be submitted
by writing to Premium Membership Services 665 S.E. 10 Street, Suite 201 Deerfield Beach, FL 33441-5634 or by calling 1-800-965-8307
or 954-785-1121.
|
|
|